Processing math: 100%
ARTICLE   Open Access    

Identification and content analysis of volatile components in 100 cultivars of Chinese herbaceous peony

  • # Authors contributed equally: Aixin Wang, Yasang Luo

More Information
  • Herbaceous peony (Paeonia lactiflora Pall.) is a well-known and traditional flower in China, occupying a significant position in Chinese traditional culture. The floral scent of the herbaceous peony however remains relatively understudied. The objective of this study was to investigate the floral composition of herbaceous peony by collecting and identifying floral volatiles from 100 cultivars, including P. lactiflora 'Hangbaishao', P. lactiflora 'Hongrongqiu', P. lactiflora 'Biandihong', P. lactiflora 'Zijin Daipao', P. lactiflora 'Zixia Yingxue', and P. lactiflora 'Fenchi Dicui'. The volatile compounds were collected using the dynamic headspace technique and identified through gas chromatography-mass spectrometry (GC-MS). The results demonstrated qualitative and quantitative variations in the floral fragrances emitted by the 100 cultivars, with a total of 16 volatiles belonging to six categories (six alkanes, three alcohols and esters, two terpenes, as well as one each of ether and phenol) being identified. However, it is notable that not all volatile categories were emitted by every cultivar. Moreover, while some compounds were present in all 100 herbaceous peony cultivars, others were exclusive to specific cultivars. The screening revealed that ten of the 16 identified flower volatile compounds exhibited unique floral components. It is noteworthy that benzene,1,4-dimethoxy-, was identified as the most prominent compound in several cultivars, including P. lactiflora 'Taohua Huancai', P. lactiflora 'Xishifen', P. lactiflora 'Dabanhong', P. lactiflora 'Fumantang', and P. lactiflora 'Zhushapan'. Furthermore, the clustering classification results demonstrated that benzene,1,4-dimethoxy-, exhibited the highest variable importance in projection (VIP) value of 3.153, as determined by partial least squares discriminant analysis (PLS-DA).
  • Plant growth is seriously affected by abiotic stresses such as drought, low temperature and soil salinity. Drought is of particular concern in view of the predicted consequences of global climate change[1]. Severe episodes of drought stress lead to a shut down of photosynthesis, disturb the plant's core metabolism and can lead to plant death[2]. Plants have evolved a range of strategies, such as physical (leaf surface morphology), biochemical adaption and transcriptional reprograming, to combat drought stress[3,4].

    In the process of long-term evolution, plants have formed a series of physical defenses with their own organizational structures to resist the damage of the external environment, such as trichome and waxy cuticles[5]. Trichomes are hairy appendages on the surface of plants, which protect plant tissues from insects and ultraviolet (UV), and increase the tolerance of plants to drought stress[6]. The development of the cuticle, comprising a lipid layer (cutin) intermeshed and coated with wax, is one of the major adaptations for withstanding short term drought stress[7]. The cutin molecule is composed of cross-linked C16 and C18 ω-hydroxyl fatty acids, while the wax is a complex mixture of long-chain fatty acids and their derived alcohols, aldehydes, alkanes, ketones, and wax esters[8,9]. An increased deposition of cuticular wax has been associated with higher levels of drought tolerance in both rice and Arabidopsis thaliana[10,11]. Under drought conditions, the phytohormone abscisic acid (ABA), a key regulator of leaf stomatal conductance, is triggered[12,13]. Due to increase of ABA level under drought, the guard cell forcibly closes the stomata to reduce transpirational water loss, and inhibits photosynthesis by preventing the entry of CO2[2,14,15]. At the same time, the shrinkage in cell volume caused by water shortage increases the viscosity of the cellular content, hindering normal enzymatic function as a consequence[16]. A drought stress-induced loss in photosynthetic activity can also generate oxidative stress on account of the build-up of reactive oxygen species (ROS)[17,18]. Under normal conditions, plants scavenge ROS by a range of enzymatic and non-enzymatic means[19]. The capacity to neutralize ROS has been associated with the level of drought tolerance in a number of plant species[2022]. Some plant species also show a pronounced capacity to adjust the cellular osmotic environment in response to drought stress by accumulating highly soluble non-toxic compounds such as sugars (sucrose, trehalose and sorbitol), free amino acids (proline) and amines (glycine betaine and polyamines)[23,24].

    The ornamental species chrysanthemum (Chrysanthemum morifolium) is widely appreciated as a source of cut flowers and pot plants. Most chrysanthemum cultivars are very vulnerable to drought stress, but some of the wild relatives of C. morifolium have been identified as important reservoirs of genetic variation relevant for drought tolerance improvement[25,26]. Since the physiological response of Chrysanthemum spp. to drought stress is poorly understood, we set out to study leaf surface morphology and the response of key antioxidant enzymes, photosynthesis and endogenous levels of ABA to artificially induced drought stress in C. nankingense and C. japonense, two species characterized by a differential level of drought tolerance.

    The accessions of C. nankingense (drought-sensitive) and C. japonense (drought-tolerant) were obtained from the Chrysanthemum Germplasm Resource Preserving Centre, Nanjing Agricultural University, China. Rooted cuttings (six leaf stage) were grown hydroponically in Hoagland solution (pH 5.8) under a 12 h photoperiod (300 µmol·m−2·s−1 photosynthetically active radiation), a relative humidity of 70% and a day/night temperature of 25/20 °C. The material was acclimated to these conditions for six days before the imposition of polyethylene glycol (PEG)-induced drought stress. Following the method of Zhang et al.[27], the plants were transferred for two, four, six, eight or 10 h into a solution of 20% w/v PEG 6000 dissolved in Hoagland, generating a potential of ~ −0.52 MPa. Control plants were retained in half strength Hoagland's solution (−0.01 MPa). The experiment was set out as a completely randomized split-plot with three replications (six plants per species per replication). The physiological and biochemical assays were conducted on the third or fourth leaves below the apex of the shoot.

    Leaf wilting was rated visually on a scale of zero (no observable wilting) to five (severely wilted)[27]. The relative water content (RWC) of leaves was estimated following the methods of Galmés et al.[28]. Each data point represented the mean of three independent leaves.

    The morphology of the leaf surface was observed by scanning electron microscopy, according to the methods of He et al.[29]. To calculate the density of trichome and stomata, each sample was observed under six different scope visual fields. Cuticular waxes were extracted from 0.2 g fully expanded leaves by incubating in 10 ml chloroform for 30 s at room temperature. An internal standard was provided by adding 5 µg n-tetracosane (C24) to each sample. The solvent was evaporated under a mild nitrogen stream, then redissolved in a mixture of 100 μl pyridine, 100 μl bis-N,N-(trimethylsilyl)-trifluoroacetamide (Macherey-Nagal, Düren, Germany). After heating at 70 °C for 1 h, the solvent was evaporated again under nitrogen and the samples redissolved in 200 μl chloroform. Qualitative and quantitative composition analyses followed the methods of Lee et al.[30]. A 1 μl aliquot was separated by GC–MS (Agilent 7890A-5975C, USA) and quantification was based on the internal standard.

    Leaf samples were stored at −80 °C after quick freezing in liquid nitrogen. The frozen leaf segments (0.25 g) were ground to a powder in liquid nitrogen, and soluble protein was extracted by homogenization in 1 ml 50 mM potassium phosphate buffer (pH 7.0) containing 1 mM EDTA and 1% w/v polyvinyl pyrrolidone 40. The supernatant of centrifuged homogenate (12,000 g, 15 min, 4 °C) is directly used for subsequent enzyme analysis. Total protein content was determined according to the Bradford dye-binding method[31]. Superoxide dismutase (SOD) activity assay was performed following the method of Giannopolitis & Ries[32] with minor modifications. Each 3 ml reaction mixture (50 mM potassium phosphate buffer (pH 7.8), 13 mM L-methionine, 75 μM nitroblue tetrazolium (NBT), 2 μM riboflavin, 1 mM EDTA and 100 μl supernatant) was illuminated for 10 min in white fluorescent light (100 µmol·m−2·s−1). Then the SOD activity was measured at 560 nm. Peroxidase (POD) activity was measured by monitoring the increase in absorbance at 470 nm caused by the oxidation of guaiacol, which was slightly modified according to the method of Li[33]. Each 3 ml reaction was initiated by adding 20 μl 40 mM H2O2 into 2.9 ml 50 mM phosphate buffered saline (PBS) (pH 7.0), 50 μl 20 mM guaiacol and 30 μl supernatant. PBS was used as blank control instead of supernatant. The catalase (CAT) assay was based on method of Beers & Sizer[34] with minor modifications. Each 3 ml reaction was initiated by adding 50 mM potassium phosphate buffer (pH 7.0), 15 mM H2O2 and 100 μl supernatant. Ascorbate peroxidase (APX) activity was assayed following the method of Nakano & Asada[35] with minor modifications. Each 3 ml reaction was initiated by adding 50 mM potassium phosphate buffer (pH 7.0), 0.5 mM ascorbate, 0.1 mM H2O2 and 100 μl supernatant.

    Cell membrane stability was determined by measuring electrolyte leakage (EL). Following the method of Hu et al.[36], whole fully expanded leaves were sliced and incubated in 10 ml distilled deionized water on a shaker for 24 h. The conductance of the solution at 24 h was taken as the initial level (Ci). Thereafter, the material heated to 100 °C for 10 min, and the conductance of the solution (Cmax) was determined again. The EL was calculated by the expression (Ci/Cmax) × 100%. For lipid peroxidation analysis, the MDA content was measured using the thiobarbituric acid (TBA) method described by Heath & Packer[37] with minor modifications. Fresh leaf tissue (0.5 g) was ground and extracted in 5 ml 5% w/v trichloroacetic acid (TCA). The homogenate was centrifuged (12,000 g, 5 min), and 2 ml of the supernatant was added to 2 ml 0.67% w/v TBA (prepared in 10% v/v TCA). The mixture was rapidly cooled after heating to 100°C for 30 min, and centrifuged (12,000 g, 10 min). The absorbance of the supernatant was monitored at 532 nm. Correction of non-specific turbidity was obtained by subtracting the absorbance value taken at 600 nm. The level of lipid peroxidation was expressed as nmol per g fresh weight. Free proline was extracted and determined as described by Bates et al.[38] with minor modifications.

    Chlorophyll (0.1 g) was extracted in 95% ethanol for 48 h and the absorbance of the supernatant detected at 470, 649 and 665 nm. The quantity of total chlorophyll (a + b) was determined as described by Li[33]. The net photosynthetic rate (Pn), stomatal conductance (Gs), transpiration rate (Tr), and intercellular CO2 concentration (Ci) of fully expanded leaves were monitored using a LI-COR 6400 portable photosynthesis system (LI-COR, Lincoln, NE, USA). The CO2 concentration in the chamber was 380 ± 10 µmol/mol and a photosynthetic photon flux density of 1000 µmol·m−2·s−1 at the leaf surface was provided by an LED red-blue light source (LI-COR 6400-02). The maximum quantum efficiency of PSII photochemistry (Fv/Fm) was determined in the same intact leaves according to the method of Liu et al.[39]. For each treatment, Pn, Gs, Tr, Ci and Fv/Fm values were obtained from five leaves at each time point.

    Frozen leaf (~1 g fresh weight) was ground in liquid nitrogen and homogenized for 12 h in 10 ml pre-cooled 80% v/v aqueous methanol under low light. The mixture was centrifuged (12,000 g, 4 °C, 10 min) and the pellet extracted twice in 10 ml 80% methanol at 4 °C under low light. The supernatant was filtered through a Sep-Pak C18 gel cartridge and freeze dried. The lyophilisate was redissolved in 1 ml methanol and passed through a 0.45 μm filter. Quantification of ABA was conducted by high performance liquid chromatography (HPLC) (Agilent Technologies 1100) as described by Ciha et al.[40] with minor modifications. The separation column was supplied by Agilent (HC-C18, 5 μm, 250 mm × 4.6 mm). The solvents were 0.6% v/v glacial acetic acid (A) and 100% methanol (B); the initial solvent was 100% A, moving to 50% A, 50% B over the subsequent 10 min, where it was held for 20 min. The solvent flow rate was 1 ml/min, the detection wavelength 254 nm and the column temperature 30 ± 0.2 °C. Quantification was based on calibration with known ABA standards (Sigma-Aldrich Chemie, Munich, Germany).

    All data are mean ± standard deviation (SD). IBM SPSS Statistics 17.0 software and Microsoft Excel 2007 was used for statistical analysis. A one-way analysis of variance, followed by Duncan’s multiple range test (with P set at 0.05/0.01), was employed to assess whether treatment means differed significantly from one another.

    The wilting index of unstressed plants was zero, and the stress induced wilting in both species (Fig. 1a). After 2 h of stress, the wilting index of C. japonense rose to one, and the lower leaves had wilted and had begun to droop (Y1 in Fig. 1a). Wilting set in earlier and was more severe in C. nankingense. By 2 h, its wilting index had already reached two, and its lower leaves were wilted and drooping (N1 in Fig. 1a); after 10 h, the wilting index was five and all the leaves appeared dehydrated and withered (N5 in Fig. 1a). At this stage, the wilting index of C. japonense was still only three and its uppermost leaves remained turgid (Y5 in Fig. 1a).

    Figure 1.  The response of C. japonense and C. nankingense to PEG-induced drought stress. (a) The morphological response of C. japonense and C. nankingense to PEG-induced drought stress. Y0-Y5, N0-N5: C. japonense (Y) and C. nankingense (N) plants subjected to, respectively, 0, 2, 4, 6, 8 and 10 h of stress. The wilting index ranges from 0 (no observable wilting) to 5 (severely wilted). Scale bars = 1 cm. (b) The response of leaf RWC to PEG-induced drought stress. Y: C. japonense, N: C. nankingense, C: Control (no PEG), T: PEG treatment. ** Value significant at P ≤ 0.01. Values given as mean ± SD (n = 3).

    The RWC of both species was maintained at the same level under non-stressed conditions (Fig. 1b), but declined markedly as a result of the stress treatment. The decline was more acute in C. nankingense than in C. japonense. The RWC in the leaf of the latter was significantly higher than in the former after only 4 h of PEG treatment, while after a 10 h exposure, the RWCs had fallen to, respectively, 62.3% and 73.3%.

    A marked difference in the appearance of the leaf surface was observed between the two species. The trichome density on the upper and lower leaf surface of the C. nankingense leaf was low (0.10 and 1.79 per mm2 respectively) (Table 1), while in contrast, C. japonense developed many trichomes especially on the lower leaf surface - the density on the upper leaf surface was 33.45 per mm2, while that on the lower surface was too high to count. The abundance of trichomes prevented the measurement of stomatal density, but on the upper leaf surface, stomatal density in the C. japonense was significantly greater than on the equivalent C. nankingense leaf surface (76.57 vs 11.96 per mm2, respectively) (Table 1), and the C. japonense gland cells were larger than those on the C. nankingense leaf (Fig. 2d, h).

    Table 1.  Variation in leaf surface morphology in C. japonense and C. nankingense.
    SpeciesUpper epidermis of leafLower epidermis of leaf
    Trichome density (mm−2)Stoma density (mm−2)Trichome density (mm−2)Stoma density (mm−2)
    C. japonense33.45 ± 1.46A76.57 ± 11.72 AN
    C. nankingense0.11 ± 0.12B11.96 ± 10.81B1.79 ± 0.47346.94 ± 24.73
    Values (given as mean ± SD) labeled with a different letters differed significantly (P ≤ 0.01) (n = 6). ∞ means too much to calculate. N means unable to observe because of the well-developed trichome layer covering lower epidermis of leaf.
     | Show Table
    DownLoad: CSV
    Figure 2.  Scanning electron microscopic images of the leaf surface of C. japonense (a-d) and C. nankingense (e-h). (a) and (e): upper leaf surface, (b) and (f): lower leaf surface, (c) and (g): a single trichome, (d) and (h): a single stomate.

    The total wax load on the C. japonense leaf was ~6.6 fold greater than on the C. nankingense leaf (Fig. 3a). There was also a significant difference between the species for cuticular wax composition. Fatty alcohols (include primary alcohols and secondary alcohols) were the predominant component (39.9%) of the C. japonense leaf wax, followed by esters (33.1%), alkanes (21.3%) and fatty acids (5.7%). In C. nankingense, fatty alcohols were even more predominant (49.8%), while the remainder was composed of alkanes (35.4%) and esters (14.8%). The level of fatty acids in C. nankingense cuticular wax was below the level of detection. Nine components were specific to the cuticular wax of C. japonense, namely C20 and C24 fatty acids, C14, C22 and C24 primary alcohols, and C16, C17, C31 and C32 esters. A C20 ester was the only component specific for C. nankingense. Eight components were shared: C26 and C28 primary alcohols, C30 secondary alcohol, C17, C24 and C32 alkanes, C30 ester (although its content was greater in C. japonense) and C30 primary alcohol (the content of this component was greater in C. nankingense) (Fig. 3b).

    Figure 3.  (a) Quantity and (b) composition of cuticular wax on the C. japonense (Y) and C. nankingense (N) leaf. ** Value significant at P ≤ 0.01. Bars indicate the SD of the mean (n = 3).

    The PEG treatment enhanced the activity of SOD, POD, CAT, and APX in both species. SOD activity was greater in C. japonense than in C. nankingense throughout the stress treatment (Fig. 4a). In C. japonense, it rose to 2.0 fold its background level after 8 h exposure and to 1.6 fold after 10 h, while in C. nankingense, the equivalent levels were 1.1 and 1.2 fold. POD activity tended to be greater in C. nankingense, although after 4 h of treatment it reached 1.9 fold of the background level in C. japonense, representing 1.3 fold the C. nankingense level (Fig. 4b). The background level of CAT activity was higher in C. nankingense than in C. japonense. In response to PEG treatment, it increased markedly in both species (Fig. 4c), reaching 1.3 and 1.6 fold of the background level in C. nankingense after, respectively, 2 h and 4 h of treatment. In C. japonense, CAT activity rose to 1.2 and 1.8 fold of the background after 2 h and 4 h of treatment, respectively. After 6 h of exposure, activity had risen to 1.4 (C. nankingense) and 2.0 (C. japonense) fold of the background level, although these levels were not statistically different from one another. As the stress was prolonged, CAT activity in C. japonense rose to nearly two fold the background level, but in C. nankingense, the increase was much more modest. APX activity was also greater in C. nankingense than in C. japonense under non-stressed conditions (Fig. 4d). The PEG treatment rapidly induced APX activity in C. nankingense,while that in C. japonense increased slowly. APX activity in C. nankingense reached 1.7 fold of background by 8 h, and 1.4 fold by 10 h, while in C. japonense, the equivalent levels were 3.0 fold and 3.3 fold.

    Figure 4.  Enzymatic activity (SOD (a), POD (b), CAT (c), and APX (d)) in the leaf of droughted C. japonense (Y) and C. nankingense (N) plants. C: Control (no PEG), T: PEG treatment. *, ** Value significant at P ≤ 0.05 or 0.01. Values given as mean ± SD (n = 3). SD’s indicated by a bar.

    Under control conditions, EL was maintained at a constant low level in both species (Fig. 5a). However, when subjected to PEG treatment, it increased as the time of exposure was lengthened. The C. nankingense EL was significantly higher than that of C. japonense throughout the whole period. By the end of the stress period treatment, it had reached 3.4 fold the control level in C. japonense and 3.8 fold in C. nankingense. The leaf MDA content behaved in a similar fashion (Fig. 5b), increasing in both species as the plants were exposed to stress. The increase set in earlier and was more pronounced in C. nankingense. After 2 h, the MDA content in the C. japonense leaf was no different from the background level, while in C. nankingense it had risen by 1.3 fold. By the end of the stress treatment, the MDA content of the C. japonense and C. nankingense leaves were, respectively 1.7 and 2.7 fold that of the non-stressed controls, indicating that the membrane lipid of C. nankingense was highly peroxidized and the cell membranes system seriously damaged.

    Figure 5.  (a) Electrolyte leakage and (b) MDA content in droughted leaves of C. japonense (Y) and C. nankingense (N). C: Control (no PEG), T: PEG treatment. ** Value significant at P ≤ 0.01. Values given as mean ± SD (n = 3).

    The accumulation of proline was negligible under control conditions, but the PEG treatment induced a significant accumulation in proline. C. japonense responded to water deficient stress more quickly, and accumulated more proline than C. nankingense (Fig. 6). The proline content in the C. japonense leaf was 1.6 and 2.4 fold of background at 2 h and 4 h respectively, and the corresponding levels were 1.2 and 1.6 fold in C. nankingense. The proline level in the C. japonense leaf was higher than that in the C. nankingense leaf throughout the stress treatment.

    Figure 6.  Free proline content in droughted leaves of C. japonense (Y) and C. nankingense (N). C: Control (no PEG), T: PEG treatment. ** Value significant at P ≤ 0.01. Values given as mean ± SD (n = 3). SD's indicated by a bar.

    Pn, Gs, Tr, Fv/Fm and chlorophyll content were negatively affected by drought stress in both species, while the Ci parameter increased. The background level of Pn in C. nankingense was ~8.7 μmol CO2 m−2·s−1, somewhat higher than in C. japonense. In plants subjected to stress, this parameter decreased more sharply in C. nankingense than in C. japonense (Fig. 7a). By 2 h, it had fallen to 0.7 (C. nankingense) and 0.9 (C. japonense) fold of the control, and remained higher in C. japonense than in C. nankingense during the rest of the treatment. By 10 h, it had fallen to 0.1 fold in C. japonense and close to zero in C. nankingense. Gs behaved in a similar way. It decreased more rapidly in C. nankingense than in C. japonense (Fig. 7b), and over the period 6−10 h, remained higher in C. japonense than in C. nankingense. Tr followed the same pattern. Under control conditions, it was higher in C. nankingense than in C. japonense (Fig. 7c), after 2 h of stress it had fallen to 0.8 fold the background in both species. As the stress was prolonged, Tr fell in C. nankingense to 0.6 (4 h), 0.3 (6 h) and 0.1 (8 h) fold of the background level, and in C. japonense to, respectively, 0.6, 0.4 and 0.3 fold at these time points. Under control conditions, the Ci of C. japonense was higher than that of C. nankingense. It increased significantly in C. nankingense in response to PEG treatment (Fig. 7d). In contrast, in C. japonense, it fell very slightly over the first four hours of stress, only rising above the background level thereafter. Its level was higher in C. nankingense than in C. japonense throughout the stress treatment. Under control conditions, the Fv/Fm ratio remained stable at > 0.8 (Fig. 7e); exposure to PEG stress had a negative effect on both species, particularly on C. nankingense. By the end of the treatment, the Fv/Fm of C. nankingense and C. japonense were, respectively 0.5 and 0.7 fold that of the background. Under control conditions, the chlorophyll content of the leaves of C. nankingense was significantly higher than in those of C. japonense, but it decreased more quickly in C. nankingense than in C. japonense when the plants were exposed to PEG treatment (Fig. 7f). By the end of the stress treatment, the chlorophyll content of C. nankingense was 0.6 fold and that of C. japonense was 0.8 fold the initial levels, and the chlorophyll content of C. japonense was significantly higher than that of C. nankingense.

    Figure 7.  Photosynthetic parameters (Pn (a), Gs (b), Tr (c), Ci (d), Fv/Fm (e) and chlorophyll (a + b) content (f)) in the droughted leaves of C. japonense (Y) and C. nankingense (N). C: Control (no PEG), T: PEG treatment. *, ** Value significant at P ≤ 0.05 or 0.01. Values given as mean ± SD (n = 5). SD’s indicated by a bar.

    The ABA content of the leaves of both species was consistently low under control conditions (Fig. 8), but increased markedly in response to PEG treatment. The response of C. japonense plants was much larger than that of C. nankingense plants. The ABA content in the C. japonense leaves increased rapidly over the first six hours of stress, and thereafter more slowly. The ABA content in the leaves of C. japonense was 1.7, 2.3 and 1.5 fold higher than in the leaves of C. nankingense at 2 h, 6 h and 10 h respectively.

    Figure 8.  ABA content in droughted leaves of C. japonense (Y) and C. nankingense (N). C: Control (no PEG), T: PEG treatment. ** Value significant at P ≤ 0.01. Values given as mean ± SD (n = 3). SD's indicated by a bar.

    C. nankingense, the more drought sensitive of the two Chrysanthemum spp., developed signs of drought-induced damage earlier than C. japonense and the wilting index of the former was consistently higher at each time point (Fig. 1a). In agreement with this differential response, the RWC of C. japonense was greater than that of C. nankingense (Fig. 1b), supporting the use of RWC as an indirect means of classifying crop varieties for their drought sensitivity[41,42].

    The leaf surfaces of the two species differs greatly. Leaf trichomes have been considered as a physical barrier against drought and high temperature stress[43]. They could increase water-use efficiency by increasing leaf boundary-layer resistance, thereby reducing transpirational water loss[44]. The more tolerant species developed a much higher density of trichomes on its leaves (Table 1). As this trait is readily visible, it would be attractive as an indirect selection criterion for improving drought tolerance[45]. Cuticular wax deposition represents an important mechanism for limiting non-stomatal water loss[46]. The quantity of cuticular wax on the surface of the leaves of C. japonense was markedly greater than on those of C. nankingense (Fig. 3a), consistent with their ranking with respect to drought tolerance. There were also significant differences between the two species with respect to the composition of cuticular wax (Fig. 3b), with the wax in the more tolerant species being richer in fatty alcohols and esters. Wax has been reported to affect the drought tolerance of plants in many species, among which, it has been reported the wax content of sunflower increased under drought condition[47]. To our knowledge, this is the first documented description of the composition of chrysanthemum cuticular wax.

    Drought stress is often accompanied by the accumulation of ROS, which induce oxidative stress[48]. Plants have evolved a number of means to scavenge ROS molecules, and the enzyme SOD is considered to be part of the first line of this defence[49]. SOD, CAT, APX, POD all reduces superoxide. The activity of all four of these enzymes was increased by drought stress in both species (Fig. 4), although SOD activity was enhanced more in C. japonense than in C. nankingense. Significant increases in the activity of both APX and CAT were observed in the early phase of the stress exposure, particularly in C. nankingense, while more modest increases were observed for C. japonense; enzyme activity remained higher in C. japonense than in C. nankingense after 6 h of stress. Experiments conducted in rice have similarly shown that the more tolerant cultivars tend to express higher levels of CAT and APX activity[50]. It has been suggested that in soybean[51] , sorghum[52] and sunflower[47], drought tolerance is associated with enhanced POD activity. However, this does not appear to apply to Chrysanthemum spp., since the level of POD activity was similar in both species after 10 h of stress (Fig. 4b). Drought stress induces extensive lipid peroxidation, allowing MDA (a by-product of lipid peroxidation) content to be exploited as an indicator of stress-induced oxidative damage to membranes[53,54]. Finally, EL provides a measure of cell integrity, and so has been frequently used as a surrogate for stress tolerance[55,56]. The levels of both EL and MDA in C. japonense were uniformly lower than in C. nankingense, at least over the first 10 h of stress treatment (Fig. 5), supporting the conclusion that C. japonense is a more drought tolerant species than C. nankingense.

    Plants take advantage of various molecules as osmoregulants, in particular the amino acid proline[57]. C. japonense with strong drought tolerance clearly accumulated more proline than C. nankingense when the plants were exposed to drought stress (Fig. 6), similar results were observed in other species including sunflower[47], rice[58] and Arabidopsis[24]. Proline contributes to the stabilization of sub-cellular structures, the scavenging of ROS and to buffering of cellular redox-potential under stress conditions[59]. The enhanced ability of the C. japonense leaf to accumulate proline thus may well provide a more favorable osmotic environment and a more stable cell membrane during episodes of drought stress.

    Photosynthesis is very sensitive to drought stress. The photosynthetic parameters Pn, Gs and Tr were all significantly compromised in both Chrysanthemum spp. by drought stress (Fig. 7ac). Zhang et al.[60] has similarly reported that moisture stressed Atractylodes lancea suffers a reduction in photosynthesis as measured by Gs and Pn. An early response to drought stress is stomatal closure, which serves to limit transpirational loss[61]. After 2 h of stress, C. nankingense had significant higher Tr than C. japonense (Fig. 7c), thus resulting in more water loss in leaves, which might explain faster loss in RWC of C. nankingense than that in C. japonense. Changes in Gs depend on leaf RWC[62], and Gs and Tr were both correlated with leaf RWC in both species. It is generally considered that drought-induced stomatal closure would certainly have suppressed photosynthesis[63,64]. Gs and Pn decreased rapidly in both species under PEG treatment (Fig. 7a, b). Under a more prolonged period of moisture deficiency, the leaf tissue becomes increasingly dehydrated, inducing metabolic impairment and a restriction in photophosphorylation capacity[62,65]. When stomatal conductance falls below a threshold of 50 mmol H2O m−2·s−1, limitations of non-stomatal processes become more important[66]. Here, Gs remained above this threshold in the first four hours of stress, but dropped below it by 6 h in C. nankingense but not in C. japonense (Fig. 7b), suggesting that the photosynthetic apparatus of C. nankingense suffered earlier and more severe damage. Ci increased slightly in both species under PEG stress (Fig. 7d), as also observed in cotton, vetiver grass and wheat[6769]. An overestimate in Ci could arise from heterogeneous (or 'patch') stomatal closure and cuticular conductance, which have been identified as potential sources of error in the calculation of Ci in drought affected plants[70]. This may explain why Ci rose at a time when Gs and the RWC were low. Dark-adapted Fv/Fm values and estimates of chlorophyll content decreased in both species under PEG stress (Fig. 7e, f). A decline in PSII quantum efficiency during periods of stress has been noted in a number of plant species[7173]. Low Fv/Fm ratios have been related to photoinhibition[74], since plants frequently absorb more light energy than they require for photosynthesis, particularly under drought conditions. Due to the limited reaction capacity of converting solar energy into chemical energy, excessive light absorption exacerbates the inactivation of PSII under drought, freeing electrons for the formation of ROS[75]. Both the Fv/Fm ratio and the chlorophyll content decreased more sharply for C. nankingense than for C. japonense. After 10 h of PEG stress, C. japonense leaves retained a higher chlorophyll content and a larger Fv/Fm ratio than those of C. nankingense (Fig. 7e, f), symptomatic of C. japonense being able to maintain a higher photosynthetic capacity under drought stress. Similarly, drought tolerant bean and edamame cultivars have been reported to retain a higher chlorophyll content and a superior Fv/Fm ratio than do more susceptible ones[76,77].

    ABA, one of the most important metabolites produced under drought stress, is known to regulate plant water balance and drought stress tolerance[78]. Analysis of ABA-deficient mutants and -related genes have shown that this hormone is essential for triggering many of the important responses to drought stress[79]. Here, it was obvious that the ABA level in the leaf of both species was greatly enhanced by the imposition of drought stress (Fig. 8). The ABA content was significantly higher in C. japonense than in C. nankingense. In droughted-stressed durum wheat, Mahdid et al. have shown that a more tolerant cultivar accumulated more ABA than did a less tolerant one[80]. ABA is thought to increase hydraulic conductivity from the roots to the transpiring tissues[81], acting in conjunction with ABA-induced stomatal closure to restore a favorable water status to the leaf tissue. Gs and ABA appeared to be negatively correlated in both species. ABA may also influence osmotic regulation, ion and solute transport loading in growing cells, and so play a vital role in both water retention and protein and membrane protection[82]. Low water potential-induced proline accumulation in A. thaliana requires wild-type levels of ABA[83], while drought-induced changes in the synthesis of proline have been shown to be ABA dependent[84]. ABA plays a role in the upstream of proline accumulation by regulating the expression of key enzyme genes of proline biosynthesis, which also improves the adaptation of rice to hypoxia stress to a certain extent[85]. The present data indicate that the improved capacity to accumulate proline shown by C. japonense may be associated with its enhanced ability to accumulate ABA.

    Overall, it is clear that these two Chrysanthemum species show contrasting responses to drought stress at the morphological, physiological and biochemical levels. The superior tolerance of C. japonense likely flows from a combination of its better developed trichome layer, its higher cuticular wax content, its more rapid and abundant accumulation of ABA, its more flexible photosynthesis capacity, and its more effective osmoprotective and antioxidative system. The evaluation of the drought tolerance of the two chrysanthemum species further enriched the drought tolerance germplasm resource bank of chrysanthemum, clarified the different physiological and biochemical responses of two chrysanthemum species with great differences in drought tolerance, which has certain guiding significance for further development and application of drought tolerance resources of chrysanthemum.

    This study is supported by the National Natural Science Foundation of China (31870306), the National Key Research and Development Program of China (2020YFE0202900), the Fundamental Research Funds for Central Universities (KYZZ2022004).

  • The authors declare that they have no conflict of interest.

  • [1]

    Sun J, Chen T, Wu Y, Tao J. 2021. Identification and functional verification of PLFT gene associated with flowering in herbaceous peony based on transcriptome analysis. Ornamental Plant Research 1(1):7

    doi: 10.48130/OPR-2021-0007

    CrossRef   Google Scholar

    [2]

    Zhang D, Xie A, Yang X, Shi Y, Yang L, et al. 2022. Study of 15 varieties of herbaceous peony pollen submicroscopic morphology and phylogenetic relationships. Horticulturae 8(12):1161

    doi: 10.3390/horticulturae8121161

    CrossRef   Google Scholar

    [3]

    Wang X, Shi X, Zhang R, Zhang K, Shao L, et al. 2022. Impact of summer heat stress inducing physiological and biochemical responses in herbaceous peony cultivars (P. lactiflora Pall.) from different latitudes. Industrial Crops and Products 184:115000

    doi: 10.1016/j.indcrop.2022.115000

    CrossRef   Google Scholar

    [4]

    Song C, Wang Q, Teixeira da Silva JA, Yu X. 2018. Identification of floral fragrances and analysis of fragrance patterns in herbaceous peony cultivars. Journal of the American Society for Horticultural Science 143(4):248−58

    doi: 10.21273/JASHS04420-18

    CrossRef   Google Scholar

    [5]

    Sun Y, Wang W, Zhao L, Zheng C, Ma F. 2019. Changes in volatile organic compounds and differential expression of aroma-related genes during flowering of Rosa rugosa 'Shanxian'. Horticulture, Environment, and Biotechnology 60:741−51

    doi: 10.1007/s13580-019-00166-0

    CrossRef   Google Scholar

    [6]

    Du F, Wang T, Fan JM, Liu ZZ, Zong JX, et al. 2019. Volatile composition and classification of Lilium flower aroma types and identification, polymorphisms, and alternative splicing of their monoterpene synthase genes. Horticulture Research 6:110

    doi: 10.1038/s41438-019-0192-9

    CrossRef   Google Scholar

    [7]

    Jin F, Xu J, Liu XR, Regenstein JM, Wang FJ. 2019. Roasted tree peony (Paeonia ostii) seed oil: benzoic acid levels and physicochemical characteristics. International Journal of Food Properties 22(1):499−510

    doi: 10.1080/10942912.2019.1588902

    CrossRef   Google Scholar

    [8]

    El-Hawary SS, El-Tantawi ME, Kirollos FN, Hammam WE. 2018. Chemical composition, in vitro cytotoxic and antimicrobial activities of volatile constituents from Pyrus communis L. and Malus domestica Borkh. fruits cultivated in Egypt. Journal of Essential Oil Bearing Plants 21(6):1642−51

    doi: 10.1080/0972060X.2018.1553637

    CrossRef   Google Scholar

    [9]

    Hu J, Huang W, Zhang F, Luo X, Chen Y, et al. 2020. Variability of volatile compounds in the medicinal plant Dendrobium officinale from different regions. Molecules 25(21):5046

    doi: 10.3390/molecules25215046

    CrossRef   Google Scholar

    [10]

    Liu G, Fu J, Wang L, Fang M, Zhang W, et al. 2023. Diverse O-methyltransferases catalyze the biosynthesis of floral benzenoids that repel aphids from the flowers of waterlily Nymphaea prolifera. Horticulture Research 10(12):uhad237

    doi: 10.1093/hr/uhad237

    CrossRef   Google Scholar

    [11]

    Pan Y, Quan W, Li C, Hao J, Gao Y. 2021. Analysis of allelochemicals in the leaves of four alpine rhododendrons by gas chromatography-mass spectrometry. BioResources 16(2):3096−102

    doi: 10.15376/biores.16.2.3096-3102

    CrossRef   Google Scholar

    [12]

    Bera P, Mukherjee C, Mitra A. 2017. Enzymatic production and emission of floral scent volatiles in Jasminum sambac. Plant Science 256:25−38

    doi: 10.1016/j.plantsci.2016.11.013

    CrossRef   Google Scholar

    [13]

    Yang L, Aobulikasimu·Nuerbiye, Cheng P, Wang JH, Li H. 2017. Analysis of floral volatile components and antioxidant activity of different varieties of Chrysanthemum morifolium. Molecules 22:1790

    doi: 10.3390/molecules22101790

    CrossRef   Google Scholar

    [14]

    Xin H, Wu B, Zhang H, Wang C, Li J, et al. 2013. Characterization of volatile compounds in flowers from four groups of sweet osmanthus (Osmanthus fragrans) cultivars. Canadian Journal of Plant Science 93(5):923−31

    doi: 10.4141/cjps2012-333

    CrossRef   Google Scholar

    [15]

    Pereira AG, Cassani L, Liu C, Li N, Chamorro F, et al. 2023. Camellia japonica flowers as a source of nutritional and bioactive compounds. Foods 12(15):2825

    doi: 10.3390/foods12152825

    CrossRef   Google Scholar

    [16]

    Yang S, Meng Z, Li Y, Chen R, Yang Y, et al. 2021. Evaluation of physiological characteristics, soluble sugars, organic acids and volatile compounds in 'Orin' apples (Malus domestica) at different ripening stages. Molecules 26(4):807

    doi: 10.3390/molecules26040807

    CrossRef   Google Scholar

    [17]

    Xiong H, Yang Y, Guo W, Yuan J, Yang W, et al. 2024. Study on quality difference between Belamcanda chinensis (L.) DC and Iris tectorum Maxim. based on chemical chromatogram analysis, biological activity evaluation and in vivo distribution rule. Journal of Ethnopharmacology 319:117091

    doi: 10.1016/j.jep.2023.117091

    CrossRef   Google Scholar

    [18]

    Wang Z, Zhao X, Tang X, Yuan Y, Xiang M, et al. 2023. Analysis of fragrance compounds in flowers of Chrysanthemum genus. Ornamental Plant Research 3:12

    doi: 10.48130/OPR-2023-0012

    CrossRef   Google Scholar

    [19]

    Li Z, Zhang X, Li K, Wang P, Li C, et al. 2022. Integrative analysis of transcriptomic and volatile compound profiles sheds new insights into the terpenoid biosynthesis in tree peony. Industrial Crops and Products 188:115672

    doi: 10.1016/j.indcrop.2022.115672

    CrossRef   Google Scholar

    [20]

    Knudsen JT, Gershenzon J. 2020. The chemical diversity of floral scent. In Biology of Plant Volatiles, 2nd edition, eds Pichersky E, Dudareva N. Boca Raton: CRC Press. pp. 57−78. doi: 10.1201/9780429455612-5

    [21]

    Stamm JD. 2023. The language of flowers in the time of COVID: finding solace in zen, nature and ikebana. US: John Hunt Publishing. pp. 152−53.

    [22]

    Nadeem MA, Dubey R, Singh A, Pandey R, Bundela KS. 2017. Processing and quality evaluation of menthol mint oil. International Journal Of Mathematics And Statistics Invention 5(2):68−70

    Google Scholar

    [23]

    Zhang Y, Li C, Wang S, Yuan M, Li B, et al. 2021. Transcriptome and volatile compounds profiling analyses provide insights into the molecular mechanism underlying the floral fragrance of tree peony. Industrial Crops and Products 162:113286

    doi: 10.1016/j.indcrop.2021.113286

    CrossRef   Google Scholar

    [24]

    Qiao Z, Hu H, Shi S, Yuan X, Yan B, et al. 2021. An update on the function, biosynthesis and regulation of floral volatile terpenoids. Horticulturae 7(11):451

    doi: 10.3390/horticulturae7110451

    CrossRef   Google Scholar

    [25]

    Li R, Song C, Niu T, Wei Z, Guo L, et al. 2023. The emitted pattern analysis of flower volatiles and cloning of PsGDS gene in tree peony cultivar 'High Noon'. Acta Horticulturae Sinica 50(2):331−44

    doi: 10.16420/j.issn.0513-353x.2021-0870

    CrossRef   Google Scholar

    [26]

    Zhao Q, Gu L, Li Y, Zhi H, Luo J, et al. 2023. Volatile composition and classification of Paeonia lactiflora flower aroma types and identification of the fragrance-related genes. International Journal of Molecular Sciences 24(11):9410

    doi: 10.3390/ijms24119410

    CrossRef   Google Scholar

    [27]

    Li S, Zhang L, Sun M, Lv M, Yang Y, et al. 2023. Biogenesis of flavor-related linalool is diverged and genetically conserved in tree peony (Paeonia × suffruticosa). Horticulture Research 10(2):uhac253

    doi: 10.1093/hr/uhac253

    CrossRef   Google Scholar

    [28]

    Wang S, Luo Y, Niu T, Prijic Z, Markovic T, et al. 2024. Comparative analysis of the volatile components of six herbaceous peony cultivars under ground-planted and vase-inserted conditions. Scientia Horticulturae 334:113320

    doi: 10.1016/j.scienta.2024.113320

    CrossRef   Google Scholar

    [29]

    Wu Y, Li L, Yuan W, Hu J , Lv Z. 2021. Application of GC × GC coupled with TOF–MS for the trace analysis of chemical components and exploration the characteristic aroma profile of essential oils obtained from two tree peony species (Paeonia rockii and Paeonia ostii). European Food Research and Technology 247:2591−608

    doi: 10.1007/s00217-021-03823-w

    CrossRef   Google Scholar

    [30]

    Li X, Wu J, Wang H, Zhang K, Song F. 2022. Evaluation and comparison of pear flower aroma characteristics of seven cultivars. Horticulturae 8(5):352

    doi: 10.3390/horticulturae8050352

    CrossRef   Google Scholar

    [31]

    Yang YH, Zhao J, Du ZZ. 2022. Unravelling the key aroma compounds in the characteristic fragrance of Dendrobium officinale flowers for potential industrial application. Phytochemistry 200:113223

    doi: 10.1016/j.phytochem.2022.113223

    CrossRef   Google Scholar

    [32]

    Kimani SK, Wang S, Xie J, Bao T, Shan X, et al. 2024. Integration of RNA-Seq and metabolite analysis reveals the key floral scent biosynthetic genes in herbaceous peony. Horticulturae 10(6):617

    doi: 10.3390/horticulturae10060617

    CrossRef   Google Scholar

    [33]

    Pott DM, Osorio S, Vallarino JG. 2019. From central to specialized metabolism: an overview of some secondary compounds derived from the primary metabolism for their role in conferring nutritional and organoleptic characteristics to fruit. Frontiers in Plant Science 10:835

    doi: 10.3389/fpls.2019.00835

    CrossRef   Google Scholar

    [34]

    Hirata H, Ohnishi T, Watanabe N. 2016. Biosynthesis of floral scent 2-phenylethanol in rose flowers. Bioscience, Biotechnology, and Biochemistry 80(10):1865−73

    doi: 10.1080/09168451.2016.1191333

    CrossRef   Google Scholar

    [35]

    Yetisen M, Guclu G, Kelebek H, Selli S. 2022. Elucidation of key aroma enhancement in cloudy lemon juices by the addition of peel oil using GC–MS-Olfactometry. International Journal of Food Science & Technology 57(8):5280−88

    doi: 10.1111/ijfs.15857

    CrossRef   Google Scholar

    [36]

    Abbas F, Zhou Y, O'Neill Rothenberg D, Alam I, Ke Y, et al. 2023. Aroma components in horticultural crops: chemical diversity and usage of metabolic engineering for industrial applications. Plants 12(9):1748

    doi: 10.3390/plants12091748

    CrossRef   Google Scholar

    [37]

    Farré-Armengol G, Filella I, Llusià J, Peñuelas J. 2017. β-Ocimene, a key floral and foliar volatile involved in multiple interactions between plants and other organisms. Molecules 22(7):1148

    doi: 10.3390/molecules22071148

    CrossRef   Google Scholar

    [38]

    Niu TF, Xue X, Guo LL, Yu M, Zhang CJ, et al. 2023. Effects of exogenous methyl jasmonate on volatile components and content of Paeonia suffruticosa 'Luoyanghong' in greenhouse. Scientia Silvae Sinicae 59(5):53−60

    doi: 10.11707/j.1001-7488.LYKX20210977

    CrossRef   Google Scholar

    [39]

    Saad AM, Mohamed AS, Ramadan MF. 2021. Storage and heat processing affect flavors of cucumber juice enriched with plant extracts. International Journal of Vegetable Science 27(3):277−87

    doi: 10.1080/19315260.2020.1779895

    CrossRef   Google Scholar

    [40]

    Wang T, Xie A, Zhang D, Liu Z, Li X, et al. 2021. Analysis of the volatile components in flowers of Paeonia lactiflora Pall. var. Trichocarpa. American Journal of Plant Sciences 12(01):146−62

    doi: 10.4236/ajps.2021.121009

    CrossRef   Google Scholar

    [41]

    Hosseini H, Zahedi B, Jowkar A, Kermani MJ, Karami A. 2021. Investigation of floral scent and essential oil of Rosa iberica petals. Journal of Ornamental Plants 11(2):89−97

    Google Scholar

    [42]

    Zhao G, Ding LL, Hadiatullah H, Li S, Wang X, et al. 2020. Characterization of the typical fragrant compounds in traditional Chinese-type soy sauce. Food Chemistry 312:126054

    doi: 10.1016/j.foodchem.2019.126054

    CrossRef   Google Scholar

    [43]

    Chinyere I, Julius IU. 2020. Determination of aroma components in Vitex doniana fruit syrup following hydrodistillation extraction. Journal of American Science 16(9):84−93

    doi: 10.7537/marsjas160920.07

    CrossRef   Google Scholar

    [44]

    Wang X, Xiong H, Wang S, Zhang Y, Song Z, et al. 2023. Physicochemical analysis, sensorial evaluation, astringent component identification and aroma-active compounds of herbaceous peony (Paeonia lactiflora Pall.) black tea. Industrial Crops and Products 193:116159

    doi: 10.1016/j.indcrop.2022.116159

    CrossRef   Google Scholar

    [45]

    Xiao Y, Huang Y, Chen Y, Xiao L, Zhang X, et al. 2022. Discrimination and characterization of the volatile profiles of five Fu brick teas from different manufacturing regions by using HS–SPME/GC–MS and HS–GC–IMS. Current Research in Food Science 5:1788−807

    doi: 10.1016/j.crfs.2022.09.024

    CrossRef   Google Scholar

    [46]

    Orodu VE. 2021. Migration and degradation by volatile compounds from scent leaf (Ocimum gratissimum) on polyethylene terephthalate packaged water. Chemistry and Physics of Polymers 1(1):1−11

    Google Scholar

    [47]

    Hoepflinger MC, Barman M, Dötterl S, Tenhaken R. 2024. A novel O-methyltransferase Cp4MP-OMT catalyses the final step in the biosynthesis of the volatile 1,4-dimethoxybenzene in pumpkin (Cucurbita pepo) flowers. BMC Plant Biology 24:294

    doi: 10.1186/s12870-024-04955-3

    CrossRef   Google Scholar

    [48]

    Zhang HX, Hu ZH, Leng PS, Wang WH, Xu F, et al. 2013. Qualitative and quantitative analysis of floral volatile components from different varieties of Lilium spp. Scientia Agricultura Sinica 46:790−99

    doi: 10.3864/j.issn.0578-1752.2013.04.013

    CrossRef   Google Scholar

    [49]

    Luo X, Yuan M, Li B, Li C, Zhang Y, et al. 2020. Variation of floral volatiles and fragrance reveals the phylogenetic relationship among nine wild tree peony species. Flavour and Fragrance Journal 35(2):227−41

    doi: 10.1002/ffj.3558

    CrossRef   Google Scholar

    [50]

    Mostafa S, Wang Y, Zeng W, Jin B. 2022. Floral scents and fruit aromas: functions, compositions, biosynthesis, and regulation. Frontiers in Plant Science 13:860157

    doi: 10.3389/fpls.2022.860157

    CrossRef   Google Scholar

    [51]

    Zhao Q, Zhang M, Gu L, Yang Z, Li Y, et al. 2024. Transcriptome and volatile compounds analyses of floral development provide insight into floral scent formation in Paeonia lactiflora 'Wu Hua Long Yu'. Frontiers in Plant Science 15:1303156

    doi: 10.3389/fpls.2024.1303156

    CrossRef   Google Scholar

    [52]

    Ma H, Zhang C, Niu T, Chen M, Guo L, et al. 2023. Identification of floral volatile components and expression analysis of controlling gene in Paeonia ostii 'Fengdan' under different cultivation conditions. Plants 12(13):2453

    doi: 10.3390/plants12132453

    CrossRef   Google Scholar

    [53]

    Middleton R, Tunstad SA, Knapp A, Winters S, McCallum S, et al. 2024. Self-assembled, disordered structural color from fruit wax bloom. Science Advances 10(6):eadk4219

    doi: 10.1126/sciadv.adk4219

    CrossRef   Google Scholar

    [54]

    Su X. 2010. Alcohols compound: the basic material of aromatic chemicals. Value Engineering 29(3):39

    doi: 10.14018/j.cnki.cn13-1085/n.2010.03.102

    CrossRef   Google Scholar

    [55]

    Englezos V, Torchio F, Cravero F, Marengo F, Giacosa S, et al. 2016. Aroma profile and composition of Barbera wines obtained by mixed fermentations of Starmerella bacillaris (synonym Candida zemplinina) and Saccharomyces cerevisiae. LWT 73:567−75

    doi: 10.1016/j.lwt.2016.06.063

    CrossRef   Google Scholar

    [56]

    Wang W, Ge J, Zhang Y, Zhang J. 2024. The male's scent triggered a neural response in females despite ambiguous behavioral response in Asian house rats. Integrative Zoology 19(4):694−709

    doi: 10.1111/1749-4877.12768

    CrossRef   Google Scholar

    [57]

    Song C, Ma H, Li R, Zhao G, Niu T, et al. 2024. Analysis of the emitted pattern of floral volatiles and cloning and functional analysis of the PsuLIS gene in tree peony cultivar 'High Noon'. Scientia Horticulturae 326:112750

    doi: 10.1016/j.scienta.2023.112750

    CrossRef   Google Scholar

  • Cite this article

    Wang A, Luo Y, Niu T, Gao K, Wang S, et al. 2024. Identification and content analysis of volatile components in 100 cultivars of Chinese herbaceous peony. Ornamental Plant Research 4: e032 doi: 10.48130/opr-0024-0029
    Wang A, Luo Y, Niu T, Gao K, Wang S, et al. 2024. Identification and content analysis of volatile components in 100 cultivars of Chinese herbaceous peony. Ornamental Plant Research 4: e032 doi: 10.48130/opr-0024-0029

Figures(5)  /  Tables(4)

Article Metrics

Article views(1146) PDF downloads(266)

ARTICLE   Open Access    

Identification and content analysis of volatile components in 100 cultivars of Chinese herbaceous peony

Ornamental Plant Research  4 Article number: e032  (2024)  |  Cite this article

Abstract: Herbaceous peony (Paeonia lactiflora Pall.) is a well-known and traditional flower in China, occupying a significant position in Chinese traditional culture. The floral scent of the herbaceous peony however remains relatively understudied. The objective of this study was to investigate the floral composition of herbaceous peony by collecting and identifying floral volatiles from 100 cultivars, including P. lactiflora 'Hangbaishao', P. lactiflora 'Hongrongqiu', P. lactiflora 'Biandihong', P. lactiflora 'Zijin Daipao', P. lactiflora 'Zixia Yingxue', and P. lactiflora 'Fenchi Dicui'. The volatile compounds were collected using the dynamic headspace technique and identified through gas chromatography-mass spectrometry (GC-MS). The results demonstrated qualitative and quantitative variations in the floral fragrances emitted by the 100 cultivars, with a total of 16 volatiles belonging to six categories (six alkanes, three alcohols and esters, two terpenes, as well as one each of ether and phenol) being identified. However, it is notable that not all volatile categories were emitted by every cultivar. Moreover, while some compounds were present in all 100 herbaceous peony cultivars, others were exclusive to specific cultivars. The screening revealed that ten of the 16 identified flower volatile compounds exhibited unique floral components. It is noteworthy that benzene,1,4-dimethoxy-, was identified as the most prominent compound in several cultivars, including P. lactiflora 'Taohua Huancai', P. lactiflora 'Xishifen', P. lactiflora 'Dabanhong', P. lactiflora 'Fumantang', and P. lactiflora 'Zhushapan'. Furthermore, the clustering classification results demonstrated that benzene,1,4-dimethoxy-, exhibited the highest variable importance in projection (VIP) value of 3.153, as determined by partial least squares discriminant analysis (PLS-DA).

    • The herbaceous peony, a well-known traditional flower in China[1], is characterized by its large and aesthetically pleasing flowers. The herbaceous peony is a member of the family Paeoniaceae[2], displaying notable adaptability, and significant ornamental value[3]. Studies on aromatic ornamental plants involve an examination of aromatic components, and genetic mechanisms[4], including Rosa rugosa Thunb.[5], Lilium brownii var. viridulum Baker[6], and Paeonia suffruticosa Andr.[7], Pyrus communis L.[8], Dendrobium officinale [9], Nymphaea tetragona[10], Rhododendron simsii[11], Jasminum sambac[12], studies were conducted on Chrysanthemum morifolium[13], Osmanthus fragrans[14], Camellia japonica[15], Malus[16], and Iris tectorum Maxim.[17] Historically, research has focused on factors such as flower shape, color, blooming season, and resilience, with less attention given to the floral scent[18].

      The floral scent has been identified as a significant ornamental attribute of herbaceous peony[3,19], and is also a prominent feature in numerous plant species[20]. It is frequently described as the 'essence of flowers'[21] and is derived from a range of volatile compounds that are synthesized within the plant and subsequently released into the atmosphere[22]. To date, over 1,700 volatile compounds have been identified in a variety of plants, with a multitude of applications in the manufacture of perfumes, cosmetics, culinary seasonings, and pharmaceuticals[23,24]. The composition and concentration of these volatile compounds exhibit considerable variation across different species, genus, and cultivars. Nevertheless, there is a paucity of research dedicated to the analysis of fragrance constituents and their respective concentrations in herbaceous peony and tree peony[25]. Song et al.[4] identified a total of 130 volatile compounds across 30 cultivars of herbaceous peony, encompassing 72 aromatic constituents. The 24 cultivars exhibiting heightened fragrance were categorized into five distinct aroma profiles: woody scent, fruity scent, lily scent, rose scent, and an orange blossom scent. Zhao et al.[26] conducted a study in which 68 volatile compounds and 26 significant aroma constituents were identified from a sample of 87 herbaceous peony cultivars. The researchers determined that herbaceous peony contain characteristic aromatic substances, including linalool (resembling lily of the valley), geraniol (exhibiting a pleasant geranium-like scent), citronellol (evoking a fresh and light rose and leaf fragrance), and phenylethyl alcohol (noted for its distinctive rose aroma), based on the content and odor threshold of these main aroma components. In a separate study, Li et al.[27] identified 128 volatile compounds from 24 tree peony cultivars, with the predominant classes being terpenes, alcohols, and esters. The distribution pattern of these primary fragrance constituents led to the categorization of 24 tree peony cultivars into four types: grass scent (ocimene), woody scent (longifolene), lily of the valley scent (linalool), and fruity scent (2-ethyl hexanol). It has been demonstrated that the distinctive fragrances of different plant species are the result of the presence of specific volatile compounds in varying quantities and ratios. Furthermore, the quantity of fragrance emitted by flowers is contingent upon their developmental stage[28].

      Floral substances derived from plants are classified as secondary metabolites, which are released by flowering plants and predominantly comprise a range of volatile compounds characterized by relatively low molecular weights. In a comprehensive analysis of the aromatic compounds present in P. rockii and P. ostii 'Fengdan', Wu et al.[29] employed two-dimensional gas chromatography coupled with time-of-flight mass spectrometry (GC × GC-TOF/MS). The results indicated that the aroma profile of P. rockii was primarily characterized by the presence of alcohols, alkanes, and acids, while the aroma profile of P. ostii 'Fengdan' was predominantly defined by aldehydes, alcohols, and terpenes. In a separate investigation, Li et al.[30] sought to identify and analyze the volatile compounds present in the flowers of seven pear cultivars (Anli, Bayuesu, Golden, Brown Peel, KorlaXiangli, Lyubaoshi, and Xizilü). The findings indicated that certain aldehydes constitute significant characteristics of these cultivars and are recognized as essential active odorants, which emit pronounced citrus and floral fragrances. Yang et al.[31] successfully identified and characterized 34 volatile compounds in the Dendrobium officinale flowers. Of these, 18 compounds were identified as principal odorants, including 1-octen-3-ol, hexanal, nonanal, phenylacetaldehyde, linalool, 4-oxoisophorone, theaspirane, and methyl salicylate. Furthermore, Kimani et al.[32] identified geraniol, β-caryophyllene, 2-phenylethanol, citronellol, and 1,8-cineole as the primary aromatic constituents in 24 cultivars of herbaceous peony, including P. lactiflora 'LianTai' and P. lactiflora 'Hongyan Feishuang'. Aromatic compounds are recognized as the primary chemical constituents of aromatic plants, playing a crucial role in the synthesis of secondary metabolites[33], and fragrance development. These compounds exhibit a diverse range of forms. For example, phenethyl alcohol is found in rose, mint contains menthol, and lemon includes citric acid[22,34,35].

      This study employed a combination of dynamic headspace sampling technology[36] and GC-MS to analyze the volatile components and concentrations in 100 international herbaceous peony cultivars during the half-opening stage. The objective was to elucidate the aromatic profile of the herbaceous peony. The findings of this study establish a fundamental framework for further investigation and exploitation of the fragrances of herbaceous peony flowers and provide a valuable resource for enhancing the economic value of herbaceous peony.

    • The experimental materials used in this study were obtained from the Luoyang Academy of Agriculture and Forestry Sciences (Luoyang City, Henan Province, China) between 20 April and 8 May 2022. The majority of the materials were collected between 10 and 12 am. The subjects of the experiment were herbaceous peony plants sourced from the herbaceous peony resource garden affiliated with the Henan University of Science and Technology. As outlined in Table 1 and Fig. 1, herbaceous peony cultivars demonstrating consistent growth patterns and flowering stages were identified, and the methodology entailed the repetition of each sample on three occasions.

      Table 1.  Names and numbers of 100 herbaceous peony cultivars.

      100 herbaceous peony cultivars
      'Hangbaishao' 'Hongrongqiu' 'Biandihong' 'Zijin Daipao' 'Zixia Yingxue' 'Fenchi Dicui' 'Xishifen' 'Yinlong Hanzhu' 'Yinxian Xiuhongpao' 'Jindaiwei'
      'Luhong' 'Xueyuan Hongxing' 'Mozijin' 'Yahong' 'Wulong Tanhai' 'Hongyan Zhengshuang' 'Xingguang Chanlan' 'Yanlihong' 'Hongling Chijin' 'Fenzhuangyuan'
      'Taohua Huancai' 'Zhongshenghong' 'Ziling' 'Luxihong' 'Zifurong' 'Hongling Chijin' 'Huguang Shise' 'Hongyuqiu' 'Yanzhi Dianyu' 'Lantian Piaoxiang'
      'Zhushapan' 'Hongyun Yingri' 'Yanzi Xiangyang' 'Yanzhihong' 'Zaoyuanhong' 'ChilongCaifeng' 'Chaoshihong' 'Qingwen' 'Shaifugui' 'Ziyanshuang'
      'Gaoganfen' 'Qundiehui' 'Meirenmian' 'Meiju' 'Dafugui' 'Zhifeng Zhaoyang' 'Xueyuan Hongxing' 'Dahongpao' 'Zixiuqiu' 'Canglong'
      'Gaoganhong' 'Hongyan Feishuang' 'Dabanhong' 'Zifengyu' 'Hongpan Jinqiu' 'Hushui Dangxia' 'Yinlong Huihai' 'Baihuazi' 'Taohuafen' 'Wawamian'
      'Fenpanjinxing' 'Heixiuqiu' 'Shuanghonglou' 'Changshouhong' 'Hongyan Lushuang' 'Tuopan Jinhua' 'Hongling Chijin' 'Linglongyu' 'Jinzan Ciyu' 'Xiangyang Qihua'
      'Jinbian Hongge' 'Duoyezi' 'Fenzilou' 'Furong Jinhua' 'Fenkui' 'Guifei Chacui' 'Huolian Jingang' 'Hongguanfang' 'Fenmian Taohua' 'Taoranzui'
      'Zhaoyanghong' 'Hongfengyu' 'Fumantang' 'Shaonvfen' 'Danfeng' 'Liantaizi' 'Meiguihong' 'Fenfurong' 'Fenling Hongzhu' 'Fenqiu'
      'Fencuiqiu' 'FengChao Chuyu' 'Lanju' 'Jinsanhong' 'Zhaoyuanfen' 'Hongfeng' 'Qiaoling' 'Tuanye Jinqiu' 'Guohong' 'Tongquechun'
      The numbers 1−100 are listed from top to bottom, left to right respectively.
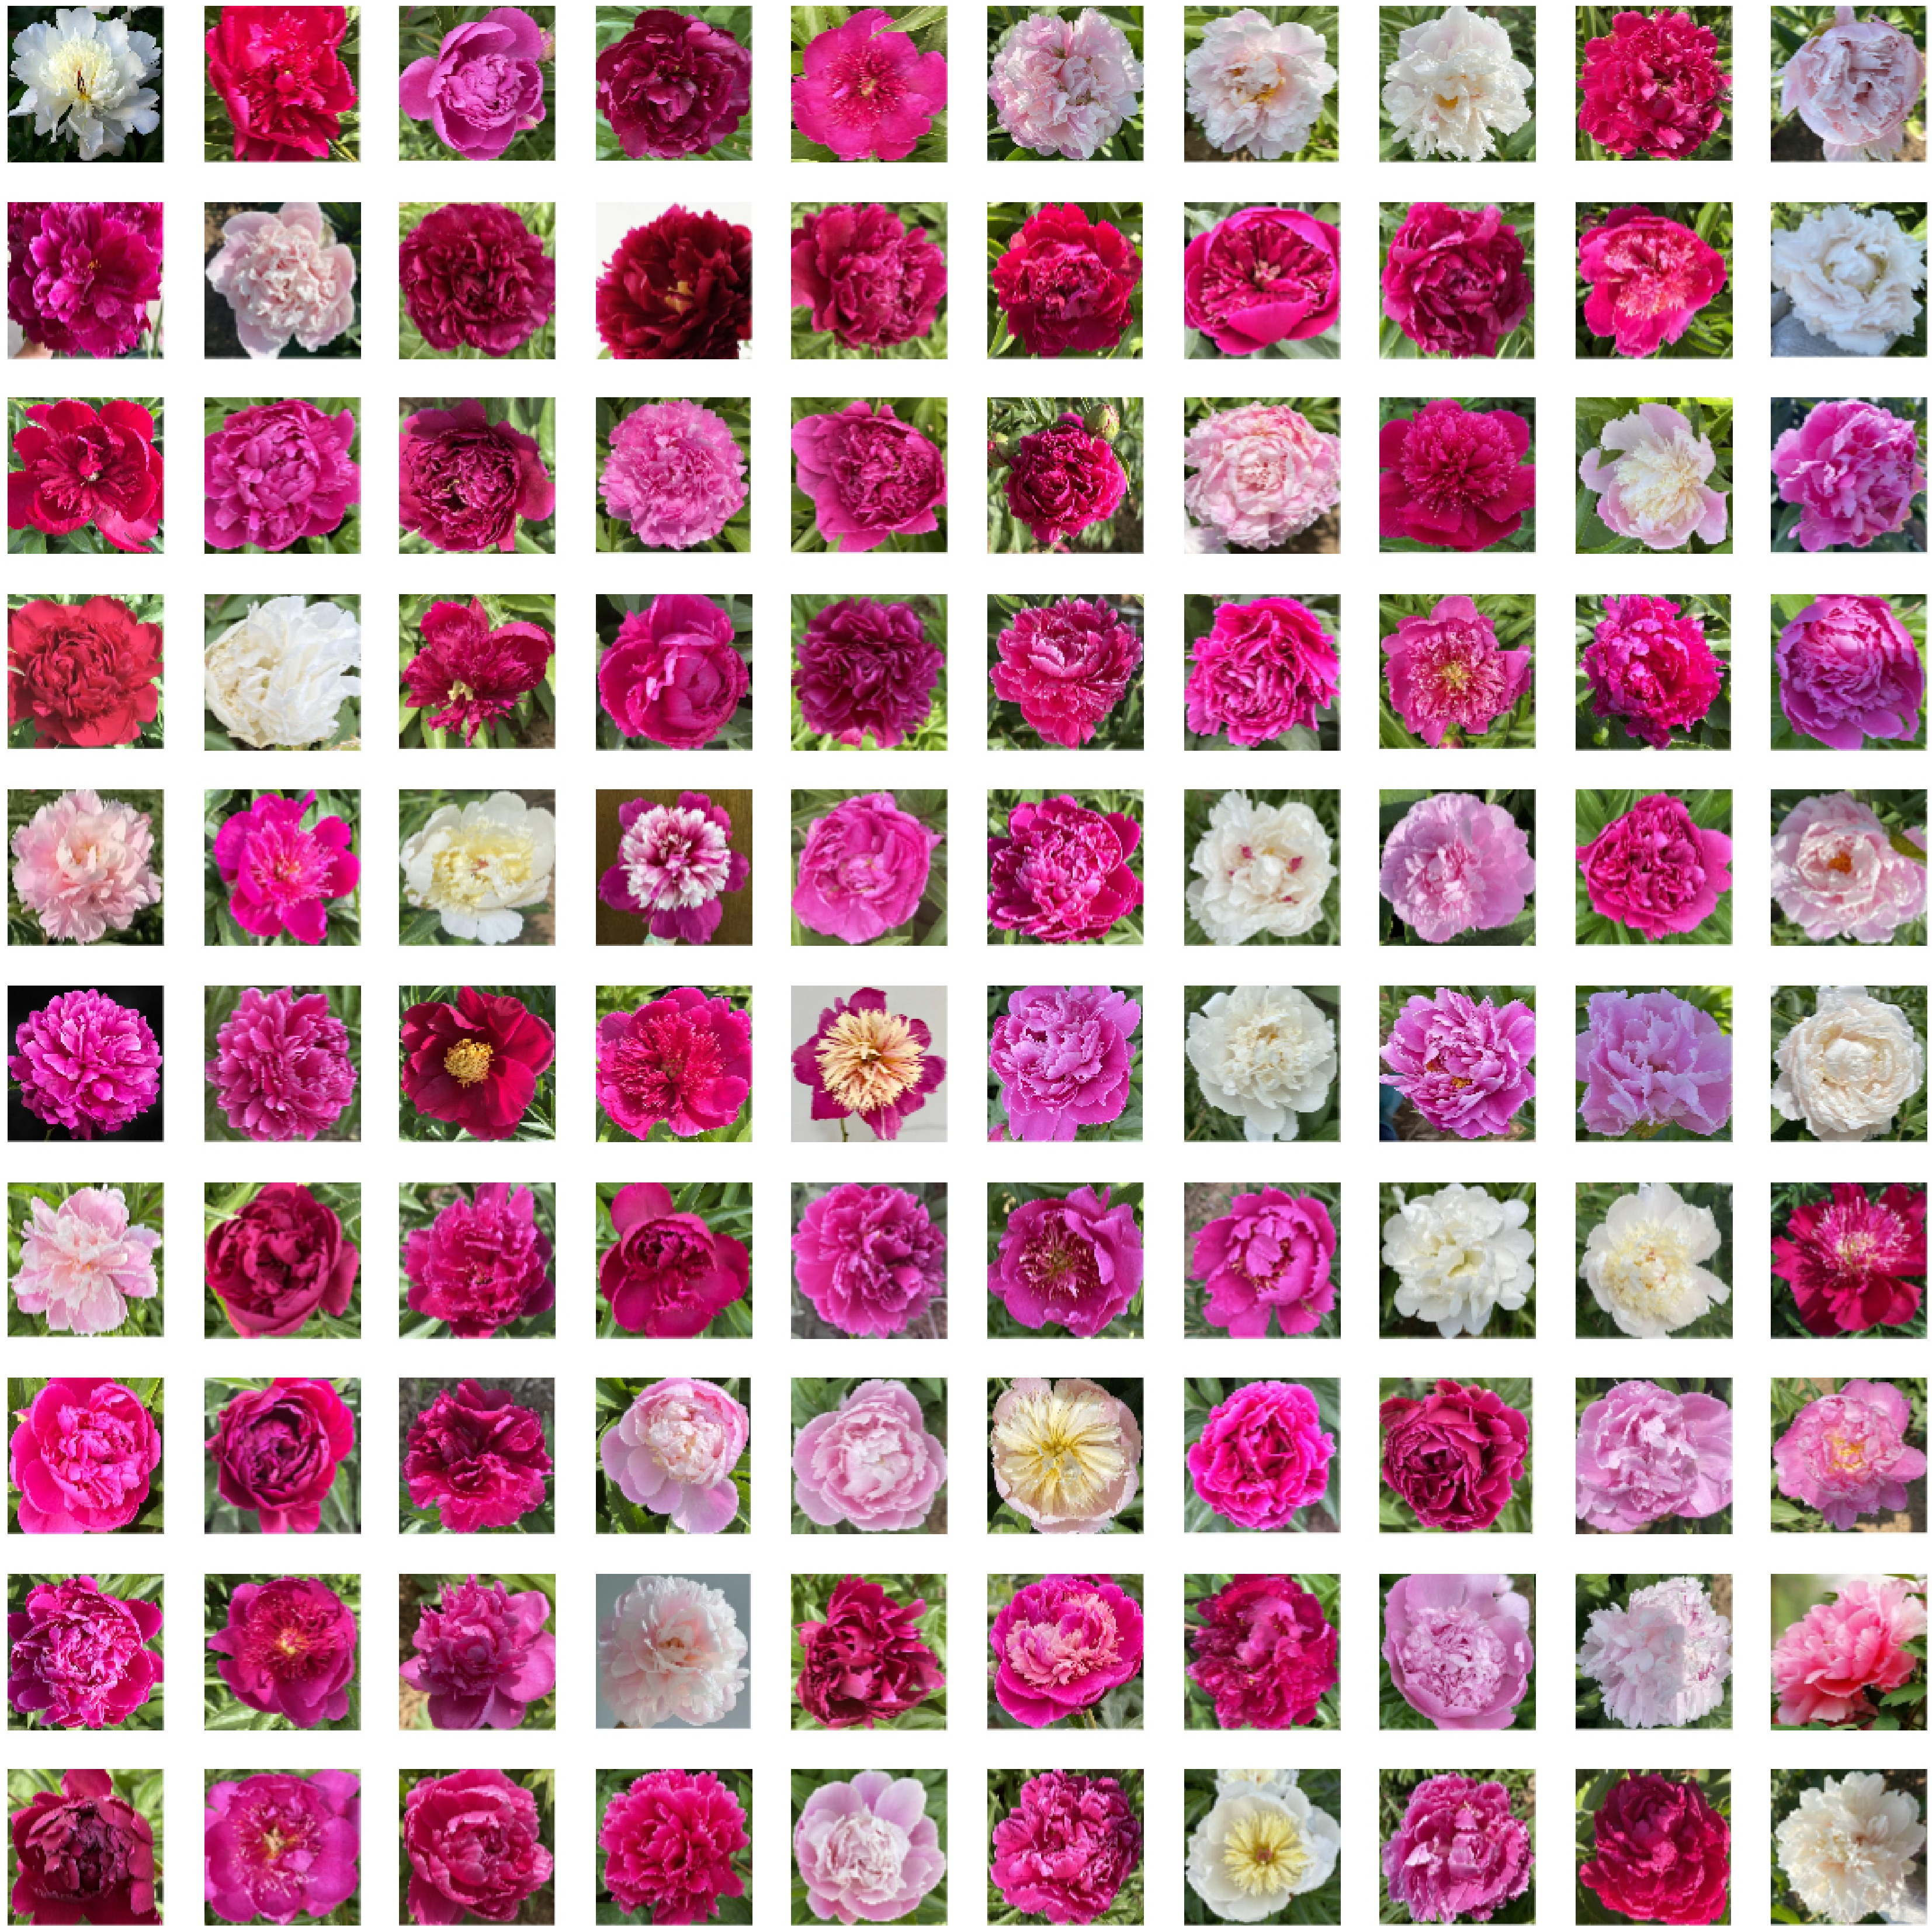
      Figure 1. 

      Morphological characteristics of 100 herbaceous peony cultivars at the half-opening stage. The order of the above pictures is relative to the order of cultivars in Table 1.

    • The Gas Chromatography-Mass Spectrometry System (GC8890-MS5977B) from Agilent Technologies, USA, and the Atmospheric Sampler QC-1S from the Beijing Institute of Labor Protection were utilized in the study.

    • The reagents used included Tenax TA as the adsorbent, ethyl caprate, dichloromethane, pentane, n-hexane of chromatography grade, ethyl decanoate, ethyl acetate, and a standard solution of n-alkane mixture (ranging from C8 to C40) obtained from Sigma-Aldrich, USA.

    • The dynamic headspace adsorption technique employed in this study was a sampling bag (355 mm × 508 mm, Reynolds, USA) hermetically sealed at one end with an activated carbon filter tube. The bag was meticulously wrapped around a live peony flower to minimize contact and prevent damage to the bag. The bag's opposite end was connected to a Tenax TA adsorption tube (6 mm outer diameter, 100 mm length, filled with adsorbent) and an atmospheric sampler via tasteless silicone tubing. The flow rate of the atmospheric sampler was set at 400 mL·min−1 and the sampling duration was 3 h. Following the sampling period, the adsorption tube was sealed with cling film and aluminum foil, then placed in a self-sealing bag and stored in an ultra-low temperature cooler for transport to the laboratory. The sample was then eluted with n-hexane during sample processing, and the eluate was transferred to a brown sample bottle for subsequent analysis.

      The following conditions were observed in the gas chromatography (GC) analysis: the chromatographic column employed is a flexible quartz capillary column, with a length of 30 mm, an internal diameter of 0.25 mm, and a pore size of 0.25 μm. The flow rate of the column is set at 1.2 mL·min−1. The temperature of the column is maintained according to a specific protocol. It is initially set at 70 °C and held for 1 min, then increased to 136 °C at a rate of 6 °C·min−1, followed by further increases to 138 °C at a rate of 1 °C·min−1, then to 142 °C at a rate of 2 °C·min−1, and finally to 143 °C at a rate of 0.5 °C∙min−1. The temperature is increased by 5 °C·min−1 and subsequently to 160 °C at a rate of 2 °C·min−1, before reaching 250 °C at a rate of 10 °C·min−1. The injector temperature is set at 250 °C, with a carrier gas of high-purity helium at a flow rate of 1 mL·min−1. The injection mode is a split injection, with a split ratio of 9:1, and the injection volume is 2 μL.

      The following conditions were employed for the mass spectrometry (MS) analysis: The electron impact (EI) source is operated at 70 eV, with the interface temperature set to 250 °C and the ion source temperature maintained at 230 °C. The quadrupole temperature is controlled at 150 °C, and the scan range is from 25 to 400 amu.

    • Before the analysis of the sample using gas chromatography, the 500 mg∙L−1 n-alkane mixed standard solution should be diluted with n-hexane at a ratio of 1:50, in accordance with the specified conditions for the chromatography. It is essential to record the retention time for each n-alkane and to compare the resulting Retention Index (RI) values with those documented in the literature to facilitate the identification of the compounds in question. The following formula is used to calculate the RI:

      RI=100×n+100×(txtn)/(tn+1tn)

      The location of the aforementioned item is as follows: The retention index (RI) represents the retention time of the volatile substances under examination. The number of carbon atoms in the straight-chain alkane preceding the analyte is represented by n. The retention time of the analyte is represented by tx. The retention time of the straight-chain alkane before the analyte is represented by tn. The retention time of the straight-chain alkane following the analyte is represented by tn+1. The retention time of the analyte falls between the retention times of tn and tn+1. Qualitative analysis of volatile components is conducted through consultation with the NIST 17 spectral library, with cross-referencing of RI values, literature sources, and other pertinent resources, including books.

    • An internal standard solution, comprising 69.32 mg∙L−1 of ethyl decanoate in ethyl acetate, is employed. A volume of 0.4 μL of the internal standard solution is added to each 80 μL sample. Subsequently, quantitative calculations are performed in accordance with the following formula:

      Contentofeacharomasubstance(μgg1)=PeakareaofeacharomasubstancePeakareaoftheinternalstandard×Concentrationoftheinternalstandard(mgL1)×Volumeoftheinternalstandard(μL)Volumeofthesample(g)×f

      where, f is the correction factor of each component to the internal standard, f = 1.

    • The analysis of variance can be conducted using the statistical software package SPSS, while graph plotting can be accomplished with the Origin 2022 software. The software Metaboanalyst and the Microbiome Analysis Platform are capable of performing data normalization, partial least squares discriminant analysis (PLS-DA), and cluster analysis.

    • An analysis was conducted to determine the main volatile compounds present in 100 herbaceous peony cultivars during the half-opening stage. This was achieved through the utilization of database retrieval and manual identification methods. The results are outlined in Table 2. A total of 16 volatile components were identified and classified into six distinct groups. The data revealed that alkanes constituted six types, representing 37.5% of the total volatile components. This was followed by four types of esters at 25%, three types of alcohols at 18.75%, and one type each of terpenes, ethers, and phenols, each accounting for 6.25% of the total volatile components. The results of this analysis indicate that the predominant categories of volatile compounds found in herbaceous peony cultivars are alkanes, esters, and alcohols.

      Table 2.  The volatile components of 100 herbaceous peony cultivars.

      Compound number RT (min) CAS number Compounds Compound classification Chemical formula Retention index
      Calculated value Reference value
      1 3.273 111-84-2 Nonane Alkanes C9H20 900 900
      2 4.805 124-18-5 Decane Alkanes C10H22 1,000 1,000
      3 5.727 13877-91-3 (Z)-β-ocimene Terpenes C10H16 1,038 1,037
      4 7.063 60-12-8 Phenylethyl alcohol Alcohols C8H10O 1,115 1,109
      5 8.133 150-78-7 Benzene,1,4-dimethoxy- Ethers C8H10O2 1,165 1,168
      6 9.502 106-22-9 Citronellol Alcohols C10H20O 1,228 1,228
      7 10.084 106-25-2 Nerol Alcohols C10H18O 1,220 1,219
      8 10.187 103-45-7 Methyl cinnamate Esters C10H12O2 1,260 1,258
      9 12.976 103-26-4 2-Propenoic acid,3-phenyl-,methyl ester Esters C10H10O2 1,389 1,380
      10 14.88 131-11-3 Dimethyl phthalate Esters C10H10O4 1,456 1,466
      11 16.174 629-62-9 Pentadecane Alkanes C15H32 1,500 1,500
      12 16.664 128-37-0 Butylated hydroxytoluene Phenols C15H24O 1,513 1,513
      13 19.877 544-76-3 Hexadecane Alkanes C16H34 1,600 1,601
      14 24.137 629-78-7 Heptadecane Alkanes C17H36 1,699 1,700
      15 31.517 84-74-2 Dibutyl phthalate Esters C16H22O4 1,964 1,907
      16 33.398 646-31-1 Tetracosane Alkanes C24H50 2,400 2,400
    • As illustrated in Fig. 2, alkane compounds were undetected in 30 cultivars, including P. lactiflora 'Hushui Dangxia', P. lactiflora 'Tuopan Jinhua', P. lactiflora 'Qiaoling', P. lactiflora 'Yinlong Hanzhu', and P. lactiflora 'Yanlihong'. Among the 100 herbaceous peony cultivars, the highest concentration of alkane compounds was observed in P. lactiflora 'Heizijin' (10.66 ± 2.01 μg·g−1), with the range of alkane compounds concentration spanning from 0.00 to 10.66 μg·g−1.
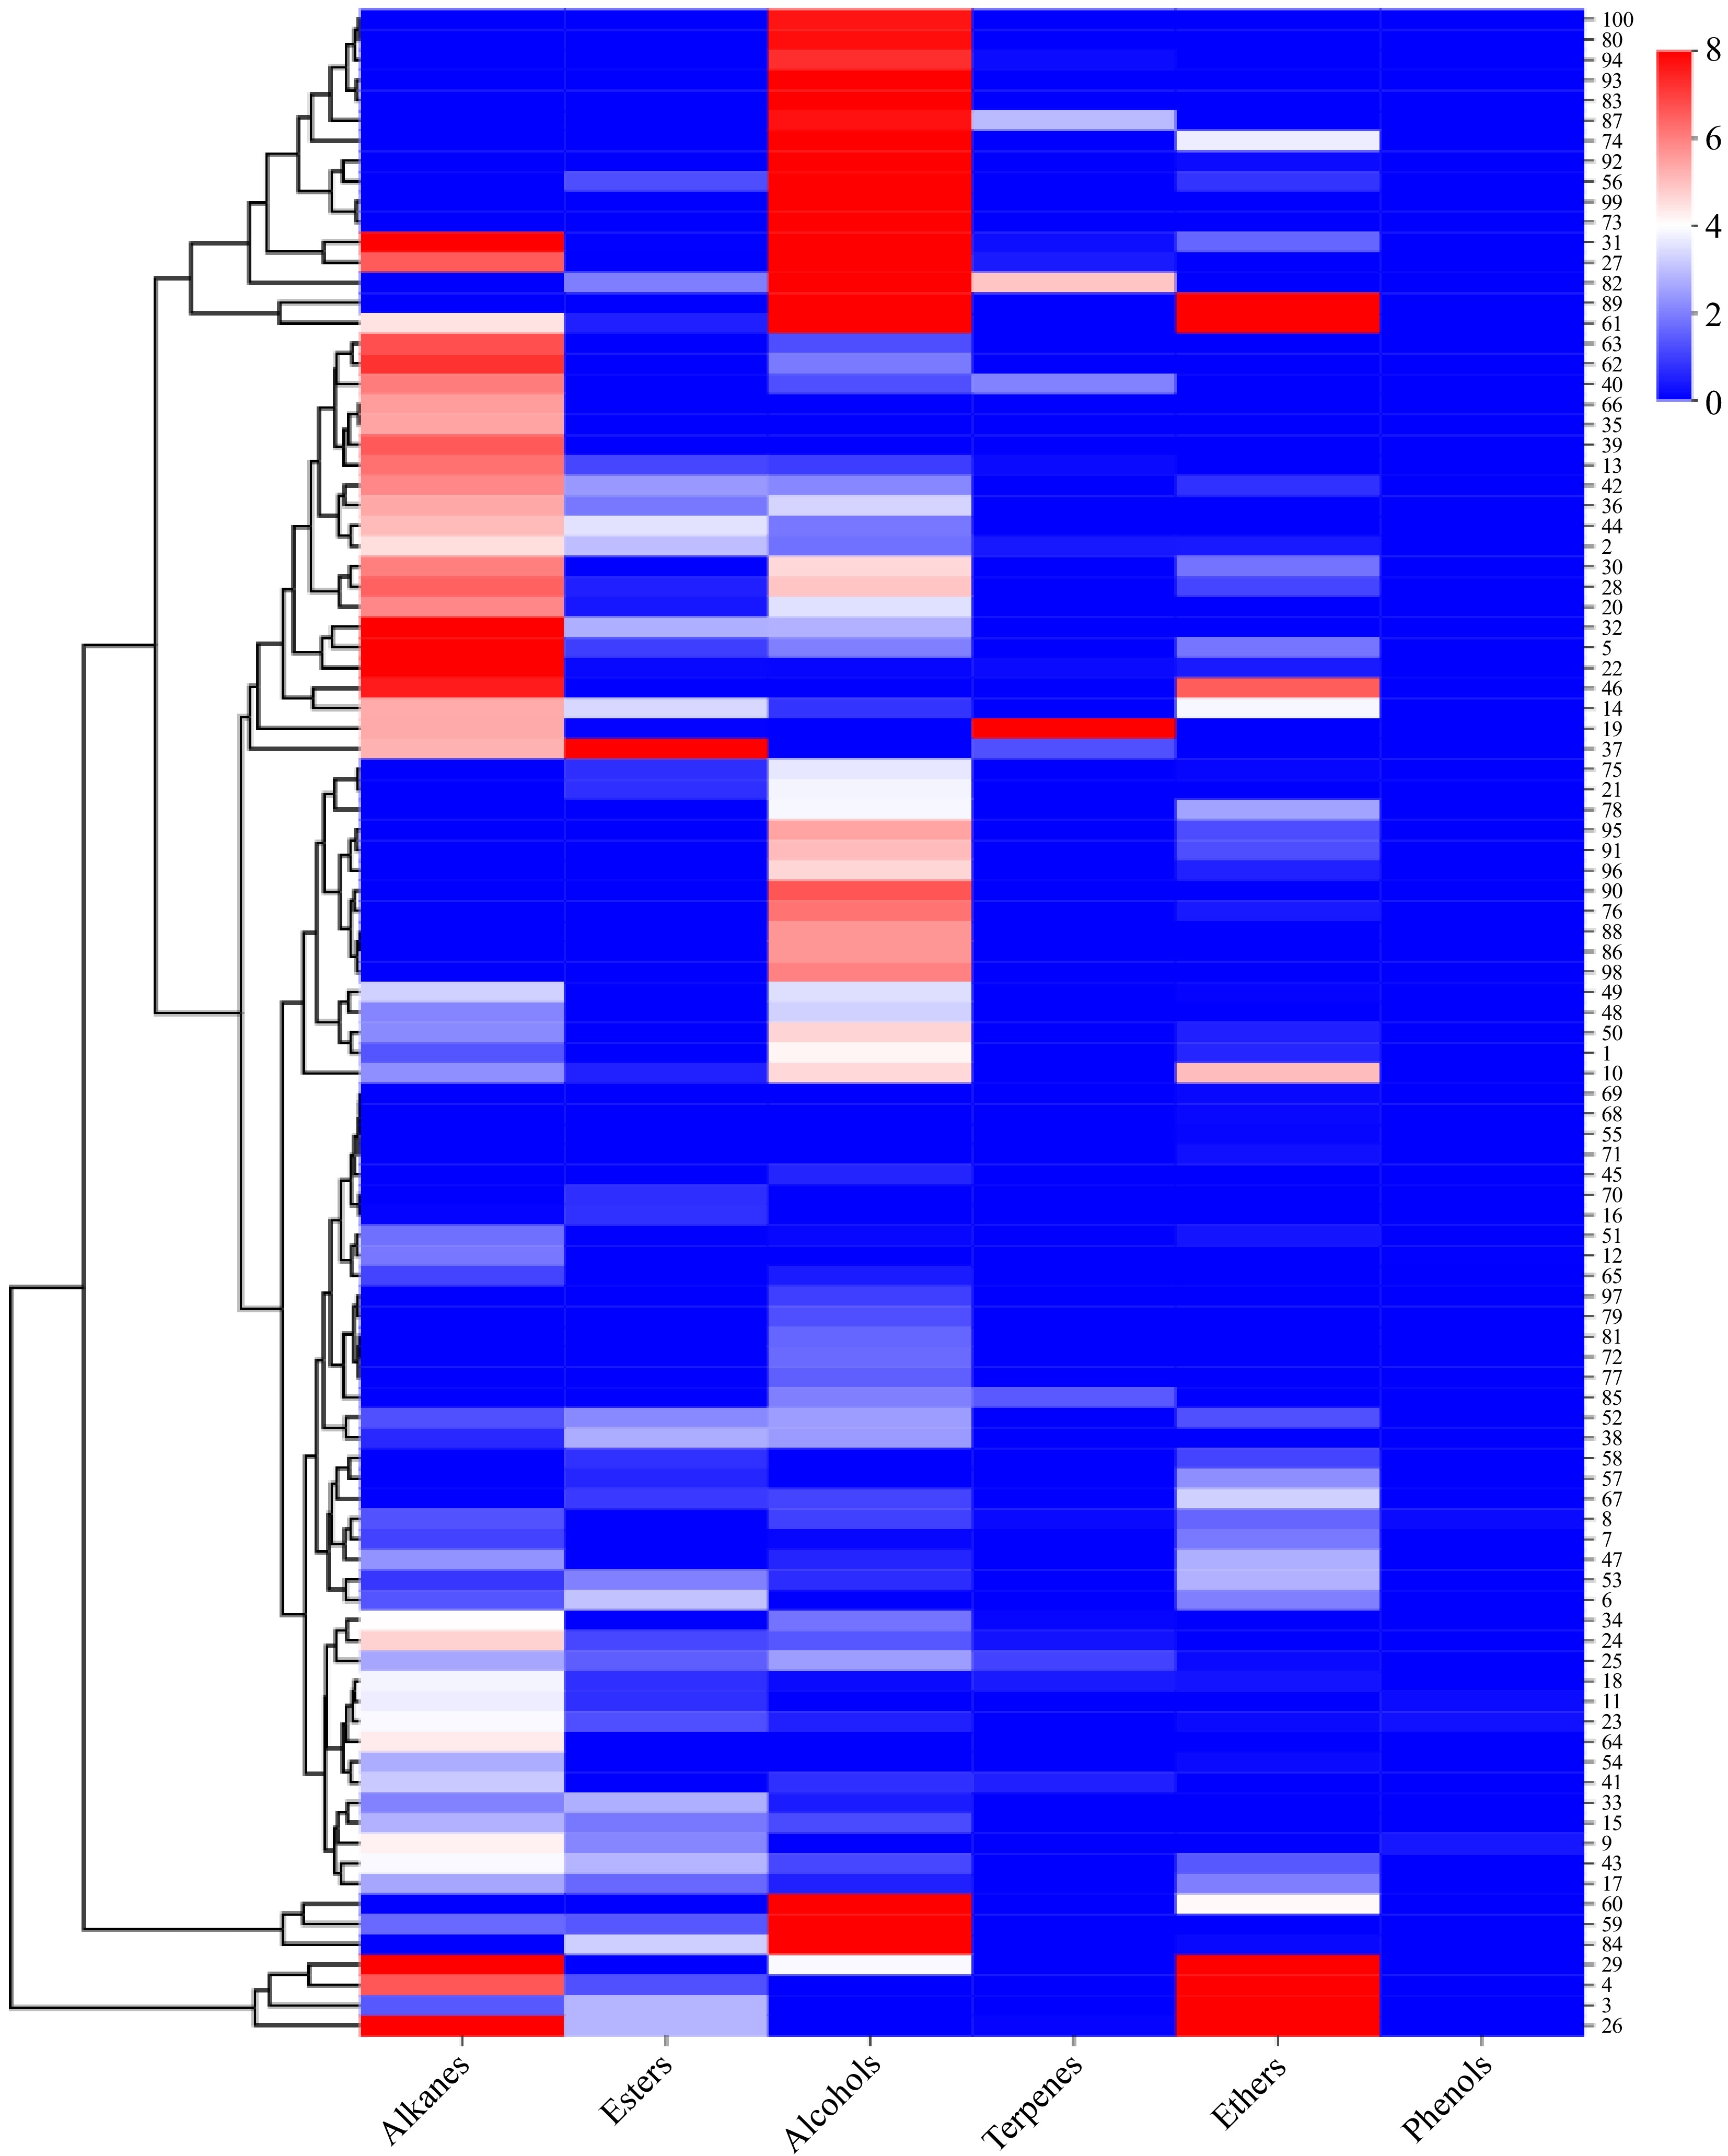
      Figure 2. 

      Comparative heat map depicting the release of six types of volatile compounds from various herbaceous peony cultivars.

    • As shown in Fig. 2, ester compounds were discernible in all 44 cultivars of herbaceous peony at the half-opening stage. However, the content of ester compounds was generally not notably high in most cultivars. The highest ester compounds content was observed in P. lactiflora 'Changshouhong' (9.15 ± 0.03 μg·g−1), followed by P. lactiflora 'Zaoyuanhong' (3.55 ± 0.40 μg·g−1), P. lactiflora 'Hongyun Yingri' (3.37 ± 0.11 μg·g−1), and P. lactiflora 'Saifugui' (3.25 ± 0.67 μg·g−1). The ester compounds content among these three cultivars was found to be similar, with a range of 0.00 to 9.15 μg·g−1.

    • As depicted in Fig. 2, the majority of the 100 cultivars of herbaceous peony at the half-opening stage exhibited the presence of alcohol compounds. Only 23 cultivars, including P. lactiflora 'Taohua Huancai', P. lactiflora 'Zhushapan', and P. lactiflora 'Gaoganhong' exhibited no detection. The highest alcohol compounds content was observed in P. lactiflora 'Hongfeng' (22.98 ± 3.86 μg·g−1), which was significantly higher than that of other herbaceous peony cultivars. Subsequently, P. lactiflora 'Wandai Shengse' (16.23 ± 2.28 μg·g−1) exhibited the second-highest alcohol compounds content, with a range of 0.00 to 22.98 μg·g−1.

    • As illustrated in Fig. 2, only 19 of the herbaceous peony cultivars exhibited detectable levels of terpene compounds, with significant differences in content (p < 0.05). The highest content was observed in P. lactiflora 'Hongfengyu' (8.19 ± 1.02 μg·g−1), followed by P. lactiflora 'Wandai Shengse' (4.93 ± 0.09 μg·g−1), P. lactiflora 'Jinzan Ciyu' (2.92 ± 1.75 μg·g−1), P. lactiflora 'Dabanhong' (0.07 ± 0.13 μg·g−1), P. lactiflora 'Jinbian Hongge' (0.14 ± 0.23 μg·g−1), and P. lactiflora 'Mozi Hanjin' (0.16 ± 0.28 μg·g−1), among others. The range of terpene compounds content was found to vary from 0.00 to 8.19 μg·g−1.

    • The analysis of 50 herbaceous peony cultivars revealed the presence of ether compounds in all samples, with notable variations in their content (p < 0.05). The highest content of ether compounds was observed in P. lactiflora 'Dabanhong' (22.84 ± 2.15 μg·g−1), followed by P. lactiflora 'Taohua Yingcai' (19.53 ± 2.44 μg·g−1). The lowest levels were observed in P. lactiflora 'Danfeng' (0.06 ± 0.11μg·g−1), P. lactiflora 'Ziling' (0.15 ± 0.26 μg·g−1), and P. lactiflora 'Huolian Jingang' (0.12 ± 0.21 μg·g−1). The range of ether compounds content was observed to vary from 0.00 to 22.84 μg·g−1.

    • The analysis revealed that only five herbaceous peony cultivars exhibited discernible levels of phenol compounds, namely P. lactiflora 'Jinbian Hongge' (0.15 ± 0.05 μg·g−1), P. lactiflora 'Zhaoyanghong' (0.34 ± 0.02 μg·g−1). The remaining cultivars exhibited lower levels of phenol compounds, with the lowest concentration observed in P. lactiflora 'Hongrongqiu' (0.17 ± 0.03 μg·g−1), followed by P. lactiflora 'Xueyuan Honghua' (0.01 ± 0.02 μg·g−1), and P. lactiflora 'Ziling' (0.27 ± 0.05 μg·g−1). The five cultivars exhibited notably lower levels of phenol compounds, with values consistently below 1 μg·g−1. The remaining cultivars were found to be devoid of phenol compounds.

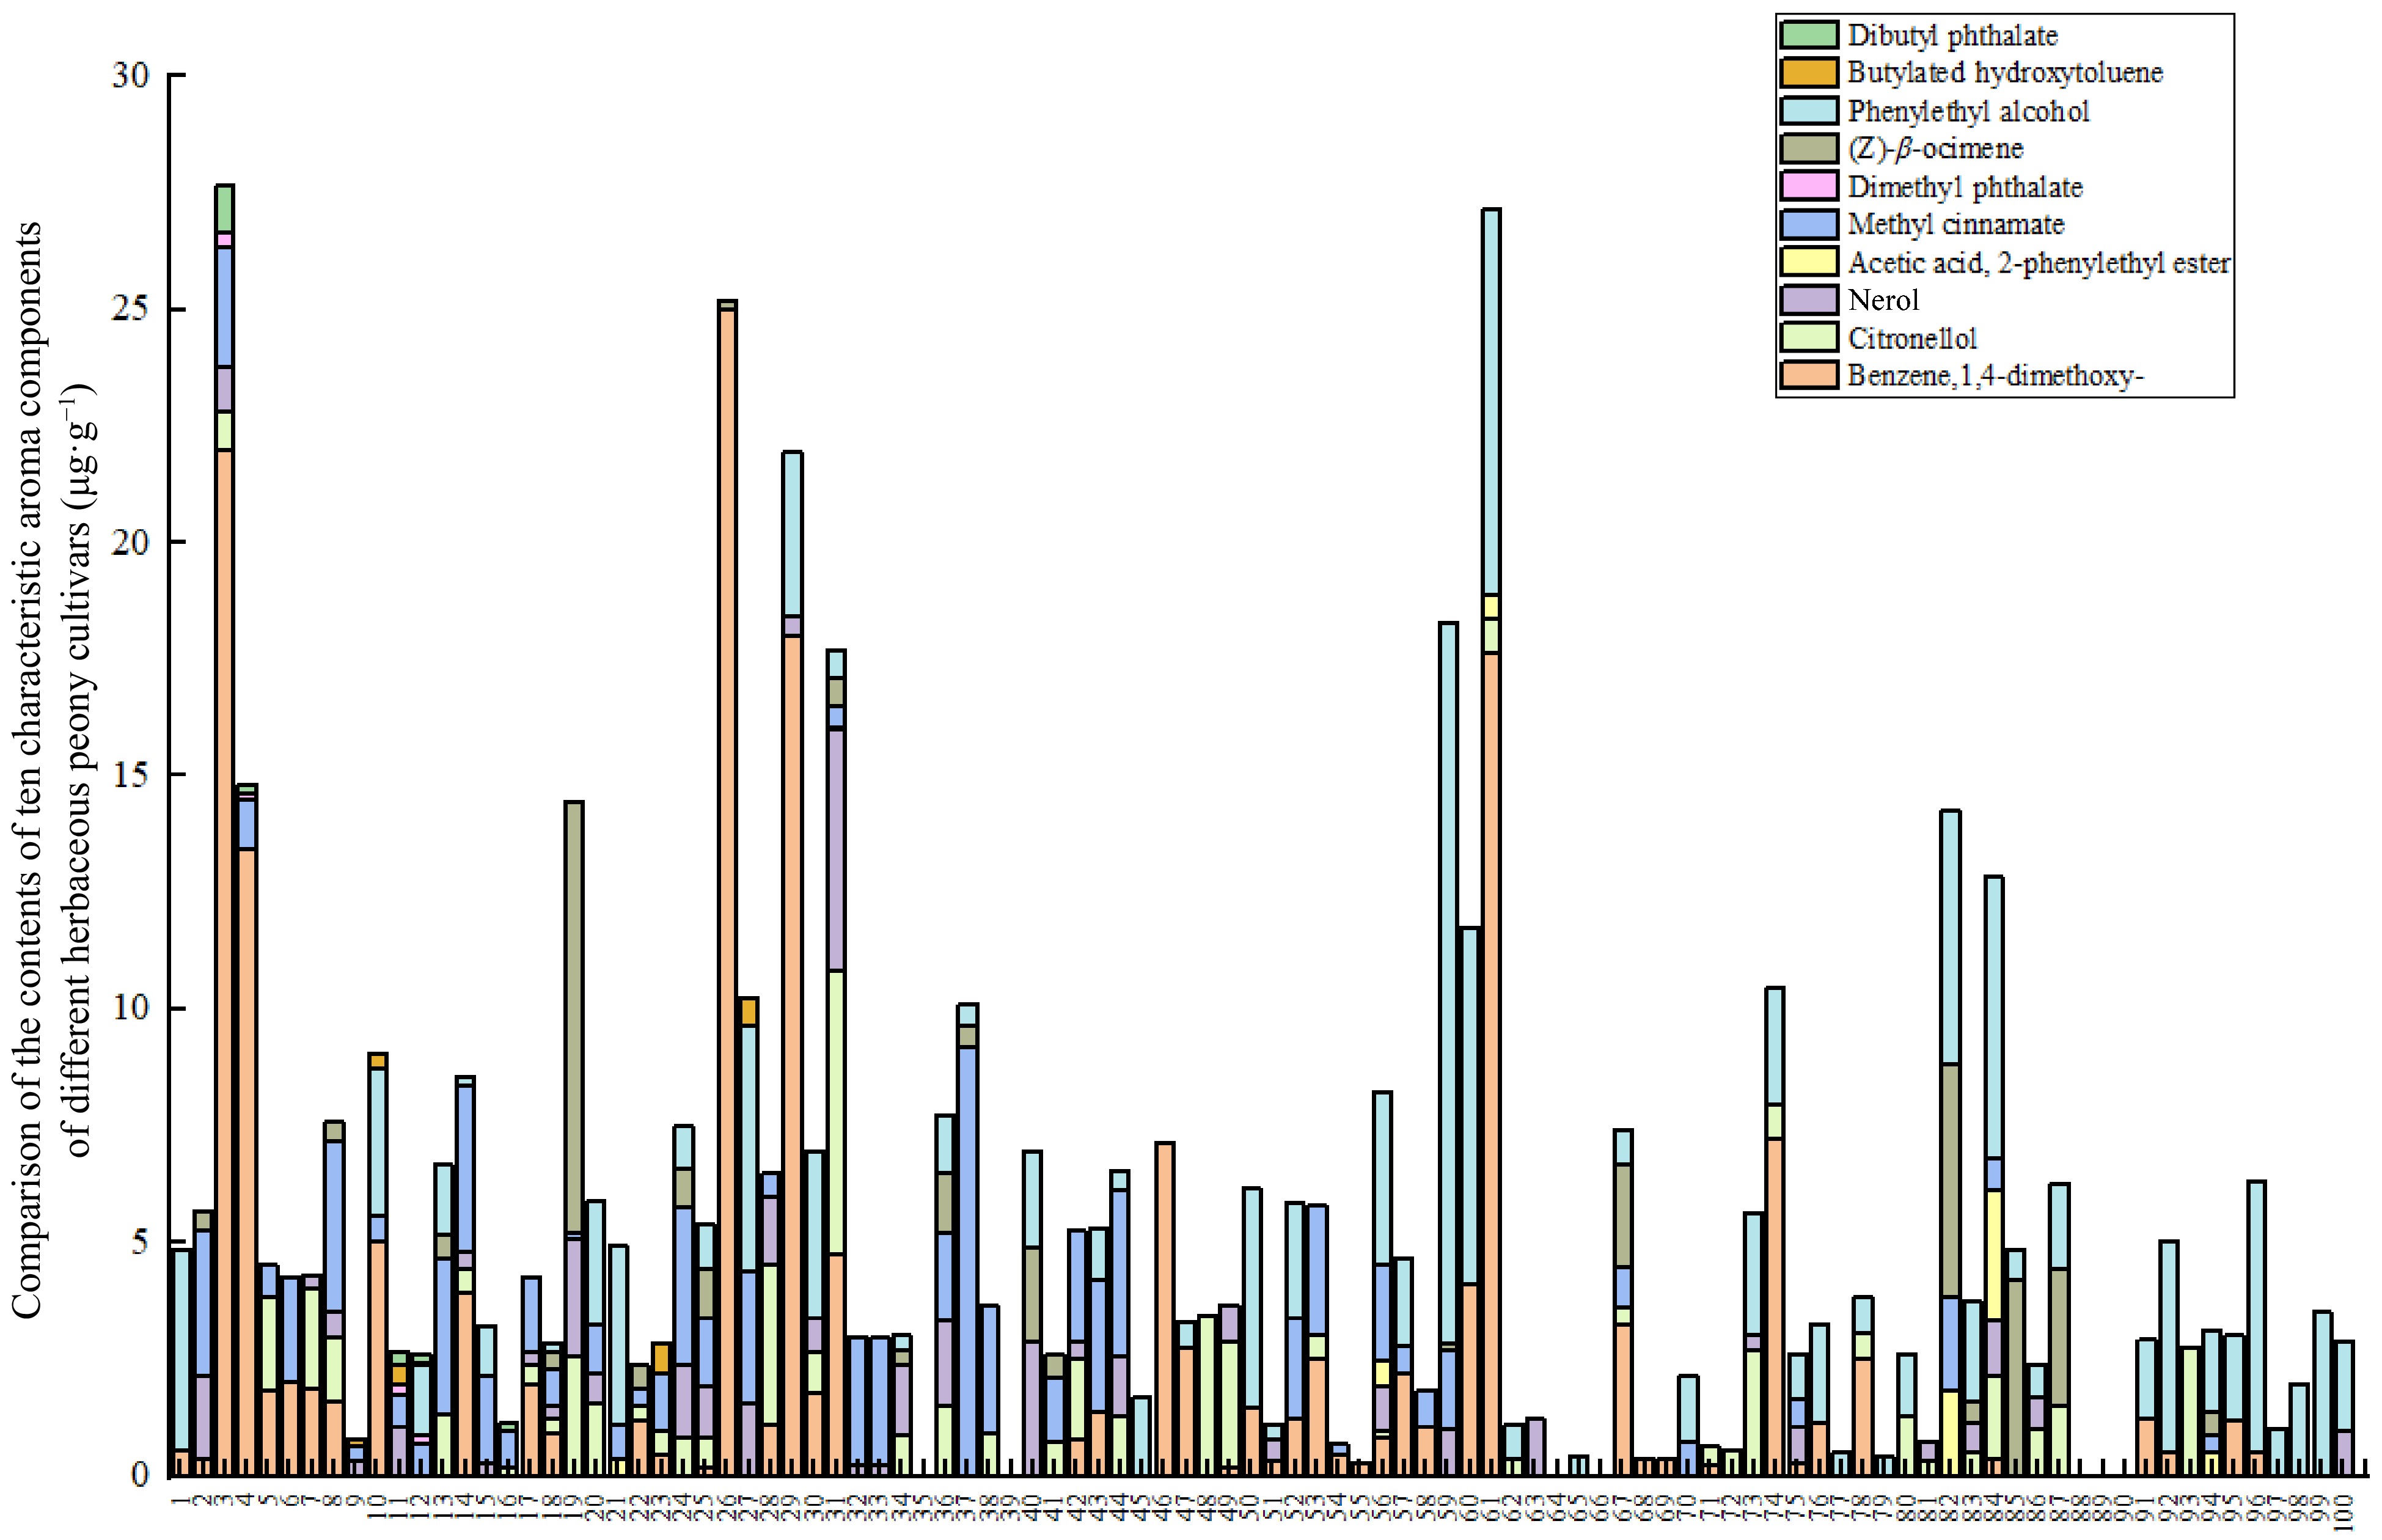
    • The analysis of the 16 volatile compounds detected revealed that, aside from alkanes such as nonane, the remaining 10 compounds from five classes all exhibited characteristic aromas, as detailed in Table 3. These aromatic compounds were present in the majority of samples, with concentrations exceeding 0.01 μg·g−1. Of particular note is the detection of benzene,1,4-dimethoxy-, in the majority of samples, with relatively high concentrations observed (Fig. 3).

      Table 3.  Characteristics of aroma compounds.

      No. Compound name Odor characteristics
      1 (Z)-β-ocimene The scent of grass and flowers is accompanied by the aroma of orange blossom oil[37]
      2 Phenylethyl alcohol Sweet rose-like fragrance[38]
      3 Benzene,1,4-dimethoxy- The fragrance of cloves[39]
      4 Citronellol Has a sweet rose aroma[40]
      5 Nerol There is a sweet rose fragrance[41]
      6 Acetic acid, 2-phenylethyl ester There is a reminiscent of honey-like floral fragrance[42]
      7 Methyl cinnamate Sweet smelling fragrance[43]
      8 Dimethyl phthalate The substance emits a delicate fragrance[44]
      9 Butylated hydroxytoluene The presence of a carbonic acid taste can
      influence the aroma of wine[45]
      10 Dibutyl phthalate The substance emits a delicate fragrance[46]

      Figure 3. 

      Content of characteristic aroma compounds in herbaceous peony cultivars.

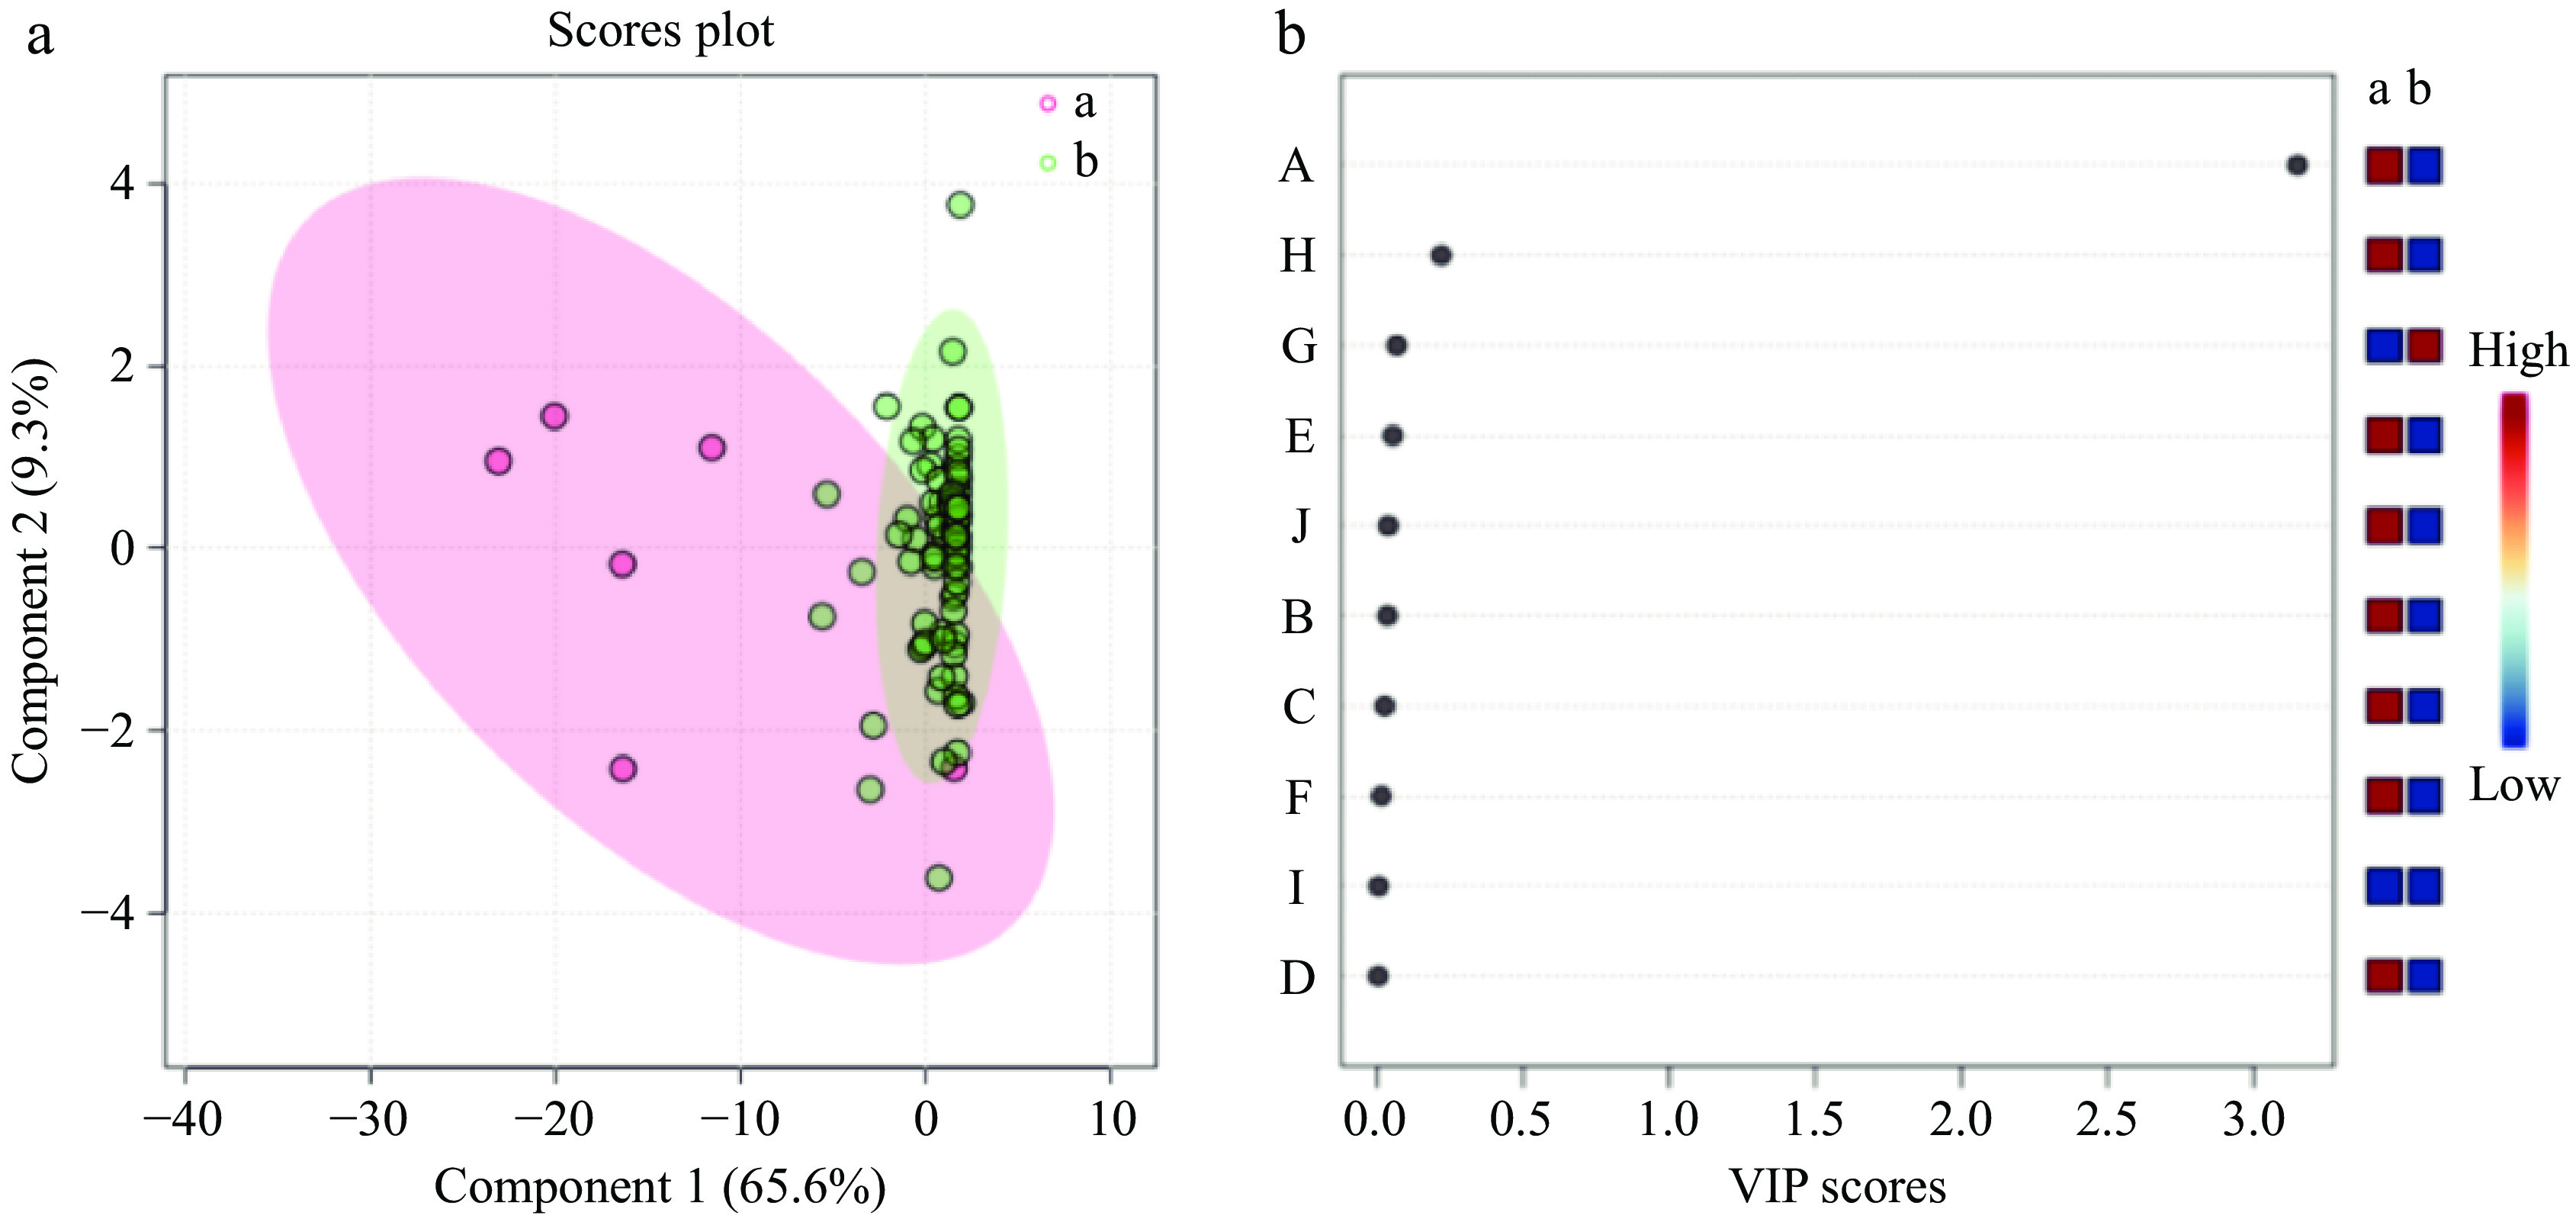
    • A data matrix of dimensions 100 × 10 was constructed, representing the content of 10 aromatic compounds in 100 herbaceous peony cultivars as variables. A cluster heatmap was generated using the microbiome analysis platform, as illustrated in Fig. 4. In light of the clustering results and a comprehensive consideration of the major aromatic components, the 100 herbaceous peony cultivars are ultimately classified into two groups (Table 4). The first group of herbaceous peony cultivars is distinguished by a marked prevalence of benzene,1,4-dimethoxy-, with markedly elevated levels in comparison to other cultivars. This gives rise to a pronounced clove scent, indicative of a clove floral type. This initial classification is based on the presence of specific compounds and is therefore applicable to only five cultivars. The cultivars in question are P. lactiflora 'Taohua Huancai', P. lactiflora 'Xishifen', P. lactiflora 'Dabanhong', P. lactiflora 'Fumantang', and P. lactiflora 'Zhushapan'. The second group generally exhibits lower levels of aromatic compounds, resulting in milder scents that may be characterized as a light floral type. The second group comprises 95 cultivars, including representative cultivars such as P. lactiflora 'Meiju', P. lactiflora 'Shaonvfen', P. lactiflora 'Fenmian Taohua', P. lactiflora 'Fenling Hongzhu', and P. lactiflora 'Guohuo', among others.
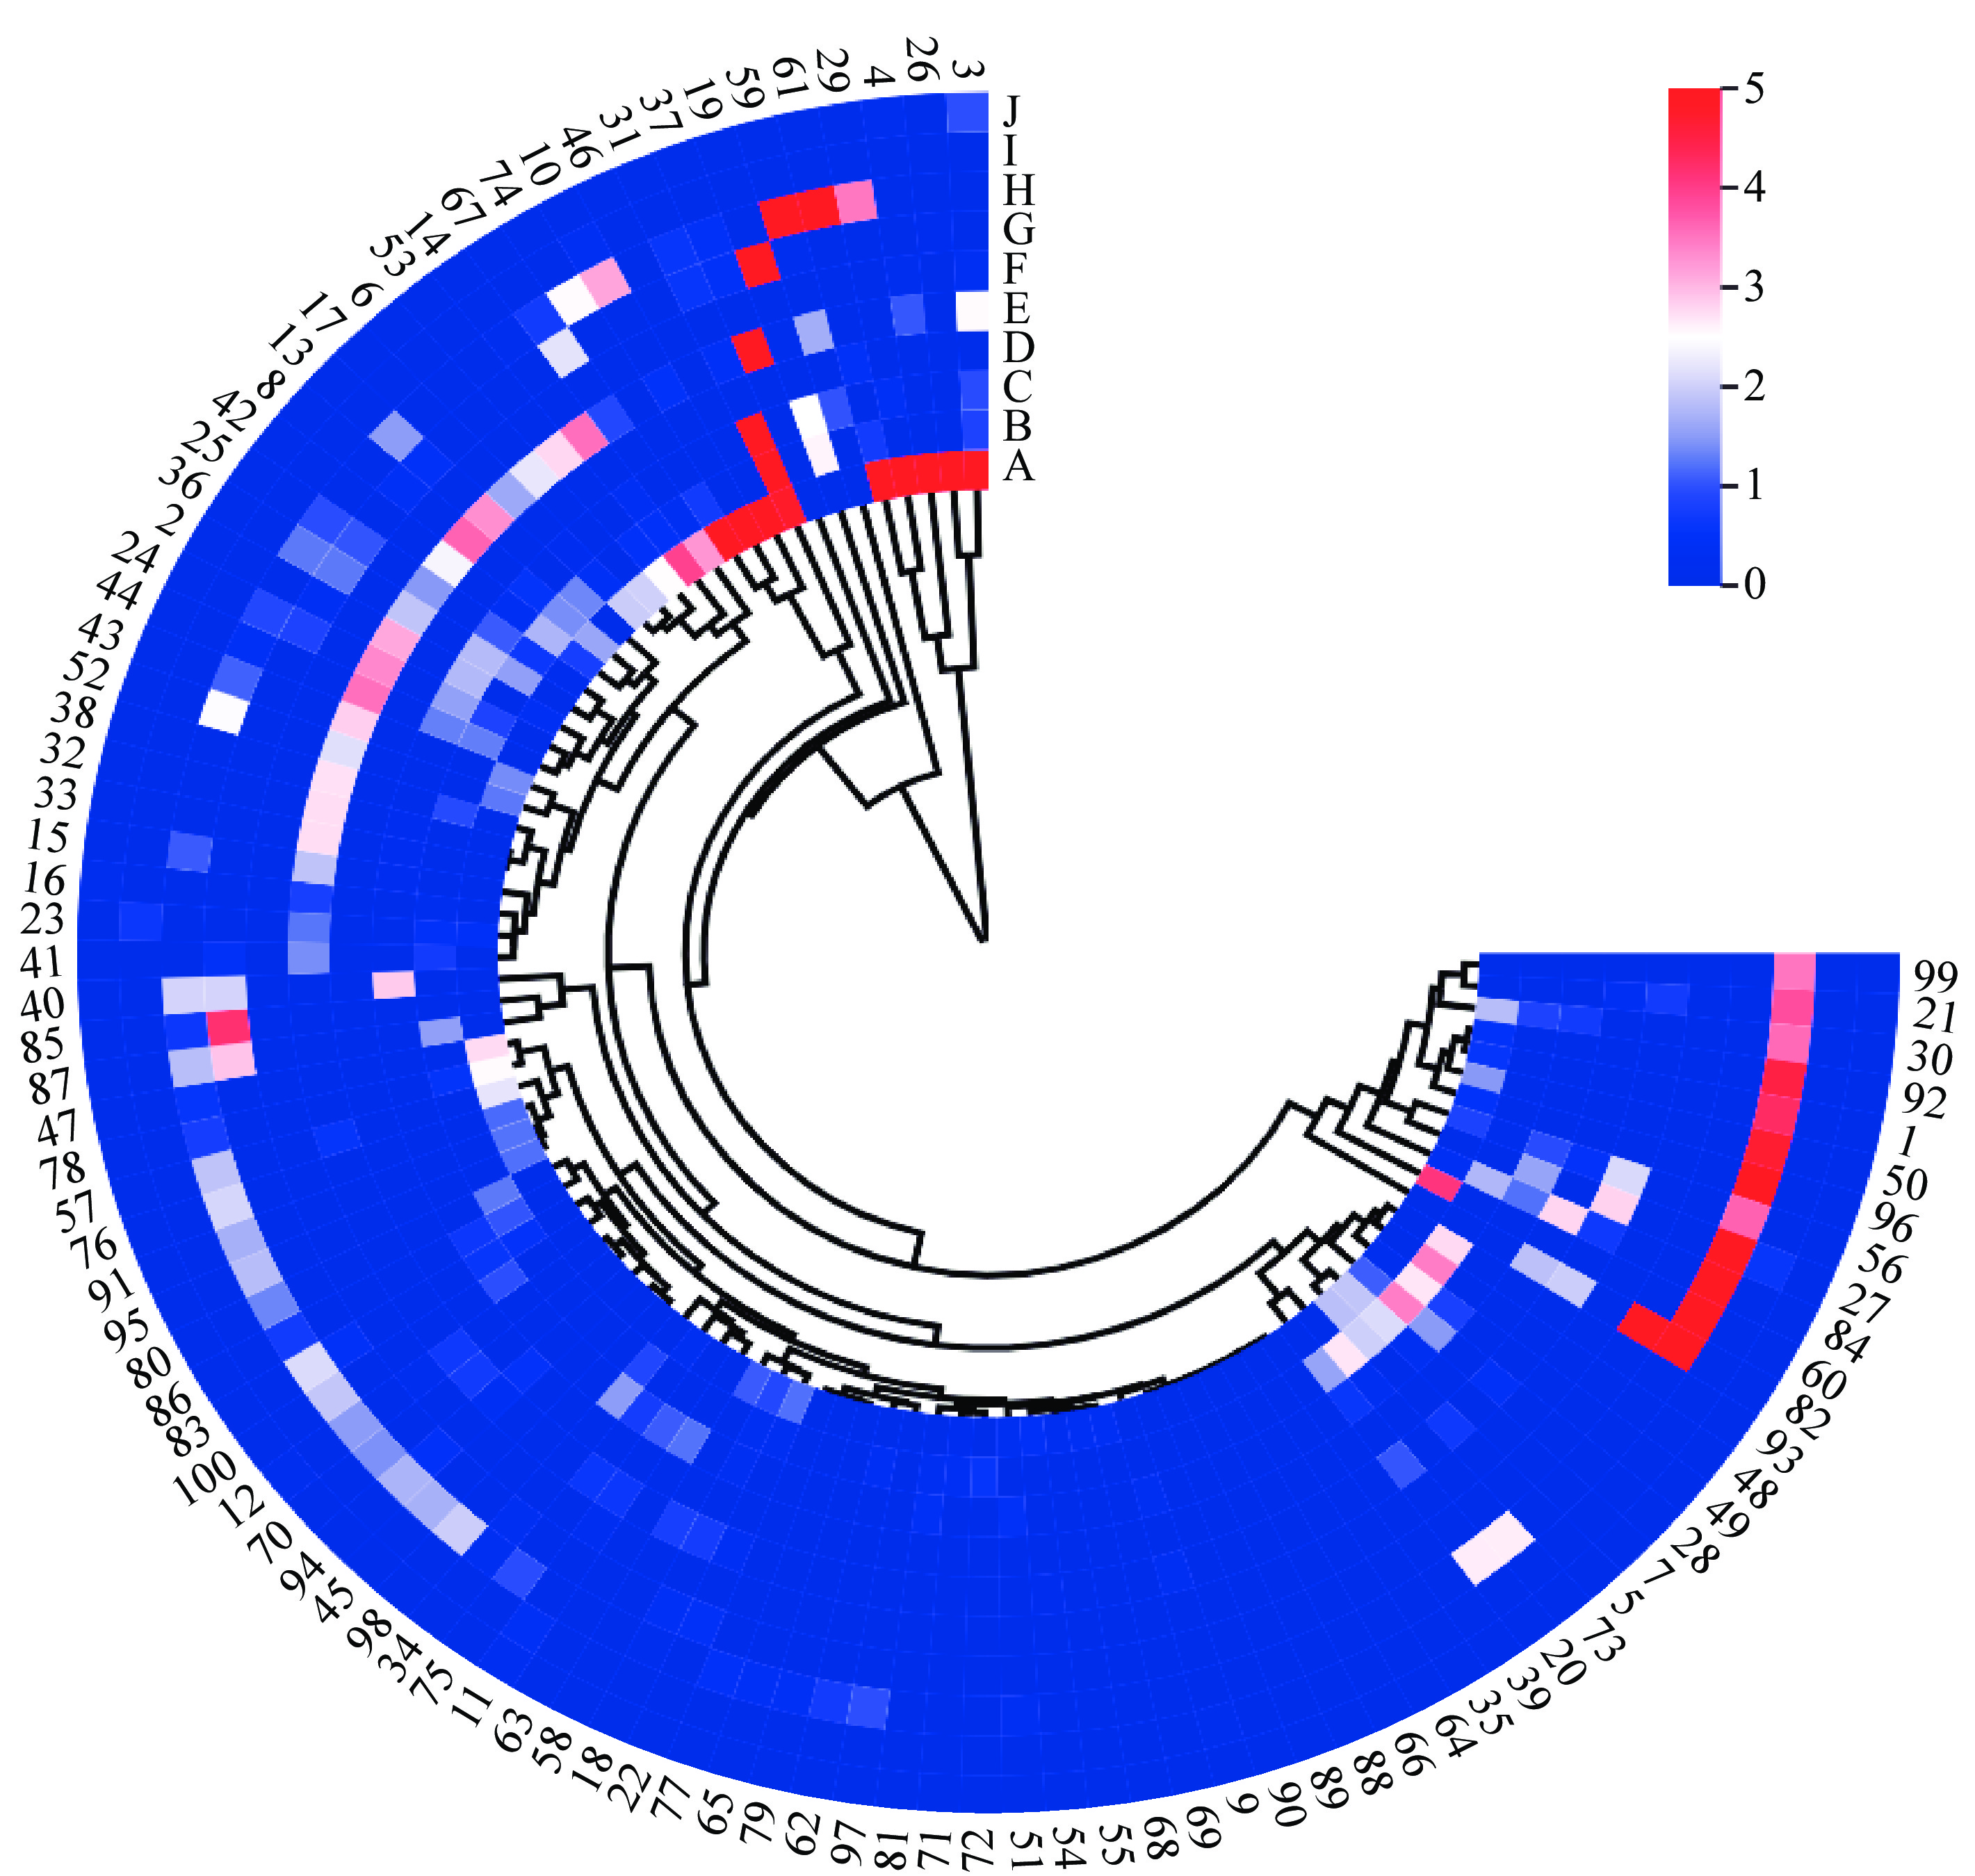
      Figure 4. 

      Heat map showing the clustering analysis of 100 herbaceous peony cultivars. A-Benzene,1,4-dimethoxy-, B-Citronellol, C-Nerol, D-Acetic acid, 2-phenylethyl ester, E-Methyl cinnamate, F-Dimethyl phthalate, G-(Z)-β-ocimene, H-Phenylethyl alcohol, I-Butylated hydroxytoluene, J-Dibutyl phthalate. The numbers 1−100 correspond to the cultivar names listed in Table 1.

      Table 4.  Cluster analysis of characteristic aroma components in different herbaceous peony cultivars.

      Groups Herbaceous peony cultivars
      1 'Taohua Huancai', 'Xishifen', 'Dabanhong', 'Fumantang', and 'Zhushapan'
      2 'Liantaizi', 'Hushui Dangxia', 'Shaifugui', 'Hongfeng', 'Wandai Shengse', 'Zhaoyuanfen', 'Wawamian', 'Lanju', 'Shuanghonglou', 'Fenling Hongzhu', 'Guohuo', 'Fenmian Taohua', 'Yinlong Tanhai', 'Chaoshihong', 'Shaonvfen', 'Meiju', 'Huolian Jingang', 'Meiguihong', 'Chilong Huancai', 'Yinlong Hanzhu', 'Yanlihong', 'Zhaoyanghong', 'Yinxian Xiuhongpao', 'Fenchi Dicui', 'Xueyuan Hongxing', 'Fenfurong', 'Linglongyu', 'Xiangyang Qihua', 'Hongrongqiu', 'Huguang Shise', 'Yanzhihong', 'Duoyezi', 'Mozijin', 'Guifei Chacui', 'Ziling', 'Zixia Yingxue', 'Zixiuqiu', 'Jinzan Ciyu', 'Meirenmian', 'Zifengyu', 'Jinshanhong', 'Hongyan Lushuang', 'Hongguanfang', 'Jindaiwei', 'Canglong', 'Tuopan Jinhua', 'Huolian Chijin', 'Fengchao Chuyu', 'Hongyuqiu', 'Xueyuan Hongxing', 'Qiaoling', 'Dahongpao', 'Qundiehui', 'Tuanye Jinqiu', 'Dafugui', 'Taoranzui', 'Yanzhi Dianyu', 'Tongquechun', 'Ziyanshuang', 'Gaoganfen', 'Fenpan Jinxing', 'Fenkui', 'Lantian Piaoxiang', 'Zifeng Zhaoyang', 'Xingguang Canlan', 'Hongyan Feishuang', 'Biahuazi', 'Taohuafen', 'Danfeng', 'Hongfengyu', 'Fenzilou', 'Yanzi Xiangyang', 'Zaoyuanhong', 'Luhong', 'Yahong', 'Luxihong', 'Furong Jinhua', 'Jinbian Hongge', 'Wulong Tanhai', 'Zhongshenghua', 'Zifurong', 'Hongyan Zhengshuang', 'Gaoganhong', 'Heixiuqiu', 'Hongling Chijin', 'Hongyun Yingri', 'Changshouhong', 'Fencuiqiu', 'Qingwen', 'Hongpan Jinqiu', 'Zijin Daipao', 'Biandihong', 'Fenqiu', 'Hangbaishao' and 'Fenzhuangyuan'
    • Following the clustering of 100 cultivars into two groups, a partial least squares discriminant analysis (PLS-DA) was conducted on the content of 10 aroma compounds in the 100 cultivars using Metaboanalyst software. The results of the analysis are presented in Fig. 5. The PLS model for aroma compounds demonstrated satisfactory reliability, as evidenced by R2 and Q2 values of 0.702 and 0.598, respectively. Moreover, the PLS-DA results demonstrated variations in the profile of aroma compounds between the two groups of cultivars (Fig. 5a). The application of a VIP criterion greater than 1 identified a differentiating component (Fig. 5b). The VIP values in the PLS-DA model provided further insight into the contribution of each component to the model, with components having a value of VIP > 1 being considered significant. For instance, benzene,1,4-dimethoxy-, exhibited a VIP value of 3.153 and was identified as a principal component accountable for the discrepancies among herbaceous peony cultivars (Fig. 5b), corroborating the findings of the clustering analysis. It can therefore be posited that benzene,1,4-dimethoxy- is a characteristic aroma component of these herbaceous peony cultivars.

      Figure 5. 

      PLS-DA scores of 100 herbaceous peony cultivars under two cluster groups.

      Variables A and B represent the first and second categories, respectively. The specific variables include A-Benzene,1,4-dimethoxy-, B-Citronellol, C-Nerol, D-Acetic acid, 2-phenylethyl ester, E-Methyl cinnamate, F-Dimethyl phthalate, G-(Z)-β-ocimene, H-Phenylethyl alcohol, I-Butylated hydroxytoluene, J-Dibutyl phthalate.

    • The present study comprises a comprehensive identification and analysis of the volatile constituents present in 100 herbaceous peony cultivars during the half-opening stage. The findings indicated that alkanes, alcohols, and ethers were the most prevalent volatile compounds, with benzene,1,4-dimethoxy- was identified as the distinctive aromatic components.

      One such molecule is benzene,1,4-dimethoxy-, a methoxylated aromatic volatile compound that is known to elicit physiological and behavioral responses in a diverse range of insect pollinators. It serves as a principal floral volatile in a number of plant species belonging to diverse genera, including Salix, Lithophragma, Nelumbo, Catasetum, Allium, and Fragaria[47]. Wang et al.[40] identified the common floral component, benzene,1,4-dimethoxy-, in all eight herbaceous peony cultivars. Furthermore, Kimani et al.[32] identified 95 volatile organic compounds in 24 herbaceous peony cultivars, including benzene,1,4-dimethoxy-, which is a phenolic methyl ether containing a benzene skeleton but not derived from aromatic amino acids. Rather, it is a member of a particular chemical class that is responsible for the olfactory characteristics of specific plant varieties. The types and contents of volatile components of herbaceous peonies may be associated with the sampling method, sampling location and time. Additionally, the types and contents of volatile compounds in plants may be influenced by different planting environmental conditions[48].

      In recent years, there has been a growing emphasis on the natural floral volatiles present in herbaceous peonies, with the fragrance components demonstrating a diverse range of applications in the fields of healthcare, perfumes, and cosmetics[49]. Floral scent represents a significant component of plant volatiles, which are primarily composed of terpenes, aromatic hydrocarbons, fatty acids, and their derivatives, as well as sulfur and nitrogen-containing compounds[27,50]. These compounds are taxonomically categorized into three primary classes, contingent upon their biogenic origins, namely fatty acid derivatives, phenylpropanoids/benzenoids, and terpenoids[51]. In the present study, the volatile components of the 100 cultivars of herbaceous peony were predominantly identified as alkanes, esters, and alcohols. The most abundant type of compound was identified as alkanes. The available evidence suggests that straight-chain alkanes represent the primary constituents of plant leaf wax[52]. These waxes are not exclusive to leaves but may also be found on other plant organs, including flowers and fruit surfaces[53]. This indicates that wax layers may cover the surfaces of the majority of herbaceous peony cultivars. Alcohols play a significant role in the fragrance industry, serving as essential raw materials for synthetic fragrances and as an indispensable component in perfumery[54]. The presence of abundant ether compounds results in the production of pleasant floral and fruity aromas, while simultaneously enhancing the richness, typicality, and complexity of plant fragrances[55].

      However, due to the constraints of the existing literature, some volatile components, such as specific alkanes, have not yet been conclusively identified as fragrance components. Further research is required to ascertain whether these components contribute to the fragrance of herbaceous species. Alkane compounds have relatively high thresholds[56] and make minimal contributions to the overall scent[28]. Accordingly, the analysis of fragrance compounds excludes the contributions made by nonane, decane, pentadecane, hexadecane, heptadecane, and tetracosane.

    • This study employed dynamic headspace bag adsorption of live plant materials and gas chromatography-mass spectrometry (GC-MS) analysis techniques to identify a total of 16 volatile components in 100 herbaceous peony cultivars at the half-opening stage[57]. The components were primarily categorized into six major groups: alkanes, esters, alcohols, terpenes, ethers, and phenols. The predominant volatile compounds were alkanes, alcohols, and ethers, while benzene,1,4-dimethoxy- was identified as the main aromatic component. Significant variations in the total content of the main aromatic components were observed among the different herbaceous peony cultivars at the half-opening stage. In particular, P. lactiflora 'Taohua Huancai', P. lactiflora 'Xishifen', P. lactiflora 'Dabanhong', P. lactiflora 'Fumantang', and P. lactiflora 'Zhushapan' exhibited the highest content of aromatic components, resulting in a more intense floral fragrance. The intensity and characteristics of the aroma exhibited notable variation among different herbaceous peony cultivars, attributable to differences in the quantity and composition of the aromatic components. This is a crucial indicator for evaluating the quality of herbaceous peony. This study provides a theoretical foundation for understanding the formation and regulation mechanisms of herbaceous peony aroma characteristics, while also offering technical support for accelerating industrial development and utilization of herbaceous peony aromas.

      • This research was funded by the Science and Technology Innovation Talents in Universities of Henan Province (Grant No. 22HASTIT036) and the Project of Henan Province Traditional Chinese Medicine Industry Technology System (Grant No. 2024-24).

      • The authors confirm contribution to the paper as follows: study conceptualization, reviewing, editing and funding acquisition: Guo L; material preparation: Wang A, Luo Y, Niu T, Zhao X, Gao K; data curation: Wang A, Luo Y, Niu T, Wang S; draft manuscript preparation: Wang A, Luo Y; manuscript reviewing and editing: Hou X. All authors reviewed the results and approved the final version of the manuscript.

      • All data generated or analyzed during this study are included in this published article.

      • The authors declare that they have no conflict of interest.

      • # Authors contributed equally: Aixin Wang, Yasang Luo

      • Copyright: © 2024 by the author(s). Published by Maximum Academic Press, Fayetteville, GA. This article is an open access article distributed under Creative Commons Attribution License (CC BY 4.0), visit https://creativecommons.org/licenses/by/4.0/.
    Figure (5)  Table (4) References (57)
  • About this article
    Cite this article
    Wang A, Luo Y, Niu T, Gao K, Wang S, et al. 2024. Identification and content analysis of volatile components in 100 cultivars of Chinese herbaceous peony. Ornamental Plant Research 4: e032 doi: 10.48130/opr-0024-0029
    Wang A, Luo Y, Niu T, Gao K, Wang S, et al. 2024. Identification and content analysis of volatile components in 100 cultivars of Chinese herbaceous peony. Ornamental Plant Research 4: e032 doi: 10.48130/opr-0024-0029

Catalog

  • About this article

/

DownLoad:  Full-Size Img  PowerPoint
Return
Return