ARTICLE   Open Access    

Boronate affinity-mediated magnetic solid phase extraction and bioactivities of polysaccharides from beverage plants

  • # These authors contributed equally: Yuwen Ding, Haiyang Li

More Information
  • Polysaccharides are of great significance in food production, but their isolation highly relies on multi-staged liquid-liquid extraction. In this study, a boronate affinity-mediated magnetic solid phase extraction (BA-MSPE) method was initiated for the effortless and efficient extraction of polysaccharides using boronic acid-grafted magnetic nanospheres (MNPs@B(OH)2) as extractants. MNPs@B(OH)2 showed fine class selectivity toward cis-diol containing compounds at weak alkaline condition (pH 7.5~8.5) and higher binding capacity than that of MNPs without boronic acid functionalization. Fast binding dynamics with a binding equilibrium within 10 min, stronger affinity toward polysaccharides (Kd as low as 10−3~10−6 M level) than that of small molecular cis-diol compounds (Kd in the range of 10−1~10−4 M level), and good recyclability (the binding capacity decreased less than 13% after ten times consecutive extraction) could also be observed for MNPs@B(OH)2. Finally, the BA-MSPE of polysaccharides was performed with three beverage plants as real samples, including tea leaves, soybeans, and Lycium barbarum. Antioxidant activity of polysaccharide extractives was verified by DPPH radical scavenging assays, giving a radical scavenging rate of 31.4% and 18.8% for crude extractives of TPS (tea polysaccharide) and LBPS (Lycium barbarum polysaccharide), respectively. Microscopic imaging combining with MTT and trypan blue staining trials uncovered that the extractives were of dosage-dependent antitumor bioactivities, giving the cell mortality rates over 91.8% and 77.2% for MCF-7 and A549 cells in the presence of 5.0 mg/mL TPS, and 56.6% and 40.0% with the equal dosage of LBPS, respectively. As the BA-MSPE strategy is simple and eco-friendly, there will be more potential for the application of cis-diol compound purification.
  • Salvia miltiorrhiza is one of the most commonly used Chinese medical herbs. As a representative species of the Lamiaceae, it is widely used in the treatment of cardiovascular and cerebrovascular diseases[1]. Its main active components are phenolic acids and tanshinones, of which phenolic acids consist of salvianolic acid A (Sal A), salvianolic acid B (Sal B), caffeic acid (CA), and rosmarinic acid (RA)[24], while tanshinones include dihydrotanshinone (DT), cryptotanshinone (CT), tanshinone I (TI), and tanshinone IIA (TIIA). The above active ingredients have various pharmaceutical values including anti-tumor, antioxidant, and anti-inflammatory effects[58]. In recent years, several transcription factors have been reported to participate in and regulate the synthesis of secondary metabolites of S. miltiorrhiza[9]. DNA binding with one finger (Dof) family is a typical transcription factor (TF) family with zinc finger proteins domain, which is unique to plants and plays an important role in modulating plant growth and development[10]. The Dof family has two main regional domains, namely the N-terminal conserved DNA binding domain and the C-terminal transcriptional regulation domain[10]. The N-terminal of the Dof protein is usually a highly conserved C2-C2 zinc finger domain consisting of 50−52 amino acids, and it can bind to the AAAG cis-acting element in the promoter region of the target gene[11]. The DNA binding domain is a key region, that is considered to be a bidirectional domain and can interact with other proteins[1113]. The transcriptional regulatory domain of the C-terminal region may perform a variety of functions as it interacts with different regulatory proteins to activate the expression of target genes[11,13].

    Dof proteins play a vital role in plant carbon and nitrogen metabolism[14,15], abiotic stress[16], hormone regulation[17], flowering control[18], light responses, and others[19]. Dof gene (ZmDof1) was first discovered in Zea mays[20], and it was thought to participate in the process of carbon metabolism by regulating the expression of the C4 photosynthetic phosphoenolpyruvate carboxylase (C4PEPC) gene in Z. mays[21]. JcDof3 interacts with F-box protein to regulate photoperiodic flowering and affect the flowering time[22]. In addition, multiple studies have shown that Dof genes are involved in various environmental changes[23]. OsDof18 is associated with the transport of ammonium salt in rice, thus regulating the utilization efficiency of nitrogen in rice[24] , and it can also restrict the biosynthesis of ethylene and increase prophase primary root elongation[17]. The expression of ThDof1.4 and ThZFP1 of Tamarix ramosissima can increase the content of proline and enhance the scavenging ability of ROS, thus improving the tolerance of Tamarix to salt stress and osmotic stress[25]. In Arabidopsis thaliana, AtCDF3 was highly induced by drought, low temperature, and abscisic acid (ABA), and the overexpression of AtCDF3 in transgenic plants enhanced their tolerance to drought, cold, and osmotic stress[26]. SlDof22 is involved in the production of ascorbic acid and the process of tomato salt stress in tomato[27]. These studies uncovered the importance of Dofs in the life cycle of plants.

    Plant hormones are trace compounds involved in the whole process of plant growth and development, and influence the growth and development of plants[28]. ABA, as an important plant hormone can accelerate the shedding of plant organs, and can impact the synthesis of secondary metabolites by stimulating the corresponding transcription factors in plants[9]. In S. miltiorrhiza, ABA can induce the expression of SmbZIP1 leading to the upregulation of SmC4H1 to promote the accumulation of phenolic acids[9]. ABA can also significantly promote the expression of HMGR, FPS, CYP71AV1, and CPR, thus increasing the content of artemisinin in Artemisia annua[29].

    In recent years, the Dof gene family has been gradually identified in many plants due to the continuous publication of the high quality of plant genomes. There were 36 Dof genes in Arabidopsis[30], 103 Dof genes in Camelina sativa[31], 34 Dof genes in melon[32], and 51 Dof genes in blueberry[33]. However, the Dof family has not been fully explored in the whole genome of S. miltiorrhiza. Due to the importance of the Dof gene in various physiological processes of plants, it is necessary to study its specific role in S. miltiorrhiza. In the present study, genome and transcriptome data of S. miltiorrhiza were used to identify the Dof genes. Then, multiple sequence matching, evolutionary tree analysis, gene structure, and cis-acting element analysis were systematically investigated in the whole genome of S. miltiorrhiza. To predict the function of SmDofs in regulating the biosynthesis of tanshinones and phenolic acids in S. miltiorrhiza, co-expression analysis of the biosynthetic pathway genes related to tanshinones and phenolic acids and the SmDofs was performed based on the transcriptome data induced by ABA, and then the target gene of candidate SmDofs were validated by the dual luciferase (Dual-LUC) assay. This study enlarges the understanding of the SmDof gene family, and reveal the potential molecular mechanism of SmDofs in regulating the biosynthesis of tanshinones and phenolic acids in S. miltiorrhiza.

    The genome sequences were downloaded from the S. miltiorrhiza database[34]. Based on the Pfam database (http://pfam.xfam.org/), the Hidden Markov Model (HMM) file of the Dof gene family (PF02701.18) was obtained, and the whole genome of S. miltiorrhiza compared using the HMMER search program in HMMER3.0 software package to obtain the gene sequence of the initial screening[35]. SMART (http://smart.embl-heidelberg.de/) and MOTIF Search (www.genome.jp/tools/motif) are employed to predict the structure of the candidate protein domains. ExPASy (http://web.expasy.org/compute_pi/) was used to calculate the sequence length, molecular weight, and isoelectric point[36]. Finally, WoLF PSORT (https://wolfpsort.hgc.jp/) was introduced to predict the subcellular localization of the identified Dof proteins[37].

    The conserved domain of SmDofs protein was studied by multiple sequence alignment using the DNAMAN 7.0 software. The AtDof protein sequences of A. thaliana were downloaded from the TAIR database (www.arabidopsis.org)[38]. AtDofs and SmDof proteins were analyzed using MEGA 6.0. The phylogenetic tree was constructed using the neighborhood join method (NJ) with the bootstrap value set to 1,000[39].

    The organization of exons, introns, and untranslated regions of the SmDof genes were analyzed using the Gene Structure Display Server (http://gsds.cbi.pku.edu.cn/), and visualized by loading the GFF files of SmDof genes of S. miltiorrhiza to the TBtools (v.2.003) software, which was also used for analyzing and searching for conserved motifs[40]. PlantCARE database (http://bioinformatics.psb.ugent.be/webtools/plantcare/html/) was introduced to study the cis-acting elements in a length of 1,500-bp in the upstream of the initiation codon of the 31 SmDof genes in S. miltiorrhiza. According to the functional annotations of cis-acting elements, the candidate elements were gathered for further research[41].

    Two transcriptome datasets of S. miltiorrhiza, of which one is generated from four tissues including flower, stem, leaf, root, and another is collected from hairy roots induced by ABA, were adopted to analyze the expression level of SmDof genes[42]. TBtools (v.2.003) software was employed to draw a heat map to exhibit the expression level of the SmDof genes derived from transcriptome dataset[40]. To detect the expression profile of candidate SmDof genes, hairy roots of S. miltiorrhiza were treated with 50 μM ABA and collected after treatment for 0-, 0.5-, 1-, 2-, 4-, and 8-h, respectively[7] . The collected samples were quickly placed in liquid nitrogen and stored in the refrigerator at −80 °C for subsequent RNA extraction. Total RNA was extracted from S. miltiorrhiza hairy roots using the Plant Total RNA Extraction Kit (Vazyme Biotech Co., Ltd, China). Meanwhile, the concentration and purity of the extracted RNA was measured by spectrophotometer, and then the RNA integrity was observed by electrophoretic analysis with 1% agarose gel. Reverse transcription was performed with the cDNA Synthesis Kit (Vazyme Biotech Co., Ltd, China), and a total of 100 ng RNA was prepared for cDNA synthesis reaction with a volume of 50 μL[43]. Quantitative primer pairs were designed using the Primer 5.0 software. SuperReal PreMix Plus kit (Vazyme Biotech Co., Ltd, China) was used in ABI Step One Plus real-time PCR System. Quantitative real-time PCR (qPCR) was performed using 10 μL real-time PCR reaction solution, including 1 μL cDNA was used as a template; the upper and downstream primers were 0.2 μL, respectively; 5 μL Taq Pro SYBR qPCR Master Mix and 3.6 μL ddH2O. The PCR reaction conditions were as follows: 95 °C for 15 s, 60 °C for 30 s, 72 °C for 30 s, a total of 40 cycles, each sample was triply repeated. SmActin was used as the internal reference gene to normalize the expression level of Dof genes. The method of 2−ΔΔCᴛ was used to calculate the relative expression level of SmDofs[7].

    The co-expression relationship between the SmDof genes and the biosynthetic genes involved in tanshinones and phenolic acids biosynthesis was resolved. Pearson correlation coefficient > 0.8 and p-value < 0.05 was set as the cutoff. Then, the co-expression relationship was visualized with the Cytoscape software[44].

    To dissect the subcellular localization profiles of SmDof proteins, the open reading fragment (ORF) cDNA sequences of SmDof12 and SmDof29 are amplified and inserted into the vector of PHB-YFP to generate the fusion recombinant of PHB-SmDof12-YFP and PHB-SmDof29-YFP, and then they are transformed into Agrobacterium tumefaciens GV3101 and injected into N. benthamiana leaves for transient transformation, respectively[3]. pHB-YFP was used as the negative control. The transgenic N. benthamiana leaves were cultivated in the dark for 24 h and then transferred to the light for 24 h. YFP signals from infected N. benthamiana leaves were visualized using a high-resolution microscope observation system. The nuclei of epidermal cells of infected N. benthamiana leaves were stained with 4',6-diamidino-2-phenylindole dihydrochloride (DAPI) solution (10 μg/mL) for 2 h before observation.

    To investigate the ability of SmDofs to transcriptionally activate the tanshinones biosynthetic genes, Dual-luciferase (Dual-LUC) assays were performed as previously reported[45]. Each of the recombinant plasmids of PHB-SmDof12-YFP and PHB-SmDof29-YFP was introduced into A. tumefaciens strain GV3101 to be the effector, and PHB-YFP plasmid was used as a negative control. The promoters of PAL and GGPPS were inserted into pGREEN0800 vector as the reporter constructs to drive the expression of the firefly luciferase gene, respectively. The Renilla luciferase gene driven by CaMV 35S promoter was used as an internal control. And then, each of them was co-transformed into A. tumefaciens strain GV3101 with the helper plasmid pSoup19. The reporter strains were mixed with effector strains at a ratio of 1:1 to inject into N. benthamiana leaves. Leaves were collected after 48 h for determination of fluorescence values according to the manufacturer's instructions (Promega, Madison, WI, USA)[9]. Three biological replicates were measured for each sample.

    Different tissues including roots, stems, leaves, and flowers of S. miltiorrhiza were collected and dried in an oven. The dried tissues were then ground to powder for compound analysis. Extraction of tanshinones and phenolic acids and high-performance liquid chromatography (HPLC) detection were done as the previous report[6,9]. The total content of tanshinones and phenolic acids were quantified by comparing the standard curves and retention times, with solutions without extracts added as the controls.

    All the detections performed in the present study, including qRT-PCR, HPLC, and Dual-LUC assays, were triply repeated. Gene expression levels, tanshinone contents, and phenolic acid contents were presented as the mean value ± SD. SPSS 16.0 software (SPSS) was employed to analyze statistical significance by single-sample t-test and one-way analysis of variance. p-value < 0.05 was regarded to be statistically significant.

    The Hidden Markov model (HMM) of the Dof domain (PF02701.18) was employed to search for Dof genes in S. miltiorrhiza. A total of 31 Dof genes were detected, and the gene was named SmDof1-SmDof31, respectively (Supplementary Table S1). The results of Pfam and SMART analysis showed that all of these proteins contained complete Dof domains[23]. The CDS length, protein molecular weight (MW), isoelectric point (pI), and subcellular location of each SmDof gene in S. miltiorrhiza were further analyzed (Table 1). Of the 31 proteins, SmDof25 and SmDof22 had the lowest number of amino acids, decreasing to 168, while SmDof16 had the highest number of amino acids, reaching to 511. The pI of SmDofs ranges from 6.01 (SmDof5) to 10.55 (SmDof17), and the molecular weight ranges from 18,463.7 (SmDof22) to 55,341.6 (SmDof16). Subcellular localization prediction revealed that 27 SmDofs were located in the nucleus, while four SmDofs including SmDof19, 21, 22, and 25 located in chloroplasts (Table 1).

    Table 1.  Length, molecular weight, isoelectric point, and subcellular localization of 31 SmDof proteins in S. miltiorrhiza.
    Gene ID Name Length (aa) MW (Da) pI Subcellar
    localization
    SMILT016590.1 SmDof1 304 33,168.7 8.66 nucleus
    SMILT016591.1 SmDof2 246 26,202.9 9.8 nucleus
    SMILT016651.1 SmDof3 242 26,184.9 8.96 nucleus
    SMILT021318.1 SmDof4 225 23,560.2 8.6 nucleus
    SMILT032678.1 SmDof5 224 24,689.4 6.01 nucleus
    SMILT003591.1 SmDof6 241 25,256.1 4.66 nucleus
    SMILT009582.1 SmDof7 306 32,436.3 4.69 nucleus
    SMILT017417.1 SmDof8 301 33,248.9 6.7 nucleus
    SMILT020107.1 SmDof9 332 36,827.9 7.94 nucleus
    SMILT023380.1 SmDof10 318 34,176.8 9.72 nucleus
    SMILT025505.1 SmDof11 283 30,690.9 8.48 nucleus
    SMILT025760.1 SmDof12 274 30,006.1 8.47 nucleus
    SMILT028288.1 SmDof13 249 27,303.1 8.99 nucleus
    SMILT030586.1 SmDof14 334 36,582.9 6.92 nucleus
    SMILT031093.1 SmDof15 230 23,444.9 8.49 nucleus
    SMILT000323.1 SmDof16 511 55,341.6 5.23 nucleus
    SMILT000784.1 SmDof17 265 27,611.4 10.55 nucleus
    SMILT000789.1 SmDof18 198 22,350 9.04 nucleus
    SMILT001058.1 SmDof19 190 20,795.1 9.27 chloroplast
    SMILT001687.1 SmDof20 216 24,023.7 9.28 nucleus
    SMILT002891.1 SmDof21 268 29,359.3 4.54 chloroplast
    SMILT004451.1 SmDof22 168 18,463.7 8.83 chloroplast
    SMILT005491.1 SmDof23 266 29,274.4 9.31 nucleus
    SMILT007077.1 SmDof24 251 27,427 9.06 nucleus
    SMILT007580.1 SmDof25 168 18,625.9 9.22 chloroplast
    SMILT009335.1 SmDof26 191 21,529.9 9.5 nucleus
    SMILT010473.1 SmDof27 240 24,863.9 7.82 nucleus
    SMILT012697.1 SmDof28 248 26,508.7 9.28 nucleus
    SMILT019592.1 SmDof29 283 30,740.7 8.39 nucleus
    SMILT023561.1 SmDof30 337 35,816.5 9.51 nucleus
    SMILT024154.1 SmDof31 258 27,841.9 8.06 nucleus
     | Show Table
    DownLoad: CSV

    To dissect the characteristics of the domain within SmDof proteins, DNAMAN software was employed to conduct multiple amino acid sequence alignment. The results showed that all the SmDof proteins contained a conserved domain in its core sequence, namely CX2CX21CX2C zinc finger structure (Fig. 1). The conserved domain consists of 50 amino acid residues, of them four cysteine residues are relatively conserved within the zinc finger domain in the N-terminal region of SmDof proteins[11].

    Figure 1.  Multiple sequence alignment of the 31 SmDof proteins. Different colors represent identical and conserved amino acid residues, and the red box shows the conserved zinc-finger domain.

    To further explore the evolutionary relationships among the SmDof genes, a phylogenetic tree of a total of 67 Dof proteins (Supplementary Table S2) in Arabidopsis (36 members) and S. miltiorrhiza (31 members) were constructed. The total number of Dof genes in S. miltiorrhiza and A. thaliana is comparatively secure, and it indicates the conservative features of this gene family. Sixty seven Dof proteins are divided into five groups based on the branch of the tree, Groups I−V (Fig. 2). There are 31 SmDof gene families in S. miltiorrhiza, among them, six SmDofs are distributed in Group I and Group IV, 11 in Group II, and eight in Group III. In Arabidopsis, Groups I to IV contain 7, 0, 0, 10, and 19 Dof genes, respectively. The variable number of the five subgroups is beneficial for us to evaluate the degree of gene expansion or loss during the evolution of the two species.

    Figure 2.  Evolutionary relationship of SmDof proteins in S. miltiorrhiza and Arabidopsis. Varied colors represent different groups. There were five groups, Groups I−V, with the green circles representing the SmDof proteins of Arabidopsis and the orange circles representing the Dof proteins of S. miltiorrhiza.

    To further investigate the functional regions of SmDof proteins, the conserved motif was predicted by the MEME program utilizing a two-component finite mixture model. In total, 15 motifs were identified in all the SmDof proteins, and we found that many groups of SmDofs shared a similar conserved motif. As shown in Fig. 3a and b, motif 1 is included in all SmDof proteins. Among all groups, Group I contained the most SmDof members being consisted of motifs 1, 2, 3, 8, and 15. The common motifs among the SmDof proteins are indicative of conserved evolutionary relatedness and similar biological functions.

    Figure 3.  Phylogeny, conserved motifs and gene structure of SmDof proteins in S. miltiorrhiza. (a) SmDof proteins evolutionary tree. (b) Conserved motifs of the 31 SmDof proteins. Different colors represent 15 different motifs, and the bottom line represents the length of the sequence. (c) Exon/intron structures of SmDofs. Green represents UTRs and yellow represents CDS.

    To study the structure of SmDof genes, the full-length cDNA sequences of all SmDof genes with the corresponding genomic DNA were aligned (Fig. 3c). The number of exons in SmDof ranged from 1 to 2. There were no more than two introns in each SmDofs. The variation in the number of exons may indicate that the SmDof genes may have diverse functions related to the medicinal substance biosynthesis, growth, or development in S. miltiorrhiza.

    PlantCARE was introduced to analyze the promoter sequence of 31 SmDof genes from the translation initiation site (ATG), and 55 cis-acting elements were identified. Among of them, they were related to plant cell development, plant hormones, environmental stress, and light response, respectively (Fig. 4). The results show that 22 light-responsive elements get the most abundant compared to other elements, and 31 SmDof genes have light-responsive elements like Box 4, MRE, GT1-motif. In addition, 12 cis-acting elements related to plant hormones were identified. In addition, there are five cis-acting elements associated with cell development, like CAAT-box, HD-Zip 1, MBSI, CCAAT-box, and MSA-like. There are four cis-acting elements associated with environmental stress, like TC-rich repeats, AT-rich element, LTR, and MBS (Fig. 4). It is implied that most of the SmDofs may play an important role in response to plant hormones and are light responsive. This is in agreement with the previous studies on Dof gene families in sugarcane, which is thought to be involved in light response, metabolism, and other functions[19].

    Figure 4.  Cis-acting elements of SmDof promoters in S. miltiorrhiza. Dof family cis-acting element of S. miltiorrhiza. Different colors represent different classes of cis-acting elements and motifs. Green represents cis-acting elements associated with light, yellow represents cis-acting elements associated with plant hormones, purple represents cis-acting elements associated with cell development, and blue represents environmental stress.

    To gain a deeper understanding of SmDof expression patterns, four tissues including root, stem, leaf, and flower were collected to measure the total content of tanshinones and phenolic acid by HPLC, and subjected to transcriptome sequencing to investigate the expression of SmDofs. The results showed that the total phenolic acids and tanshinones content were all highest in root compared to other tissues (Fig. 5a), and a total of five genes (SmDof6, 12, 13, 27, 29) were highly expressed in the root, which is harvested in practice as the medicinal tissue[3] (Fig. 5b & Supplementary Table S3).

    Figure 5.  Expression profiles of SmDof genes and synthetase genes involved in tanshinones and phenolic acids biosynthesis pathway. (a) Contents of tanshinones and phenolic acids in different tissues of S. miltiorrhiza. (b) Expression profiles of SmDof gene in various tissues of S. miltiorrhiza. (c) Expression profile of SmDof genes under the treatment of ABA induction based on the transcriptome dataset. Red and blue boxes indicate high and low expression levels of SmDofs, respectively. (d) Expression profiles of synthetase genes involved in tanshinones and phenolic acids biosynthesis pathway under the induction of exogenous ABA detected by qRT-PCR. Three biological replicates were performed and the mean ± SD was taken, SD was represented by the error line. * indicates significant difference in t-test (*p < 0.05).

    To mine the candidate SmDofs in response to ABA treatment, the expression variation of candidate SmDof gene exhibiting at least a 2-fold increase more than the control was set as the cutoff. In total, 11 SmDof genes including SmDof9, 16, 18, 21, 22, 23, 24, 25, 26, 28, and 29 showed an obvious increase compared to the control, among which three SmDofs (SmDof22, 25, and 26) exhibited the highest increase reaching to a 17-fold increase over the control. Whereas, seven SmDof gens including SmDof4, 6, 12, 14, 15, 18, and 20 downregulated the expression levels more than 2-fold than the control (Fig. 5c &Supplementary Table S4). Moreover, qRT-PCR was employed to examine the expression level of synthetase genes involved in the tanshinones and phenolic acids biosynthesis pathway. As shown in Fig. 5d, several genes were revealed including PAL, C4H, TAT, RAS1, and CYP98A14 in phenolic acid biosynthesis pathway and GGPPS in tanshinone biosynthesis pathway upregulated significantly under the induction of exogenous ABA, in particular, PAL, and GGPPS were the most up-regulated. Therefore, the above results provide a valuable dataset for mining functional SmDof genes in regulating medicinal substance metabolite synthesis in S. miltiorrhiza.

    As reported by Shi et al., ABA can affect the expression of the biosynthetic genes involved in tanshinones and phenolic acids biosynthesis, thereby promoting the medicinal metabolites accumulation in S. miltiorrhiza hairy roots[42]. Therefore, the co-expression relationship between the 31 SmDofs with the biosynthetic genes related to the biosynthesis of tanshinones and phenolic acids in S. miltiorrhiza was dissected. The results showed that 15 SmDofs (including SmDof4, 5, 8, 10, 12, 13, 14, 15, 17, 19, 20, 28, 29, 30, 31) co-expressed with SmRAS, SmHPPR, SmC4H, Sm4CL, SmCYP98A14, SmPAL, or SmTAT genes, respectively, with the Pearson correlation coefficient > 0.8 and p-value < 0.05. Moreover, 15 SmDofs (including SmDof4, 6, 9, 10, 11, 12, 13, 14, 15, 17, 20, 27, 28, 29, 30) exhibited a co-expression pattern with SmCYP76AH1, SmKSL, SmCPS, SmGGPPS, SmDXR, or SmDXS2 genes, respectively, and the correlation coefficient was greater than 0.8. It is noteworthy that SmDof4, 10, 12, 13, 14, 15, 17, 20, 28, 29, 30 not only co-express with tanshinones biosynthetic genes, but also co-express with phenolic acids biosynthetic genes, implying that the above 11 SmDof genes may play a vital role in promoting the accumulation of the above two types of medicinal substances.

    Transcriptome dataset and co-expression analysis were integrated to mine the candidate SmDof genes in association with the biosynthesis of tanshinones and phenolic acids in S. miltiorrhiza. By the transcriptome dataset from various tissues, five SmDof genes were found including SmDof6, 12, 13, 27, and 29 all expressed vigorously in the root (Fig. 5b), which is thought to be the main tissue to accumulate the medicinal substances in practice[3]. According to the results of co-expression analysis, SmDof12 had the highest negative correlation coefficient (reaching −0.917) with the SmGGPPS gene related to the biosynthesis of tanshinones. Whereas, SmDof29 got the highest correlation with the SmPAL gene involved in the phenolic acids biosynthetic pathway, with the correlation coefficient of 0.912 (Fig. 6). Those results push us to validate the expression profile of the two SmDof genes. As expected, the expression profiles of SmDof12 and SmDof29 detected by qRT-PCR analysis were consistent with the transcriptomic dataset (Fig. 7a, b & Supplementary Table S5), of which indicated the reliability of the transcriptome dataset derived from four types of tissues and hairy root lines treated with ABA in S. miltiorrhiza.

    Figure 6.  Co-expression analysis of SmDof genes and the genes involved in the biosynthetic pathway of phenolic acids and tanshinones. R > 0.5 indicates a positive correlation; R < –0.5 indicates a negative correlation. The data were obtained from the ABA transcriptome dataset.
    Figure 7.  Functional characterization of SmDof12 and SmDof29. (a) Expression patterns of SmDof12 and SmDof29 in four tissues of S. miltiorrhiza. The fold changes of the relative gene expression level in the other three tissues are all normalized to the expression level in flower. (b) Expression patterns of SmDof12 and SmDof29 in hairy roots of S. miltiorrhiza treated with ABA. The fold changes in the relative gene expression level were all normalized to the control expression without induction at the 0 h time point. (c) Subcellular localization of SmDof12 and SmDof29 in tobacco. 35S-YFP is the control group, yellow is the fluorescence of YFP, and blue is the nucleus. Scale bar = 50 μm. (d) Dual-Luc assay showed that SmDof12 could inhibit the activity of SmGGPPS promoter and SmDof29 could promote the activity of SmPAL promoter. Three biological replicates were performed and the mean ± SD was taken, SD was represented by the error line. * indicates significant difference in t-test (* p < 0.05, ** p < 0.01).

    And then, the subcellular localization of the SmDof12 and SmDof29 in epidermal cells from 45-day-old N. benthamiana leaves were studied by transient expression analysis of the two genes fused with YFP, respectively. Robust fluorescence was observed only in the nuclei in 35S-SmDof12-YFP and 35S-SmDof29-YFP, while the 35S-YFP control displayed fluorescence throughout the whole cell (Fig. 7c), suggesting that the SmDof12 and SmDof29 proteins are all localized in the nuclei in S. miltiorrhiza.

    According to the results of co-expression analysis, it pushes the exploration of the underlying mechanism of SmDof12 and SmDof29 in regulating tanshinones and phenolic acids. By Dual-LUC assay (Fig. 7d), it was revealed that SmDof12 could uniquely inhibit the transcription of the SmGGPPS promoter, leading to a 3-fold decrease compared to the 35S-YFP control, whereas, SmDof29 significantly activated the SmPAL promoter up to 1.69-fold compared to the control. Those results indicated that SmDof12 might inhibit the biosynthesis of tanshinones by decreasing the activity of the SmGGPPS promoter, while SmDof29 activated the transcription of SmPAL to increase the production of phenolic acids in S. miltiorrhiza.

    Dof genes widely exist in plants and have been validated to participate in diverse biological functions[14,15]. S. miltiorrhiza is a valuable traditional Chinese herbal plant and has been used widely in clinic treatments[1]. Genome-wide identification of SmDof gene lays a foundation for the subsequent study of its function. In the present study, a total of 31 Dof genes were identified in S. miltiorrhiza, and the number of SmDof genes was comparative to that of A. thaliana (36 members)[30], rice (30 members)[32], and tomato (34 members)[46]. The genome size of the above plants varied greatly, but the number of Dof proteins was not related to the size of the genome thus implying its conserved function in the above plant species.

    Multiple sequence alignment uncovered the conserved domain within the SmDof proteins in S. miltiorrhiza. Phylogenetic tree construction showed that the SmDofs got low homology with Arabidopsis, and only Group I together with Group IV had more than six Dof genes getting high sequence similarity between S. miltiorrhiza and Arabidopsis. Previous studies have confirmed that phylogenetic analysis can provide a valuable theoretical basis for functional prediction of similar genes in different species[46]. Genes clustering in the same subgroup are relatively conserved in gene structure, gene expression patterns, and functional evolution[47]. By phylogenetic tree construction, it was found that AtDof5.4 and SmDof7 had high homology, and they were grouped into the same branch. Previous studies have verified that AtDof5.4 is a negative regulator modulating cell proliferation and expansion in Arabidopsis[48], so it is speculated that SmDof7 may also have the same function as AtDof5.4. Indeed, SmDof7 got the highest expression level in the stem and root, indicating that SmDof7 might regulate the cell proliferation and expansion in stem and root of S. miltiorrhiza.

    The diverse structure and organization of the Dof genes, is associated with the evolution and functional differentiation of this gene family in certain species[49]. Gene structures analysis of all the Dof genes in S. miltiorrhiza exhibited visible variation between different subgroups, while similar structures were observed within the same subgroup (Fig. 3c). In general, the structure of the 31 SmDof genes was relatively simple and contained one or two exons, of which it was similar to the previous studies on melon[15]. However, 11 SmDof genes (including SmDof 11, 16, 17, 18, 19, 22, 23, 24, 26, 29, 31) had only one intron or even no intron (Fig. 3c). As previously reported, the intron-less genes may be associated with the quick stress response[50].

    In previous reports, many Dof genes have been validated to be a key regulatory center involved in secondary metabolic synthesis, abiotic stress response, and hormone regulation pathway[23,51,52]. In grape (Vitis vinifera L.), VyDof8 was validated to be induced by a variety of abiotic stress. Overexpression of VyDof8 in tobacco (Nicotiana tabacum) significantly elevated ABA accumulation and drought tolerance during prolonged droughts compared to the control plants[53]. The expression pattern of candidate genes in a certain tissue or under stress signal is often closely related to the function of these genes[54]. Therefore, in this study, the transcriptome dataset of S. miltiorrhiza was introduced to dissect the expression profiles of SmDof gene families in root, stem, leaf, and flower. Most of the SmDof genes (23 out of 31) are expressed in the root of S. miltiorrhiza. It is speculated that some members of the 23 SmDof genes may be related to the growth and development of S. miltiorrhiza roots. It was also revealed that SmDof3 and 16 are highly expressed in flower (Fig. 5b). As a Dof gene, CDF3 in tomato (Lycopersicon esculentum) getting high gene sequence homology with SmDof3 and 16 were validated to regulate the flowering time through modulating the expression of FT-like genes[55]. Therefore, the research project whether overexpression of SmDof3 or 16 in S. mitiorrhiza has a significant impact on regulating its flowering time or growth is worthy of inquiry. The varied expression profiles of SmDof genes in various tissues provide basic data to explore their functions.

    By investigating cis-acting elements within promoters, it indicates that the SmDof genes are related to light response, hormone-related response, cell development, and environmental stress (Fig. 4). In the present study, several SmDof genes (eg. SmDof12 and SmDof29) were found to contain ABA-responsive elements (ACGTG) in putative promoter regions. Through the transcriptome dataset together with gene expression validation detected by qRT-PCR, it was confirmed that SmDof12 and 29 expressed vigorously in S. miltiorrhiza root (Fig. 5b; Fig. 7a, b). Furthermore, SmDof12 and 29 were verified to co-express with the metabolic pathway genes involved in tanshinones or phenolic acids biosynthesis (Fig. 6). This pushes the exploration of the underlying molecular mechanism of how SmDof12 and 29 to regulate the expression of the downstream target gene to modulate the tanshinones and phenolic acids biosynthesis. Subsequently, SmGGPPS and SmPAL were validated to be the target of SmDof12 and SmDof29 by Dual-LUC assay, respectively (Fig. 7d). Through the same strategy, in Scutellariae baicalensis, it is verified that SbNAC25 reduces the synthesis of flavonoid by downregulating the expression of FNSII-2, OMT2, CHI, and F6H2 genes[56]. The fact that the gene expression profile in special tissues and under certain stress treatment detected by transcriptome sequencing and qRT-PCR validation in combination with gene co-expression analysis is a quite valid strategy to mine the candidate regulatory genes and their downstream target genes involved in the biosynthetic pathway of secondary metabolite in many plants[57,58].

    In the present study, the SmDof gene families in S. miltiorrhiza were characterized based on the whole genome, transcriptome dataset, and qRT-PCR expression analysis. Two SmDof genes (SmDof12 and SmDof29) were mined by gene co-expression strategy from the identified 31 SmDofs, and their target genes of SmDof12 and SmDof29 were validated by Dual-LUC experiments. This study is the first comprehensive analysis of the SmDof gene families in S. miltiorrhiza, and provides valid data for further exploring the underlying molecular mechanism of SmDofs in response to ABA induction. It may also be beneficial to elucidate the diverse biological functions of Dof genes in other plants.

  • The authors confirm contribution to the paper as follows: study conception and supervision: Zhou W, Kai G, Zhu J; study design: Wang X, Wang Q, Hao S; experiment performance and data analysis: Wang X, Wang Q, Hao S; manuscript suggestions: Wang X, Zhou W; draft manuscript preparation: Wang X, Zhou W. All authors reviewed the results and approved the final version of the manuscript.

  • All data generated or analyzed during this study are included in this published article and its supplementary information files.

  • This work was supported by National Natural Science Foundation of China (82373979), Key Scientific and Technological Grant of Zhejiang for Breeding New Agricultural Vareties (2021C02074-3), WenZhou Key Scientific and Technological Innovation Project (ZN2022006) and Zhejiang Provincial Natural Science Foundation of China (LZ24H280002). We appreciate the great experimental support from the Public Platform of Medical Research Center, Academy of Chinese Medical Science, Zhejiang Chinese Medical University.

  • The authors declare that they have no conflict of interest.

  • Supplemental Fig. S1 Synthetic route of amino group-capped MNPs (a) and boronic acid-modified MNPs (b).
    Supplemental Fig. S2 Representative ζ potential distribution curves of MNPs@B(OH)2 (a), PPS-extracted MNPs@B(OH)2 (b), and TPS-bound MNPs@B(OH)2 (c); The quantitative comparison of their ζ potentials (d).
    Supplemental Fig. S3 UV-vis spectra of polysaccharides with different concentrations (a, c, e) measured after phenol-sulfuric acid chromogenesis, and the standard curves fitted by the relationship between absorbance and polysaccharides concentrations (b, d, f). The details for linear regression equation and related working parameters were listed in Table S1.
    Supplemental Fig. S4 Digital photos of standard polysaccharide samples (1, 2) and freeze-dried extractives (3, 4) of TPS (1, 3) and LBPS (2, 4) by MNPs@B(OH)2.
    Supplemental Fig. S5 HPLC chromatograms (a, c) of polysaccharides with different concentrations, and the standard curves (b, d) obtained by the relationship between peak area and polysaccharides concentrations. (a, b): LBPS; (c, d): TPS. Linear equations, their working parameters along with the tested purities of polysaccharides were given in Table S2.
    Supplemental Fig. S6 FT-IR spectra of polysaccharide extractives (blue) and standard polysaccharide samples (red). (a) TPS; (b) LBPS.
    Supplemental Fig. S7 Chromatograms of several monosaccharides and the hydrolysates of LBPS and TPS after labelling by PMP. (b) Partial enlargement of chromatographic curves for peak 2 in (a). Peaks identification for LBPS and TPS: (1, 3) xylose (Xyl); (2, 6) arabinose (Ara); (4) mannose (Man) and Ara; (5) glucose (Glc); (7) galactose (Gal).
    Supplemental Fig. S8 UV-vis spectra of TPS (a) and LBPS (b) extractives from tea leaves and Lycium barbarum by MNPs@B(OH)2 with different doages; The extraction capacity of TPS and LBPS as a function of MNPs@B(OH)2 usage (c); Digital photos of TPS (top) and LBPS (bottom) extractives recorded after color development by phenol-sulfuric acid method with a decreased dosage of MNPs@B(OH)2 sorbents from left to right (d), which corresponding to the amounts used in (a-c). Linear equations in (c) were, respectively, y=0.0056x+0.4535, R2= 0.9392 (TPS) and y=0.0073x+0.2953, R2= 0.9294 (LBPS), both with a dosage gradient of MNPs@B(OH)2 ranged from 10 to 150 mg.
    Supplemental Fig. S9 Reusability of MNPs@B(OH)2 for polysaccharide extraction. UV-vis spectra of TPS extractives obtained by continuous extraction for ten times (a) and the fluctuation of relative binding capacity of MNPs@B(OH)2 after ten consecutive extractions (b). Inset in (b) was the chromogenic photos of TPS extractives obtained by ten extractions. UV-vis spectra and digital photos were produced with the help of color development by phenyl-sulfuric acid method.
    Supplemental Fig. S10 Optical microscopic imaging of A549 cells before and after treating with polysaccharide extractives. Treatments in (a-f): control group (a), trypan blue stained control group (b), LBPS treated group (c), trypan blue stained LBPS treated group (d), TPS treated group (e), and trypan blue stained TPS treated group (f). The concentration of polysaccharide extractives for cell treatment was set as 5.0 mg/mL.
    Supplemental Table S1 Linear regression equations, relevant running parameters along with the tested relative purities (the purities of standard polysaccharides were used as references) of polysaccharides by UV-vis spectrometry.
    Supplemental Table S2 Linear regression equations, their working parameters and the measured relative purities (the purities of standard polysaccharides were used as references) of polysaccharides by HPLC.
  • [1]

    Xie L, Shen M, Wang Z, Xie J. 2021. Structure, function and food applications of carboxymethylated polysaccharides: a comprehensive review. Trends in Food Science & Technology 118:539−57

    doi: 10.1016/j.jpgs.2021.09.016

    CrossRef   Google Scholar

    [2]

    Masci A, Carradori S, Casadei M A, Paolicelli P, Petralito S, et al. 2018. Lycium barbarum polysaccharides: Extraction, purification, structural characterisation and evidence about hypoglycaemic and hypolipidaemic effects. A review. Food Chemistry 254:377−89

    doi: 10.1016/j.foodchem.2018.01.176

    CrossRef   Google Scholar

    [3]

    Huang Y, Chen H, Zhang K, Lu Y, Wu Q, et al. 2022. Extraction, purification, structural characterization, and gut microbiota relationship of polysaccharides: a review. International Journal of Biological Macromolecules 213:967−86

    doi: 10.1016/j.ijbiomac.2022.06.049

    CrossRef   Google Scholar

    [4]

    Wang S, Li W, Sun P, Xu Z, Ding Y, et al. 2020. Selective extraction of myoglobin from human serum with antibody-biomimetic magnetic nanoparticles. Talanta 219:121327

    doi: 10.1016/j.talanta.2020.121327

    CrossRef   Google Scholar

    [5]

    Bie Z, Chen Y, Ye J, Wang S, Liu Z. 2015. Boronate-affinity glycan-oriented surface imprinting: a new strategy to mimic lectins for the recognition of an intact glycoprotein and its characteristic fragments. Angewandte Chemie International Edition 54:10211−15

    doi: 10.1002/anie.201503066

    CrossRef   Google Scholar

    [6]

    Wang X, Li G, Row KH. 2017. Magnetic graphene oxide modified by imidazole-based ionic liquids for the magnetic-based solid-phase extraction of polysaccharides from brown alga. Journal of Separation Science 40:3301−10

    doi: 10.1002/jssc.201700393

    CrossRef   Google Scholar

    [7]

    Liu Z, He H. 2017. Synthesis and applications of boronate affinity materials: from class selectivity to biomimetic specificity. Accounts of Chemical Research 50:2185−93

    doi: 10.1021/acs.accounts.7b00179

    CrossRef   Google Scholar

    [8]

    Li D, Chen Y, Liu Z. 2015. Boronate affinity materials for separation and molecular recognition: structure, properties and applications. Chemical Society Reviews 44:8097−123

    doi: 10.1039/C5CS00013K

    CrossRef   Google Scholar

    [9]

    Chen Y, Huang A, Zhang Y, Bie Z. 2019. Recent advances of boronate affinity materials in sample preparation. Analytica Chimica Acta 1076:1−17

    doi: 10.1016/j.aca.2019.04.050

    CrossRef   Google Scholar

    [10]

    Wang S, Ye J, Bie Z, Liu Z. 2014. Affinity-tunable specific recognition of glycoproteins via boronate affinity-based controllable oriented surface imprinting. Chemical Science 5:1135−40

    doi: 10.1039/c3sc52986j

    CrossRef   Google Scholar

    [11]

    Wang S, Ye J, Li X, Liu Z. 2016. Boronate affinity fluorescent nanoparticles for Förster resonance energy transfer inhibition assay of cis-diol biomolecules. Analytical Chemistry 88:5088−96

    doi: 10.1021/acs.analchem.5b04507

    CrossRef   Google Scholar

    [12]

    Fan Y, Zhou X, Huang G. 2022. Preparation, structure, and properties of tea polysaccharide. Chemical Biology & Drug Design 99:75−82

    doi: 10.1111/cbdd.13924

    CrossRef   Google Scholar

    [13]

    Pan X, Chen Y, Zhao P, Li D, Liu Z. 2015. Highly efficient solid-phase labeling of saccharides within boronic acid functionalized mesoporous silica nanoparticles. Angewandte Chemie International Edition 54:6173−76

    doi: 10.1002/anie.201500331

    CrossRef   Google Scholar

    [14]

    Wang W, Chen F, Wang Y, Wang L, Fu H, et al. 2018. Optimization of reactions between reducing sugars and 1-phenyl-3-methyl-5-pyrazolone (PMP) by response surface methodology. Food Chemistry 254:158−64

    doi: 10.1016/j.foodchem.2018.02.001

    CrossRef   Google Scholar

    [15]

    Yang X, Wei S, Lu X, Qiao X, Simal-Gandara J, et al. 2021. A neutral polysaccharide with a triple helix structure from ginger: characterization and immunomodulatory activity. Food Chemistry 350:129261

    doi: 10.1016/j.foodchem.2021.129261

    CrossRef   Google Scholar

    [16]

    Wang S, He Z, Li W, Zhao J, Chen T, et al. 2020. Reshaping of pipette tip: a facile and practical strategy for sorbent packing-free solid phase extraction. Analytica Chimica Acta 1100:47−56

    doi: 10.1016/j.aca.2019.11.060

    CrossRef   Google Scholar

    [17]

    Wang S, Li W, Yuan Z, Jin Q, Ding Z, et al. 2022. Semiquantitative naked-eye detection of synthetic food colorants using highly-branched pipette tip as an all-in-one device. Analytica Chimica Acta 1211:339901

    doi: 10.1016/j.aca.2022.339901

    CrossRef   Google Scholar

    [18]

    Wang H, Bie Z, Lü C, Liu Z. 2013. Magnetic nanoparticles with dendrimer-assisted boronate avidity for the selective enrichment of trace glycoproteins. Chemical Science 4:4298−303

    doi: 10.1039/c3sc51623g

    CrossRef   Google Scholar

    [19]

    Wang S, Wen Y, Wang Y, Ma Y, Liu Z. 2017. Pattern recognition of cells via multiplexed imaging with monosaccharide-imprinted quantum dots. Analytical Chemistry 89:5646−52

    doi: 10.1021/acs.analchem.7b00965

    CrossRef   Google Scholar

    [20]

    Ye J, Chen Y, Liu Z. 2014. A boronate affinity sandwich assay: an appealing alternative to immunoassays for the determination of glycoproteins. Angewandte Chemie International Edition 53:10386−89

    doi: 10.1002/anie.201405525

    CrossRef   Google Scholar

    [21]

    Bi X, Liu Z. 2014. Enzyme activity assay of glycoprotein enzymes based on a boronate affinity molecularly imprinted 96-well microplate. Analytical Chemistry 86:12382−89

    doi: 10.1021/ac503778w

    CrossRef   Google Scholar

    [22]

    Lü C, Li H, Wang H, Liu Z. 2013. Probing the interactions between boronic acids and cis-diol-containing biomolecules by affinity capillary electrophoresis. Analytical Chemistry 85:2361−69

    doi: 10.1021/ac3033917

    CrossRef   Google Scholar

    [23]

    Otsuka H, Uchimura E, Koshino H, Okano T, Kataoka K. 2003. Anomalous binding profile of phenylboronic acid with N-acetylneuraminic acid (Neu5Ac) in aqueous solution with varying pH. Journal of the American Chemical Society 125:3493−502

    doi: 10.1021/ja021303r

    CrossRef   Google Scholar

    [24]

    Djanashvili K, Frullano L, Peters JA. 2005. Molecular recognition of sialic acid end groups by phenylboronates. Chemistry – A European Journal 11:4010−18

    doi: 10.1002/chem.200401335

    CrossRef   Google Scholar

    [25]

    Wang S, Wang H, Yuan Z, Li M, Gao H, et al. 2022. Colorimetry combined with inner filter effect-based fluorometry: a versatile and robust strategy for multimode visualization of food dyes. ACS Applied Materials & Interfaces 14:57251−64

    doi: 10.1021/acsami.2c17679

    CrossRef   Google Scholar

    [26]

    Wang S, Zhang L, Jin Q, Xu Z, Zhao J, et al. 2022. Filter paper-based colorimetric analysis: an instrument-free strategy for semiquantitative naked-eye detection of food colorants. Food Chemistry 390:133087

    doi: 10.1016/j.foodchem.2022.133087

    CrossRef   Google Scholar

    [27]

    Wang S, Wang H, Ding Y, Li W, Gao H, et al. 2022. Filter paper- and smartphone-based point-of-care tests for rapid and reliable detection of artificial food colorants. Microchemical Journal 183:108088

    doi: 10.1016/j.microc.2022.108088

    CrossRef   Google Scholar

    [28]

    Chen G, Yuan Q, Saeeduddin M, Ou S, Zeng X, et al. 2016. Recent advances in tea polysaccharides: extraction, purification, physicochemical characterization and bioactivities. Carbohydrate Polymers 153:663−78

    doi: 10.1016/j.carbpol.2016.08.022

    CrossRef   Google Scholar

    [29]

    Sknepnek A, Tomić S, Miletić D, Lević S, Čolić M, et al. 2021. Fermentation characteristics of novel Coriolus versicolor and Lentinus edodes kombucha beverages and immunomodulatory potential of their polysaccharide extracts. Food Chemistry 342:128344

    doi: 10.1016/j.foodchem.2020.128344

    CrossRef   Google Scholar

    [30]

    Castillo JJ, Galermo AG, Amicucci MJ, Nandita E, Couture G, et al. 2021. A multidimensional mass spectrometry-based workflow for de novo structural elucidation of oligosaccharides from polysaccharides. Journal of the American Society for Mass Spectrometry 32:2175−85

    doi: 10.1021/jasms.1c00133

    CrossRef   Google Scholar

    [31]

    Chen L, Long R, Huang G, Huang H. 2020. Extraction and antioxidant activities in vivo of pumpkin polysaccharide. Industrial Crops & Products 146:112199

    doi: 10.1016/j.indcrop.2020.112199

    CrossRef   Google Scholar

    [32]

    Lv Y, Yang X, Zhao Y, Ruan Y, Yang Y, et al. 2009. Separation and quantification of component monosaccharides of the tea polysaccharides from Gynostemma pentaphyllum by HPLC with indirect UV detection. Food Chemistry 112:742−46

    doi: 10.1016/j.foodchem.2008.06.042

    CrossRef   Google Scholar

    [33]

    Wang B, Han L, Liu J, Zhang J, Wang W, et al. 2022. Lycium genus polysaccharide: an overview of its extraction, structures, pharmacological activities and biological applications. Separations 9:197

    doi: 10.3390/separations9080197

    CrossRef   Google Scholar

    [34]

    Wang L, Bao J, Wang L, Zhang F, Li Y. 2006. One-pot synthesis and bioapplication of amine-functionalized magnetite nanoparticles and hollow nanospheres. Chemistry – A European Journal 12:6341−47

    doi: 10.1002/chem.200501334

    CrossRef   Google Scholar

    [35]

    Yang Y, Zhao M, Liu Y, Fang Z, Li Q, et al. 2022. Separation and identification of an abundant trigalloylglucose from special tea genetic resources. Beverage Plant Research 2:11

    doi: 10.48130/BPR-2022-0011

    CrossRef   Google Scholar

    [36]

    Yan T, Tao Y, Wang X, Lv C, Miao G, et al. 2021. Preparation, characterization and evaluation of the antioxidant capacity and antitumor activity of myricetin microparticles formated by supercritical antisolvent technology. The Journal of Supercritical Fluids 175:105290

    doi: 10.1016/j.supflu.2021.105290

    CrossRef   Google Scholar

    [37]

    Yan T, Wang H, Song X, Yan T, Ding Y, et al. 2022. Fabrication of apigenin nanoparticles using antisolvent crystallization technology: a comparison of supercritical antisolvent, ultrasonic-assisted liquid antisolvent, and high-pressure homogenization technologies. International Journal of Pharmaceutics 624:121981

    doi: 10.1016/j.ijpharm.2022.121981

    CrossRef   Google Scholar

    [38]

    Zhao Z, Huangfu L, Dong L, Liu S. 2014. Functional groups and antioxidant activities of polysaccharides from five categories of tea. Industrial Crops and Products 58:31−35

    doi: 10.1016/j.indcrop.2014.04.004

    CrossRef   Google Scholar

    [39]

    Wang S, Ding Y, Wang H, Li W, Xu W, et al. 2022. Molecularly imprinted upconversion nanoparticles for active tumor targeting and microinvasive photothermal therapy. Journal of Materials Science 57:5177−97

    doi: 10.1007/s10853-022-06965-8

    CrossRef   Google Scholar

    [40]

    Zhou Y, Zhou X, Hong T, Qi W, Zhang K, et al. 2021. Lysosome-mediated mitochondrial apoptosis induced by tea polysaccharides promotes colon cancer cell death. Food & Function 12:10524−37

    doi: 10.1039/d1fo00987g

    CrossRef   Google Scholar

    [41]

    Zhang X, Yu H, Cai Y, Ke M. 2017. Lycium barbarum polysaccharides inhibit proliferation and migration of bladder cancer cell lines BIU87 by suppressing Pi3K/AKT pathway. Oncotarget 8:5936−42

    doi: 10.18632/oncotarget.13963

    CrossRef   Google Scholar

    [42]

    Liu X, Liu F, Zhao S, Guo B, Ling P, et al. 2019. Purification of an acidic polysaccharide from Suaeda salsa plant and its anti-tumor activity by activating mitochondrial pathway in MCF-7 cells. Carbohydrate Polymers 215:99−107

    doi: 10.1016/j.carbpol.2019.03.059

    CrossRef   Google Scholar

    [43]

    Cheng L, Chen L, Yang Q, Wang Y, Wei X. 2018. Antitumor activity of Se-containing tea polysaccharides against sarcoma 180 and comparison with regular tea polysaccharides and Se-yeast. International Journal of Biological Macromolecules 120:853−58

    doi: 10.1016/j.ijbiomac.2018.08.154

    CrossRef   Google Scholar

  • Cite this article

    Ding Y, Li H, Liu T, Liu Y, Yan M, et al. 2023. Boronate affinity-mediated magnetic solid phase extraction and bioactivities of polysaccharides from beverage plants. Beverage Plant Research 3:14 doi: 10.48130/BPR-2023-0014
    Ding Y, Li H, Liu T, Liu Y, Yan M, et al. 2023. Boronate affinity-mediated magnetic solid phase extraction and bioactivities of polysaccharides from beverage plants. Beverage Plant Research 3:14 doi: 10.48130/BPR-2023-0014

Figures(7)

Article Metrics

Article views(4555) PDF downloads(392)

ARTICLE   Open Access    

Boronate affinity-mediated magnetic solid phase extraction and bioactivities of polysaccharides from beverage plants

Beverage Plant Research  3 Article number: 14  (2023)  |  Cite this article

Abstract: Polysaccharides are of great significance in food production, but their isolation highly relies on multi-staged liquid-liquid extraction. In this study, a boronate affinity-mediated magnetic solid phase extraction (BA-MSPE) method was initiated for the effortless and efficient extraction of polysaccharides using boronic acid-grafted magnetic nanospheres (MNPs@B(OH)2) as extractants. MNPs@B(OH)2 showed fine class selectivity toward cis-diol containing compounds at weak alkaline condition (pH 7.5~8.5) and higher binding capacity than that of MNPs without boronic acid functionalization. Fast binding dynamics with a binding equilibrium within 10 min, stronger affinity toward polysaccharides (Kd as low as 10−3~10−6 M level) than that of small molecular cis-diol compounds (Kd in the range of 10−1~10−4 M level), and good recyclability (the binding capacity decreased less than 13% after ten times consecutive extraction) could also be observed for MNPs@B(OH)2. Finally, the BA-MSPE of polysaccharides was performed with three beverage plants as real samples, including tea leaves, soybeans, and Lycium barbarum. Antioxidant activity of polysaccharide extractives was verified by DPPH radical scavenging assays, giving a radical scavenging rate of 31.4% and 18.8% for crude extractives of TPS (tea polysaccharide) and LBPS (Lycium barbarum polysaccharide), respectively. Microscopic imaging combining with MTT and trypan blue staining trials uncovered that the extractives were of dosage-dependent antitumor bioactivities, giving the cell mortality rates over 91.8% and 77.2% for MCF-7 and A549 cells in the presence of 5.0 mg/mL TPS, and 56.6% and 40.0% with the equal dosage of LBPS, respectively. As the BA-MSPE strategy is simple and eco-friendly, there will be more potential for the application of cis-diol compound purification.

    • Polysaccharides are heavily used in foods, cosmetics and preventive medicines due to their various bioactivities and low side effects[1]. To purify polysaccharides with high yield, a high number of strategies have been reported[2,3], including size exclusion chromatography, ultrafiltration, dialysis, water extraction combined with ethanol precipitation, machine-assisted extraction, and enzymolysis approaches, etc. In spite of this, time-consuming separation and impurity removal steps are often essential for these methods. Simple and efficient strategies for polysaccharide extraction are still scarce, but highly desired.

      Magnetic solid phase extraction (MSPE) has been proven to be a powerful tool for separation and purification related applications[46], in which the magnetic nanoparticles are applied as sorbents, then the extraction and elution processes can be easily completed by external magnetic field while, without extra instrument-assisted separation operations such as centrifugation and ultrafiltration, and high pressure required in traditional SPE column or cartridge can also be avoided. Large specific surface area of magnetic nanospheres (MNPs) enables MSPE to obtain high extraction capacity, and the vast majority of MNPs can be easily recycled by external magnets. As a result, the operations for separation can be significantly simplified, the extraction efficiency can be improved, and the cost can be also reduced. Admittedly, MSPE provides a promising pathway for polysaccharide purification, but such an idea is still in its infancy.

      Boronate affinity effect[79] is a reversible covalent binding between 1,2- and 1,3-cis-diol containing compounds and boronic acid moieties, of which the covalent five- or six-membered cyclic boronate ester can be formed at a basic pH condition while the bound cis-diol compounds can be reversibly released when the system pH changes to acidic. Thanks to such an unique pH-adjustable binding, boronate affinity effect has been widely used for affinity separation[10] and chemical sensing[11] of cis-diol compounds. Under such a background, a boronate affinity-mediated MSPE (BA-MSPE) strategy was pioneered herein for the easy isolation of polysaccharides. The schematic for this protocol is illustrated in Fig. 1 using the possible structure of tea polysaccharide (TPS) as a representative[12], in which boronic acid-functionalized MNPs were served as sorbents. Because the abundant 1,2- and 1,3-cis-diol structures in backbone and/or branch carbohydrate chains were their universal hallmarks, polysaccharides would be extracted under weak alkaline condition by multisite binding-based positive synergistic boronate affinity effect, and then the extractives could be reversibly released after altering the system pH to acidic. By such a simple process, three polysaccharides, including TPS, Lycium barbarum polysaccharide (LBPS) and soybean polysaccharide (SPS), were effectively isolated from relevant real beverage plants, and their antioxidant and antitumor bioactivities were also demonstrated.
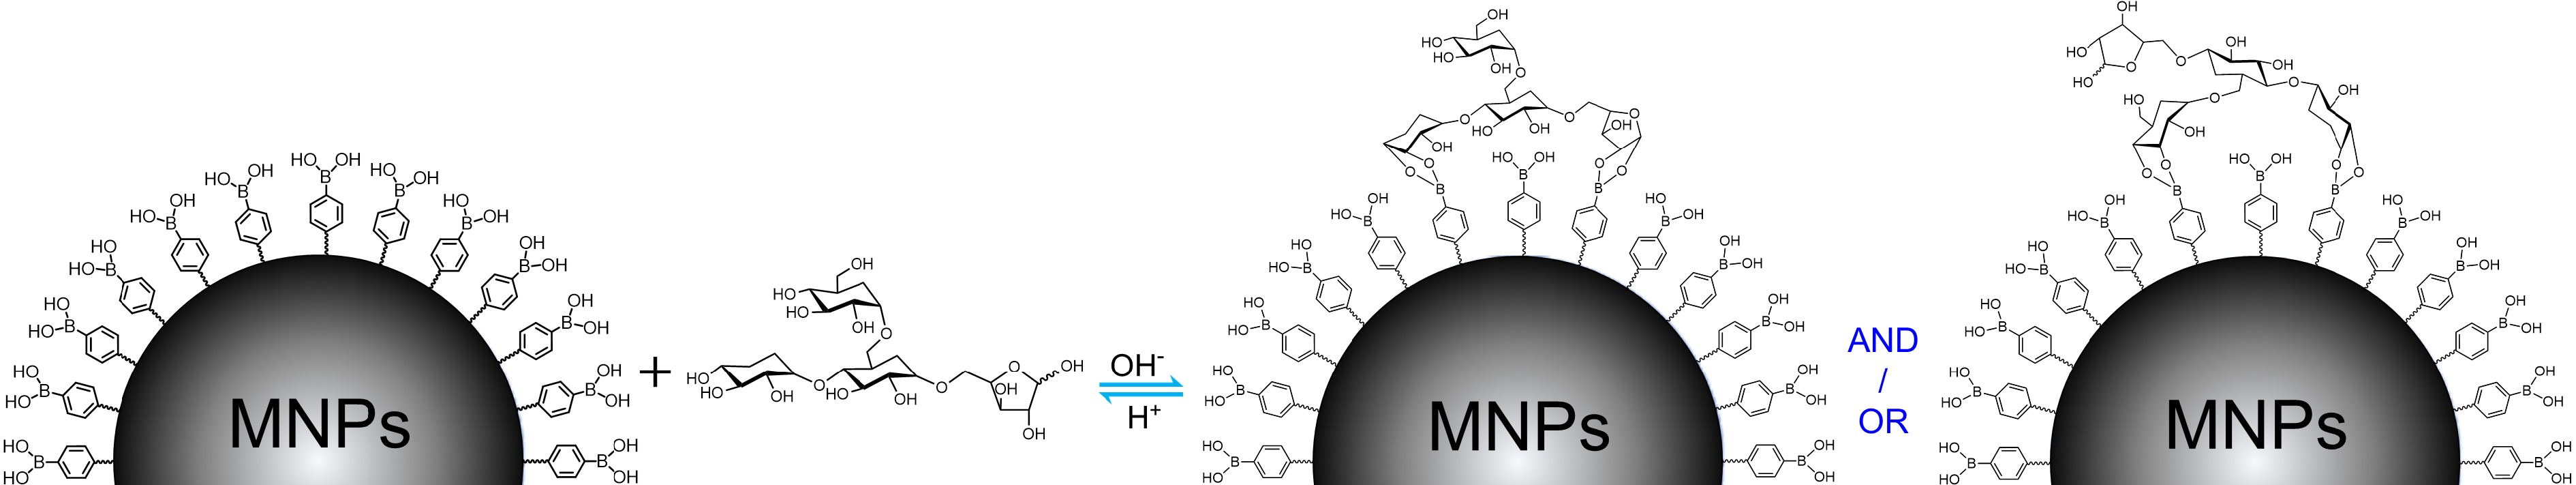
      Figure 1. 

      The general binding mechanism for polysaccharide extraction by boronic acid-decorated MNPs using possible chemical structure of TPS as a representative.

    • Acetic acid (HAc, 99.5%), KH2PO4 (99.5%), NaH2PO4 (99.9%), Na3PO4, H3PO4, NaOH, chloroform (≥ 99%) and FeCl3•6H2O (99%) were purchased from Sinopharm Chemical Reagent Co., Ltd. (Shanghai, China). Ethylene glycol (> 99%), sulfuric acid (96%), 3-methyl-1-phenyl-2-pyrazoline-5-one (PMP, 99%), 4-formylphenylboronic acid (FPBA, 98%), methanol (99.5%), 1,6-hexamethylenediamine (99%) and anhydrous sodium acetate (99.5%) were purchased from Titan Scientific Co., Ltd. (Shanghai, China). 2,2-Diphenyl-1-picrylhydrazyl (DPPH, 98.5%), thiazoyl blue tetrazolium bromide (MTT, > 99%), HPLC-grade acetonitrile (ACN), trifluoroacetic acid (TFA, 99%), anhydrous ethanol and phenol were obtained from Macklin Biochemical Co., Ltd. (Shanghai, China). Pullulan polysaccharide (PPS, 99%), tea polysaccharide (TPS, 50%), soybean polysaccharide (SPS, 70%), Lycium barbarum polysaccharide (LBPS, ≥ 50%), trypan blue (60%) and deoxyguanosine (99%) were from Yuanye Bio-Technology (Shanghai, China). NaBH3CN (95%), guanosine (99%), adenosine (99%), deoxyadenosine (99%) and cytidine (99%) were from Aladdin Bio-Chem Technology Co., Ltd. (Shanghai, China). Human breast cancer cell line (MCF-7), human lung carcinoma cell line (A549), Roswell Park Memorial Institute 1640 medium (RPMI-1640, containing 2.0 mg/mL D-glucose, 0.3 mg/mL glutamine, 2.0 mg/mL NaHCO3, 80 U/mL penicillin, and 0.08 mg/mL streptomycin), Dulbecco’s Modified Eagle Medium (DMEM, containing 4.5 mg/mL D-glucose, 0.3 mg/mL glutamine, 0.11 mg/mL sodium pyruvate, and penicillin streptomycin), parenzyme cell digestion solution (containing 0.25% trypsin and 0.02% EDTA), and phosphate buffer solution for cell culture (PBS) were purchased from Keygen Biotech (Nanjing, China). Fetal bovine serum (FBS) was purchased from Gibco (Life Technologies, Australia). Cell culture bottles (25 cm2 in growth area) and glass bottom cell culture dishes (Φ 30 mm) used for cell culture and microimaging were obtained from NEST Biotechnology (Wuxi, China). Real-world beverage plants, including Lycium barbarum, tea leaves (green tea) and soybeans, were purchased from a local supermarket. Water used in this study was produced by a Milli-Q system (Millipore, Milford, MA, USA). Except as otherwise noted, the purity grades of all chemicals without specific stipulations were analytically pure and phosphate buffer (PB) solutions used in this work was especially referred to the 0.1 M, pH 8.5 phosphate buffer.

    • MNPs@B(OH)2 were prepared referring to our previous reports[4,5] with slight modifications, in which the preparation of amino group-capped MNPs (bare MNPs) and then their post-modification with FPBA were contained. To synthesize bare MNPs, 480 mL ethylene glycol, 16.0 g FeCl3 and 32.0 g anhydrous sodium acetate were mixed, then the mixture was slowly heated to 55 °C and kept vigorously stirring until the solution became transparent, followed by adding with 104.0 g 1,6-hexamethylenediamine and mixing evenly. After that, the resulting solution was transferred into a polytetra-fluoroethylene autoclave reactor and kept under reaction for 10 h at 198 °C. Finally, the prepared bare MNPs were magnetically separated and washed three times with ethanol and water, then the obtained MNPs were dried in a vacuum oven at 55 °C and stored in an air tight container.

      For the boronic acid functionalization, 2.0 g the above prepared MNPs were dispersed into 100 mL absolute ethanol containing 5.0 mg/mL FPBA and 1.0 mg/mL NaBH3CN. After ultrasound for 30 min, the mixed solution was mechanically agitated at 40 °C for 12 h. When the reaction finished, the MNPs@B(OH)2 were magnetically isolated and respectively rinsed three times with ethanol and water, and then harvested after drying at 55 °C and stored under air tight conditions for upcoming assays.

    • Deoxyguanosine, deoxyadenosine, cytidine, guanosine and adenosine were served as model compounds to investigate the binding selectivity of MNPs@B(OH)2. Briefly, 8 mL aliquots of PB containing 1.0 mg/mL model analytes were supplemented with 35.0 mg MNPs@B(OH)2 or bare MNPs, after fully dispersing by ultrasonic, the resulting mixture solutions were incubated at room temperature for 0.5 h. Then the analyte-extracted MNPs@B(OH)2 or bare MNPs were magnetically separated and redispersed into 1.0 mL desorption solution composed by 0.1 M acetic acid. After desorption for 2 h, the materials were removed by external magnet while the supernatants were collected individually, and their UV-vis absorption spectra were tested on a UV-1800PC spectrophotometer (Mapada Instruments, Shanghai, China). The equilibrium binding capacity of MNPs@B(OH)2 and bare MNPs was figured out with standard curve method, which measured by UV-vis spectrometry and plotted by licensed OriginPro 2016 software. The wavelengths used for plotting standard curves of adenosine, guanosine, cytidine, deoxyadenosine and deoxyguanosine were, respectively, set at 258, 252, 278, 258 and 258 nm.

      For the investigation of adsorption dynamics, guanosine, a cis-diol containing compound which can form boronate affinity effect with MNPs@B(OH)2, was selected as a target analyte. The steps were as follows: 35.0 mg MNPs@B(OH)2 was fully dispersed into 5 mL PB containing 0.1 mg/mL guanosine by vortex and ultrasonic. After incubation at room temperature for the appropriate time (0, 5, 10, 15, 20, 30 and 50 min), 200 μL aliquots of this mixture solution were taken out and the supernatants were individually collected after discarding the materials by external magnetic field. Finally, the absorbance of supernatants was measured on a spectrophotometer. The binding dynamics were plotted according to the relationship between the absorbance of supernatants and extraction time.

    • To probe the effect of pH on the extraction performance of MNPs@B(OH)2, the main operations were the same as above except that the consumption of MNPs@B(OH)2 was 10 mg and the solvents used for the preparation of guanosine solutions were replaced by PB with pH ranging from 2.5 to 12.5 with intervals of one pH unit. The absorbance of desorption solutions was tested and the extraction amounts of MNPs@B(OH)2 at binding equilibrium were calculated using the standard curve method. This assay was repeated in triplicate and the data were averaged for plotting. The relationship between equilibrium extraction amounts and system pH was applied to assess the impact of pH on BA-MSPE.

    • Since the direct spectrometric measurement of polysaccharides was difficult due to their poor UV-vis light absorption properties, color development by phenol-sulfuric acid method was utilized for spectral tests of polysaccharides. With the help of phenol-sulfuric acid chromogenic reaction, standard curves of polysaccharides were tested by UV-vis spectrometry as follows: polysaccharide stock solutions with certain concentration gradients (0.75, 0.5, 0.25, 0.1, 0.05 and 0.005 mg/mL for TPS; 1.0, 0.75, 0.5, 0.25, 0.1, 0.05 and 0.01 mg/mL for PPS; 0.5, 0.4, 0.3, 0.2, 0.1 and 0.075 mg/mL for LBPS; 1.0, 0.75, 0.5, 0.25, 0.1, 0.05 and 0.01 mg/mL for SPS) were prepared at first using 0.1 M HAc aqueous solutions as solvents, then phenol solution (5%, wt%), sulfuric acid and the prepared polysaccharide solutions were mixed in volume ratio of 1:5:1, followed by incubating at 55 °C for 10 min. Thereafter, the digital photos of all solutions were recorded using a smartphone (Vivo X80, Guangdong, China) and their UV-vis spectra were determined on a UV-vis spectrophotometer. Standard curves were plotted by absorbance at 488 nm against polysaccharide concentrations, and the extraction amounts of polysaccharides by MNPs and MNPs@B(OH)2 were inferred from linear regression equations for quantitative comparison. All data were obtained by three tests in parallel for quantifications.

      Regarding adsorption isotherms, the details were as follows: A series of TPS stock solutions with a concentration gradient of 0.05, 0.1, 0.5, 1.0, 2.0, 4.0, 6.0, 10.0, 20.0 and 50.0 mg/mL were prepared using PB as solvents, then to each an aliquot of 40.0 mg MNPs@B(OH)2 was added, followed by incubation for 2 h at room temperature. After removing the solvents by magnetic separation, the resulting materials were washed three times with PB, and then supplemented with 1.0 mL aliquots of desorption solution composed of 0.1 M HAc aqueous solutions. After desorption for 2 h, the supernatants were collected via magnetic isolation and their absorbance was measured after color development by phenol-sulfuric acid method. The binding isotherms were obtained through the extraction amounts deduced by the absorbance at 488 nm plotting against TPS concentrations. The Hill equation given below was applied to fit data and estimate the binding properties of MNPs@B(OH)2.

      y=Qmaxxn/(xn+Knd)

      Herein, n was the Hill slope while Qmax and Kd were, respectively, the maximum binding capacity and dissociation constant.

      As for the dosage-dependent extraction experiments, the main operations were the same as above except that the dosages of MNPs@B(OH)2 were set as 5, 10, 25, 50, 75, 100 and 150 mg using TPS and LBPS as model analytes both with a concentration of 1.0 mg/mL (dissolved in PB).

    • Three beverage plants, including tea leaves (green tea), soybeans, and Lycium barbarum, were devoted as real samples to extract polysaccharides. Three steps, i.e., the pretreatments of raw materials, the preparation of leaching liquors of crude polysaccharides, and subsequent BA-MSPE, were contained in this experiment.

      For the pretreatments of raw materials, the above-mentioned three beverage plants were washed with water several times to remove impurities, followed by drying to a constant weight at 55 °C in an electric oven. Then the powders of raw materials were obtained by quickly crushing in a high speed pulverizer.

      To prepare the leaching liquors of crude polysaccharides, the above obtained raw material powders were immersed into PB with a material-to-liquid ratio of 1:50 (1.0 g powder per 50 mL PB). After incubation for 2 h at 60 °C, the leaching liquors and solid matters were centrifugally separated (5000 rpm for 10 min) and individually collected, then the solids were immersed into PB again with the same feed ratio and incubation for another 2 h at 80 °C. After further centrifugal separation, the supernatants were collected and gathered with the filtrates of the previous separation. The total leaching liquors were centrifuged again (10,000 rpm for 5 min) and stored at 4 °C after discarding the precipitation.

      BA-MSPE were carried out as follows: 4.0 mL aliquots of freshly prepared leaching liquors were respectively added with 100 mg MNPs or MNPs@B(OH)2, followed by incubating for 0.5 h at room temperature. After magnetic separation, the supernatants were removed and 0.1 M HAc aqueous solutions was supplemented into the polysaccharides-extracted materials with 1.0 mL for each. After desorption for 2 h, the desorption solutions were magnetically collected. After color development with phenol-sulfuric acid method, the UV-vis spectra were measured and their colors were simultaneously recorded. The desorption operations were repeated several times until the color of chromogenic solution was indistinguishable by naked eye. The extraction amounts were figured out and weighted according to standard curve method using the absorbance at 488 nm.

    • In order to survey the relative purities of polysaccharides extracted by MNPs@B(OH)2, the extractives from tea leaves and Lycium barbarum were freeze dried and corresponding standard polysaccharides were devoted as controls in this assay. The main steps for the BA-MSPE of TPS and LBPS were the same as above except that the dosages of leaching liquors and materials were enlarged. In detail, the volume of leaching liquors was set as 400 mL and the usage of MNPs@B(OH)2 was 2.0 g. Concentrations of extracted and standard polysaccharide samples for absorbance tests were set at 1.0 and 0.5 mg/mL, respectively. The relative purities of polysaccharides extracts were calculated by dividing the amount of polysaccharides obtained from extracts into that of standard polysaccharides.

    • Freeze-dried extracts of TPS and LBPS are denoted as model polysaccharides herein. Due to their poor light-absorbing properties, PMP-based pre-column derivatizations[13,14] of polysaccharides were essential for HPLC analysis. In detail, 100 μL methanol solution containing 0.5 M PMP was added with equal volume of 0.5 mg/mL polysaccharide solutions, followed by incubation at 70 °C for 2 h. When the labelling reaction was finished, 1.0 mL chloroform was added into the solution, then vortex for 1 min to extract the unreacted PMP reagents. After centrifuging for 1 min at 1000 rpm, the remaining PMP in the bottom layer was removed. Such a PMP separation operation was repeated three times and the resulting PMP-tagged polysaccharides were loaded for HPLC analysis. The standard polysaccharides labelled in the same way were used as benchmarks for qualitative identification and the determinations of HPLC standard curves.

      TFA-based hydrolysis was performed to identify the monosaccharide composites of polysaccharides by HPLC, and the details were as follows: polysaccharides were separately dissolved into 2.0 M TFA solution with a final concentration of 10.0 mg/mL, and then reacted in air tight conditions for 6 h at 105 °C. When the reaction completed, the supernatants were centrifugally collected and their pH was adjusted to neutral using 1.0 M NaOH solution. Subsequently, the PMP labelling of hydrolysates and standard monosaccharides was implemented as above. The resulting solutions were finally stored at 4 °C for use.

      HPLC conditions were selected referring to an existing method[15]: A Adamas C18-Classic column (SepaChrom S.R.L., 5 μm, 250 mm × 4.6 mm) was equipped for chromatographic separations; The mobile phase was composed by acetonitrile (A) and monopotassium phosphate aqueous solution with pH 6.8 (B) in an isocratic mode with 20% A; Injection volume was set as 20 μL; A pre-equilibration period of 30~60 min was applied between two consecutive separations; The flow rate and column temperature were, respectively, set as 1.0 mL/min and 40 °C, and the wavelength of 248 nm was selected for detection. All buffer and sample solutions were filtrated using a 0.45 μm filter membrane before running.

      HPLC standard curves were plotted in terms of the function between peak areas and the concentrations of standard polysaccharides derived by PMP. Briefly, PMP-marked TPS and LBPS stock solutions with concentration gradients of 1.0, 0.5, 0.4, 0.3, 0.2, 0.1, 0.05 and 0.01 mg/mL, and 0.3, 0.2, 0.1, 0.05, 0.01 and 0.005 mg/mL were prepared and their chromatographic retentions were surveyed with the aforementioned conditions. Each sample was tested in triplicate and the weighted peak area was used for plotting standard curves, then the concentrations of polysaccharides in extracts were deduced by linear regression equations.

    • The recyclability of MNPs@B(OH)2 was investigated by consecutive extraction and desorption 10 times. In detail, 80.0 mg MNPs@B(OH)2 was dispersed into 20 mL PB containing 3.0 mg/mL TPS, then incubation for 1 h at room temperature. After that, the materials were magnetically collected and washed with 5 mL PB for 5 min, followed by desorption for 0.5 h with 1 mL HAc aqueous solution (0.1 M). Finally, the supernatants were separately collected after magnetic isolation. After color development by phenyl-sulfuric acid method, their UV-vis spectra were tested and digital photos were recorded. Such an extraction-elution process was repeated for 10 cycles. A pre-equilibrium period of 1 h by PB (10 mL) was adopted for MNPs@B(OH)2 between two extractions.

    • Two aliquots of 1.0 mL ethanol solution containing 0.06 mg/mL DPPH were, respectively, mixed with 0.3 mL TPS and LBPS solution (dissolved in ethanol, and both with a concentration of 0.5 mg/mL). The DPPH solution combined with an equal volume of ethanol was used as the control group. After incubation in the dark for appropriate periods (0, 1, 3, 5, 10, 20, 30, 45 and 60 min), the digital photos were recorded using a smartphone and the UV-vis spectra were measured on a spectrophotometer. The radical scavenging activities of TPS and LBPS were evaluated by the following expression:

      Radicalscavengingacitivity(%)=(1ATAC)×100

      In which, AT and AC were, respectively, on behalf of the absorbance of polysaccharides-treated group and control group (without additives).

    • MCF-7 cell was cultured in RPMI-1640 medium supplemented with 10% fetal bovine serum at 37 °C in a humidified chamber containing 5% CO2. A549 and DU145 cells were cultured in DMEM medium with 10% fetal bovine serum at 37 °C in a humidified chamber containing 5% CO2. All the cell experiments were implemented when the confluence reached ~80%. MTT assays and trypan blue staining experiments were adopted to estimate cell viability and apoptosis, respectively.

      Details for MTT assay: The cells cultured in 96-well microplate were washed with 1 × PBS three times, followed by supplementing with relevant culture medium containing polysaccharide extracts with different concentrations ranging from 0 (control), 0.25, 1.0, 1.5, 2.5 to 5.0 mg/mL (200 μL per well). After culturing for another 24 h, the culture medium was removed and the remaining cells in microplate were cultured with PBS containing 5.0 mg/mL 3-(4,5-dimethylthiazol-2-yl)-2,5-diphenyltetrazolium bromide (MTT, 50 μL per well), and then cultured for 4 h. The remaining MTT reagent was discarded and 100 μL DMSO was supplemented into each well, and then slowly shaken for 10 min to dissolve the formazan in cells. Finally, the absorbance of the DMSO solutions was determined at 492 nm on a Synergy H1M microplate reader (BioTek, Winooski, VT, USA). The formula given below was utilized to calculate the cell viability (%):

      Cellviability=ATAbACAb×100%

      Herein, AT, AC and Ab represented the absorbance value of treatment group, control group (cells without additives) and 96-well microplate substrate, respectively.

      Trypan blue staining trials were performed as follows: The preculture with polysaccharide extract-added medium was the same as above, but only the cells cultured by the medium containing 0 and 5.0 mg/mL polysaccharide extractions were selected for staining and comparison. The pretreated cells were subsequently stained by 0.4% (wt%) trypan blue solution for 3 min, then microscopic images of the resulting cells were recorded on an inverted fluorescence microscope (Sunny Optical XD-FRL, 10 × objectives).

    • Two steps were concluded for the preparation of MNPs@B(OH)2, namely the synthesis of amino group-capped MNPs (bare MNPs) and boronic acid functionalization of bare MNPs. The synthetic route was illustrated in Supplemental Fig. S1, in which bare MNPs were fabricated via the one-step solvothermal method[4,5], and then the boronic acid modification was carried out in terms of Schiff-base reaction between amino groups onto bare MNPs and the formyl groups of FPBA[16,17]. Transmission electron microscopy (TEM) characterization indicated that both bare MNPs and MNPs@B(OH)2 were of fine water dispersibility and regular morphology, and the particle size of bare MNPs and MNPs@B(OH)2 was respectively estimated to be ca. 70~120 nm and 80~140 nm from TEM and DLS analysis (Fig. 2ac). Magnetic separation of MNPs@B(OH)2 could be easily achieved by external magnetic field (inset in Fig. 2b), which facilitated the operations of SPE. The slight increase in particle size of MNPs@B(OH)2 as compared with bare MNPs might be caused by the repeated magnetic separation during the post modification of boronic acid (FPBA).
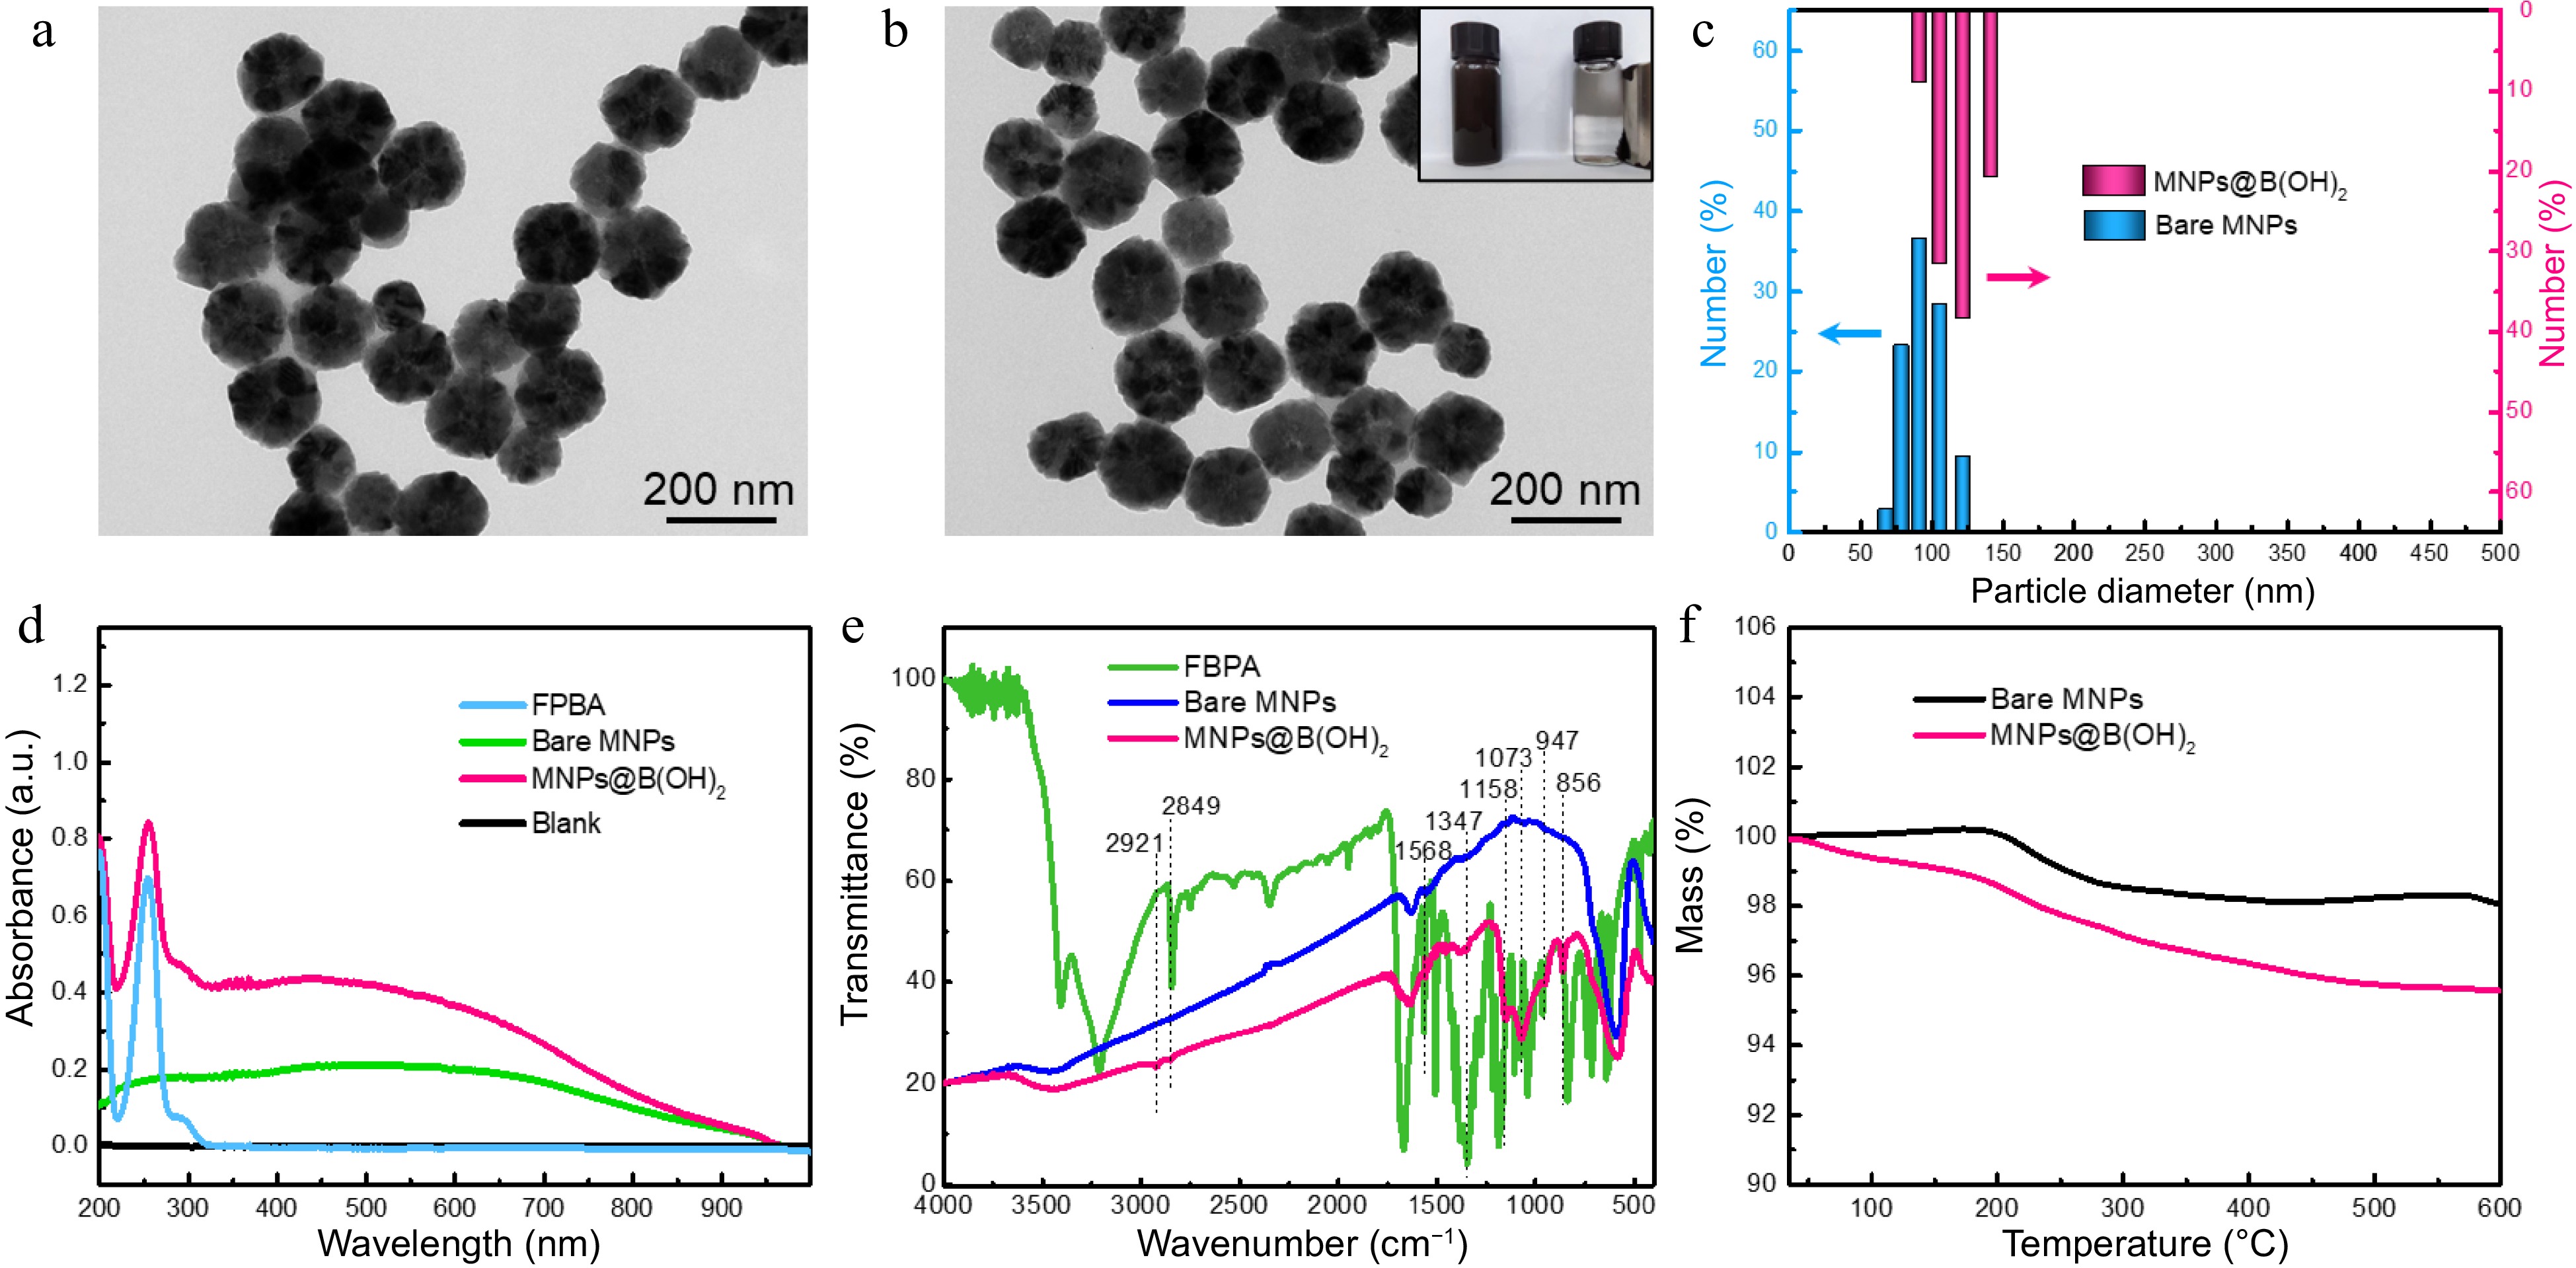
      Figure 2. 

      TEM characterization of (a) bare MNPs and (b) boronic acid-grafted MNPs, along with their particle size distributions analyzed by (c) DLS; (d) UV-vis spectra, (e) FT-IR spectra, and (f) TGA tests of MNPs materials with or without modification by FPBA. Inset in (b) was the digital photo showing the magnetic separation behavior of MNPs@B(OH)2 by an external magnet.

      The boronic acid functionalization was firstly evaluated by UV-vis spectrometry, and the characteristic absorption at 260 nm (produced by aromatic ring) of MNPs@B(OH)2 suggested that FPBA was successfully modified onto MNPs (Fig. 2d). FT-IR was further applied to confirm this claim. As seen in Fig. 2e, wide absorption band at ~3,413 cm−1 should be allotted to the stretching vibration of -OH or -NH2; the bands at 2,921 and 2,849 cm−1 should be assigned to the stretching vibration of C-H in methylene groups; the peak at 1,568 cm−1 should be attributed to the in-plane bending vibration of N-H of secondary amine while the peaks at 1,347 cm−1 was associated with the C-B vibrations; 1,158 and 1,073 cm−1 indicated the existence of C-N; the bands at 947 and 856 cm−1 could be, respectively, identified by the out-of-plane deformation vibration of hydroxyl group in boronic acid group and the p-disubstitution of the aromatic ring. These results were in agreement with previous literature reports[5,18] and affirmed that the post-modification of FPBA was workable. Additionally, the greater mass loss of MNPs@B(OH)2 than that of bare MNPs (4.5% vs 1.1%) in TGA tests (Fig. 2f) also validated the reasonability of this claim.

    • Boranate affinity has been well proved to be of excellent class recognition selectivity toward cis-diol containing compounds over non-cis-diol compounds[10,1921]. Thus, the binding selectivity of MNPs@B(OH)2 was firstly examined using cytidine, guanosine, adenosine, deoxyguanosine and deoxyadenosine as model analytes, among which cytidine, guanosine and adenosine were cis-diol compounds. As exhibited in Fig. 3a & b, only limited extraction capacity of bare MNPs could be observed toward model analytes, as contrasts, MNPs@B(OH)2 displayed high binding ability toward cytidine, guanosine and adenosine, giving an equilibrium binding capacity (Qe) of 81.44 vs 1.87 μg, 230.41 vs −3.21 μg, and 240.92 vs 57.35 μg, respectively, which suggested that MNPs@B(OH)2 were of good recognition selectivity toward cis-diol compounds against non-cis-diol compounds. The influence of pH on the binding capacity of MNPs@B(OH)2 was given in Fig. 3c & d, and the results indicated that optimal binding performance could be achieved at pH 7.5~8.5, which could be rationalized by the fact that boronate affinity effect would be active at such a pH around pKa of FPBA[22,23]. Such a weak alkaline working pH is beneficial to maintain the structural stability of polysaccharide. Binding dynamics assay declared that the binding equilibrium could be reached within 10 min (Fig. 3e & f), which is consistent with the rapid binding feature of boronate affinity[10], and also provided a reference for selection of extraction time during polysaccharide MSPE. These findings revealed that the binding between MNPs@B(OH)2 and cis-diol compounds was dominated by boronate affinity effect, laying the foundation for upcoming BA-MSPE of polysaccharides.
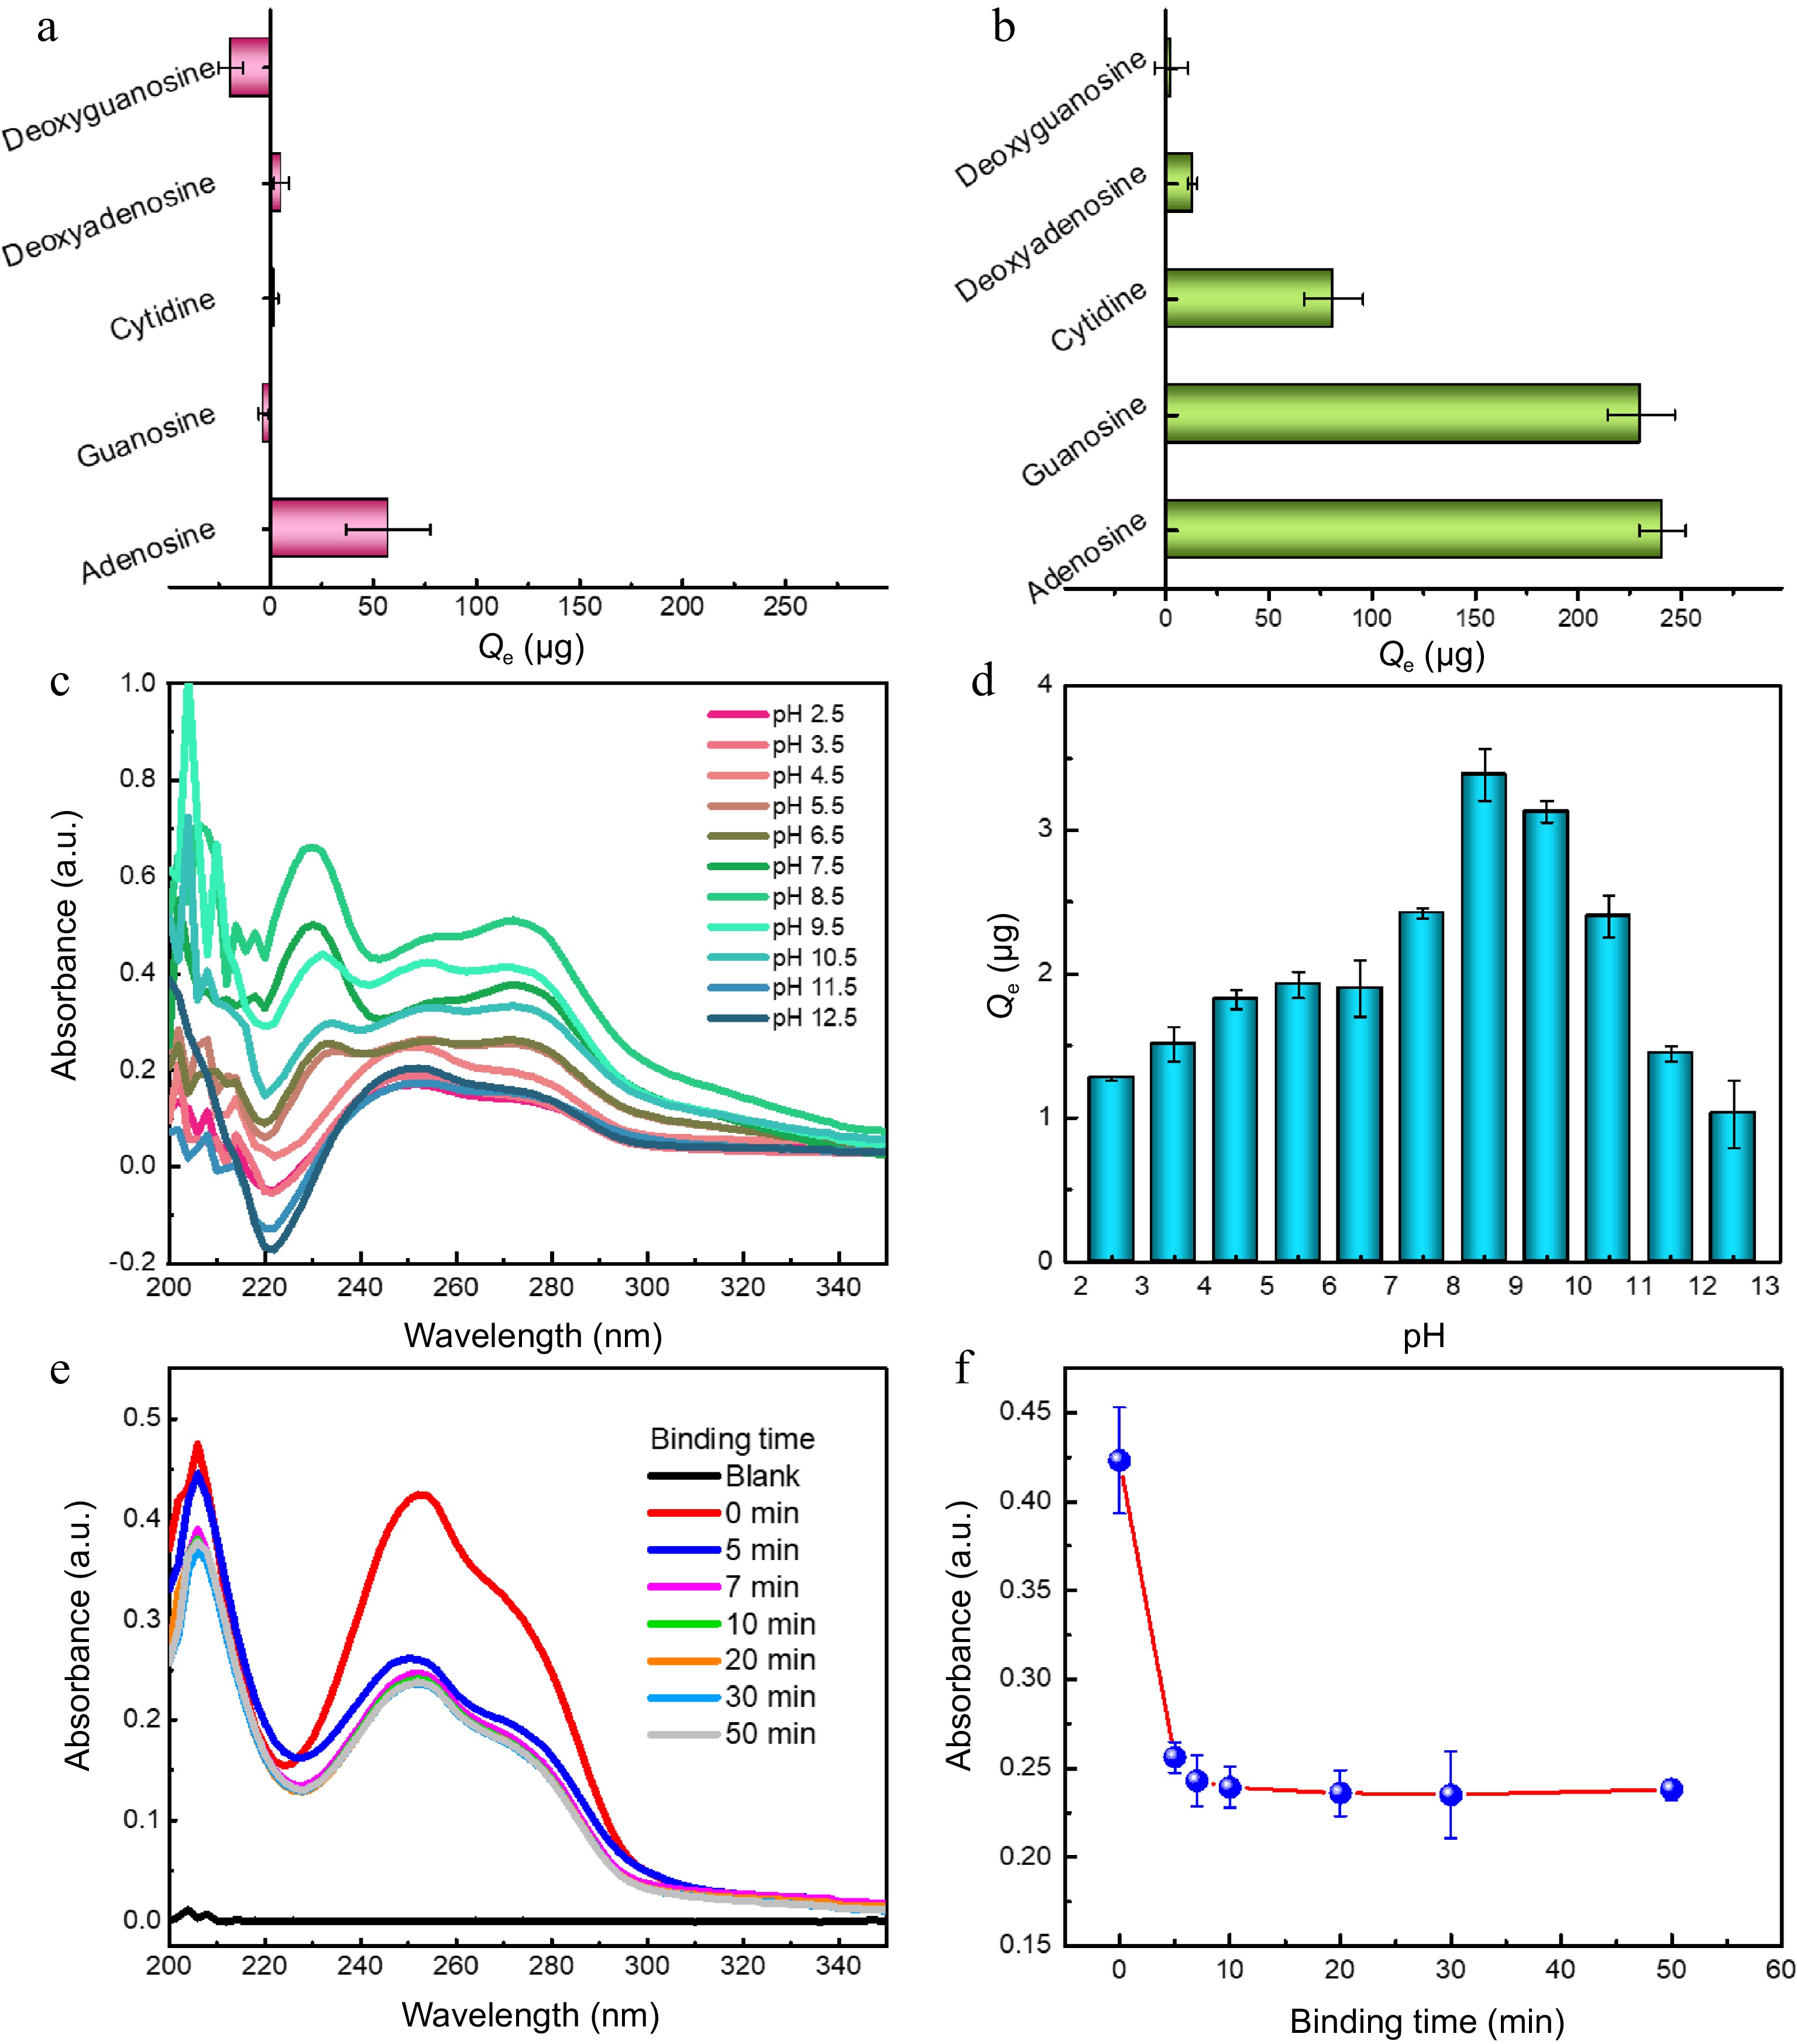
      Figure 3. 

      Binding selectivity of (a) bare MNPs and (b0 MNPs@B(OH)2 toward five model compounds; Typical UV-vis spectra of guanosine extracted by MNPs@B(OH)2 at (c) different pH and their (d) quantitative comparison; (e) UV-vis spectra of guanosine in supernatants after extraction by MNPs@B(OH)2 at different extraction time, and (f) the absorbance of guanosine in supernatants as a function of extraction time. All tests were carried out at least three times in parallel.

      The extraction performance of bare MNPs and MNPs@B(OH)2 was compared using SPS, PPS, LBPS and TPS as model polysaccharides, and the results were provided in Fig. 4a & b. Obviously, the equilibrium binding capacity (Qe) of MNPs@B(OH)2 was higher than that of bare MNPs in all cases, and a deeper color also appeared after color development by the phenol-sulfuric acid method, which demonstrated that boronate affinity was activated and essential for MSPE of polysaccharides. Zeta (ζ) potential tests disclosed that MNPs@B(OH)2 were negatively charged at the given conditions (phosphate buffer solution with pH 8.5) while the ζ potentials of PPS-/TPS-extracted MNPs@B(OH)2 were slightly enhanced (Supplemental Fig. S2), offering a value of −41.6 ± 2.68 mV, −38.3 ± 3.12 mV, and −38.7 ± 2.26 mV, respectively. The negative charge of MNPs@B(OH)2 ought to ascribe to the formation of boronic anions with the boron in its tetragonal hybridization[24] at pH 8.5 while the increased surface potential after extraction of polysaccharides could be clarified by the electroneutrality and relatively large molecular weight of polysaccharides, which affect the surface charge of MNPs@B(OH)2. These results proved that MNPs@B(OH)2-mediated MSPE of polysaccharides was workable, and boronic acid played a vital role in this process.
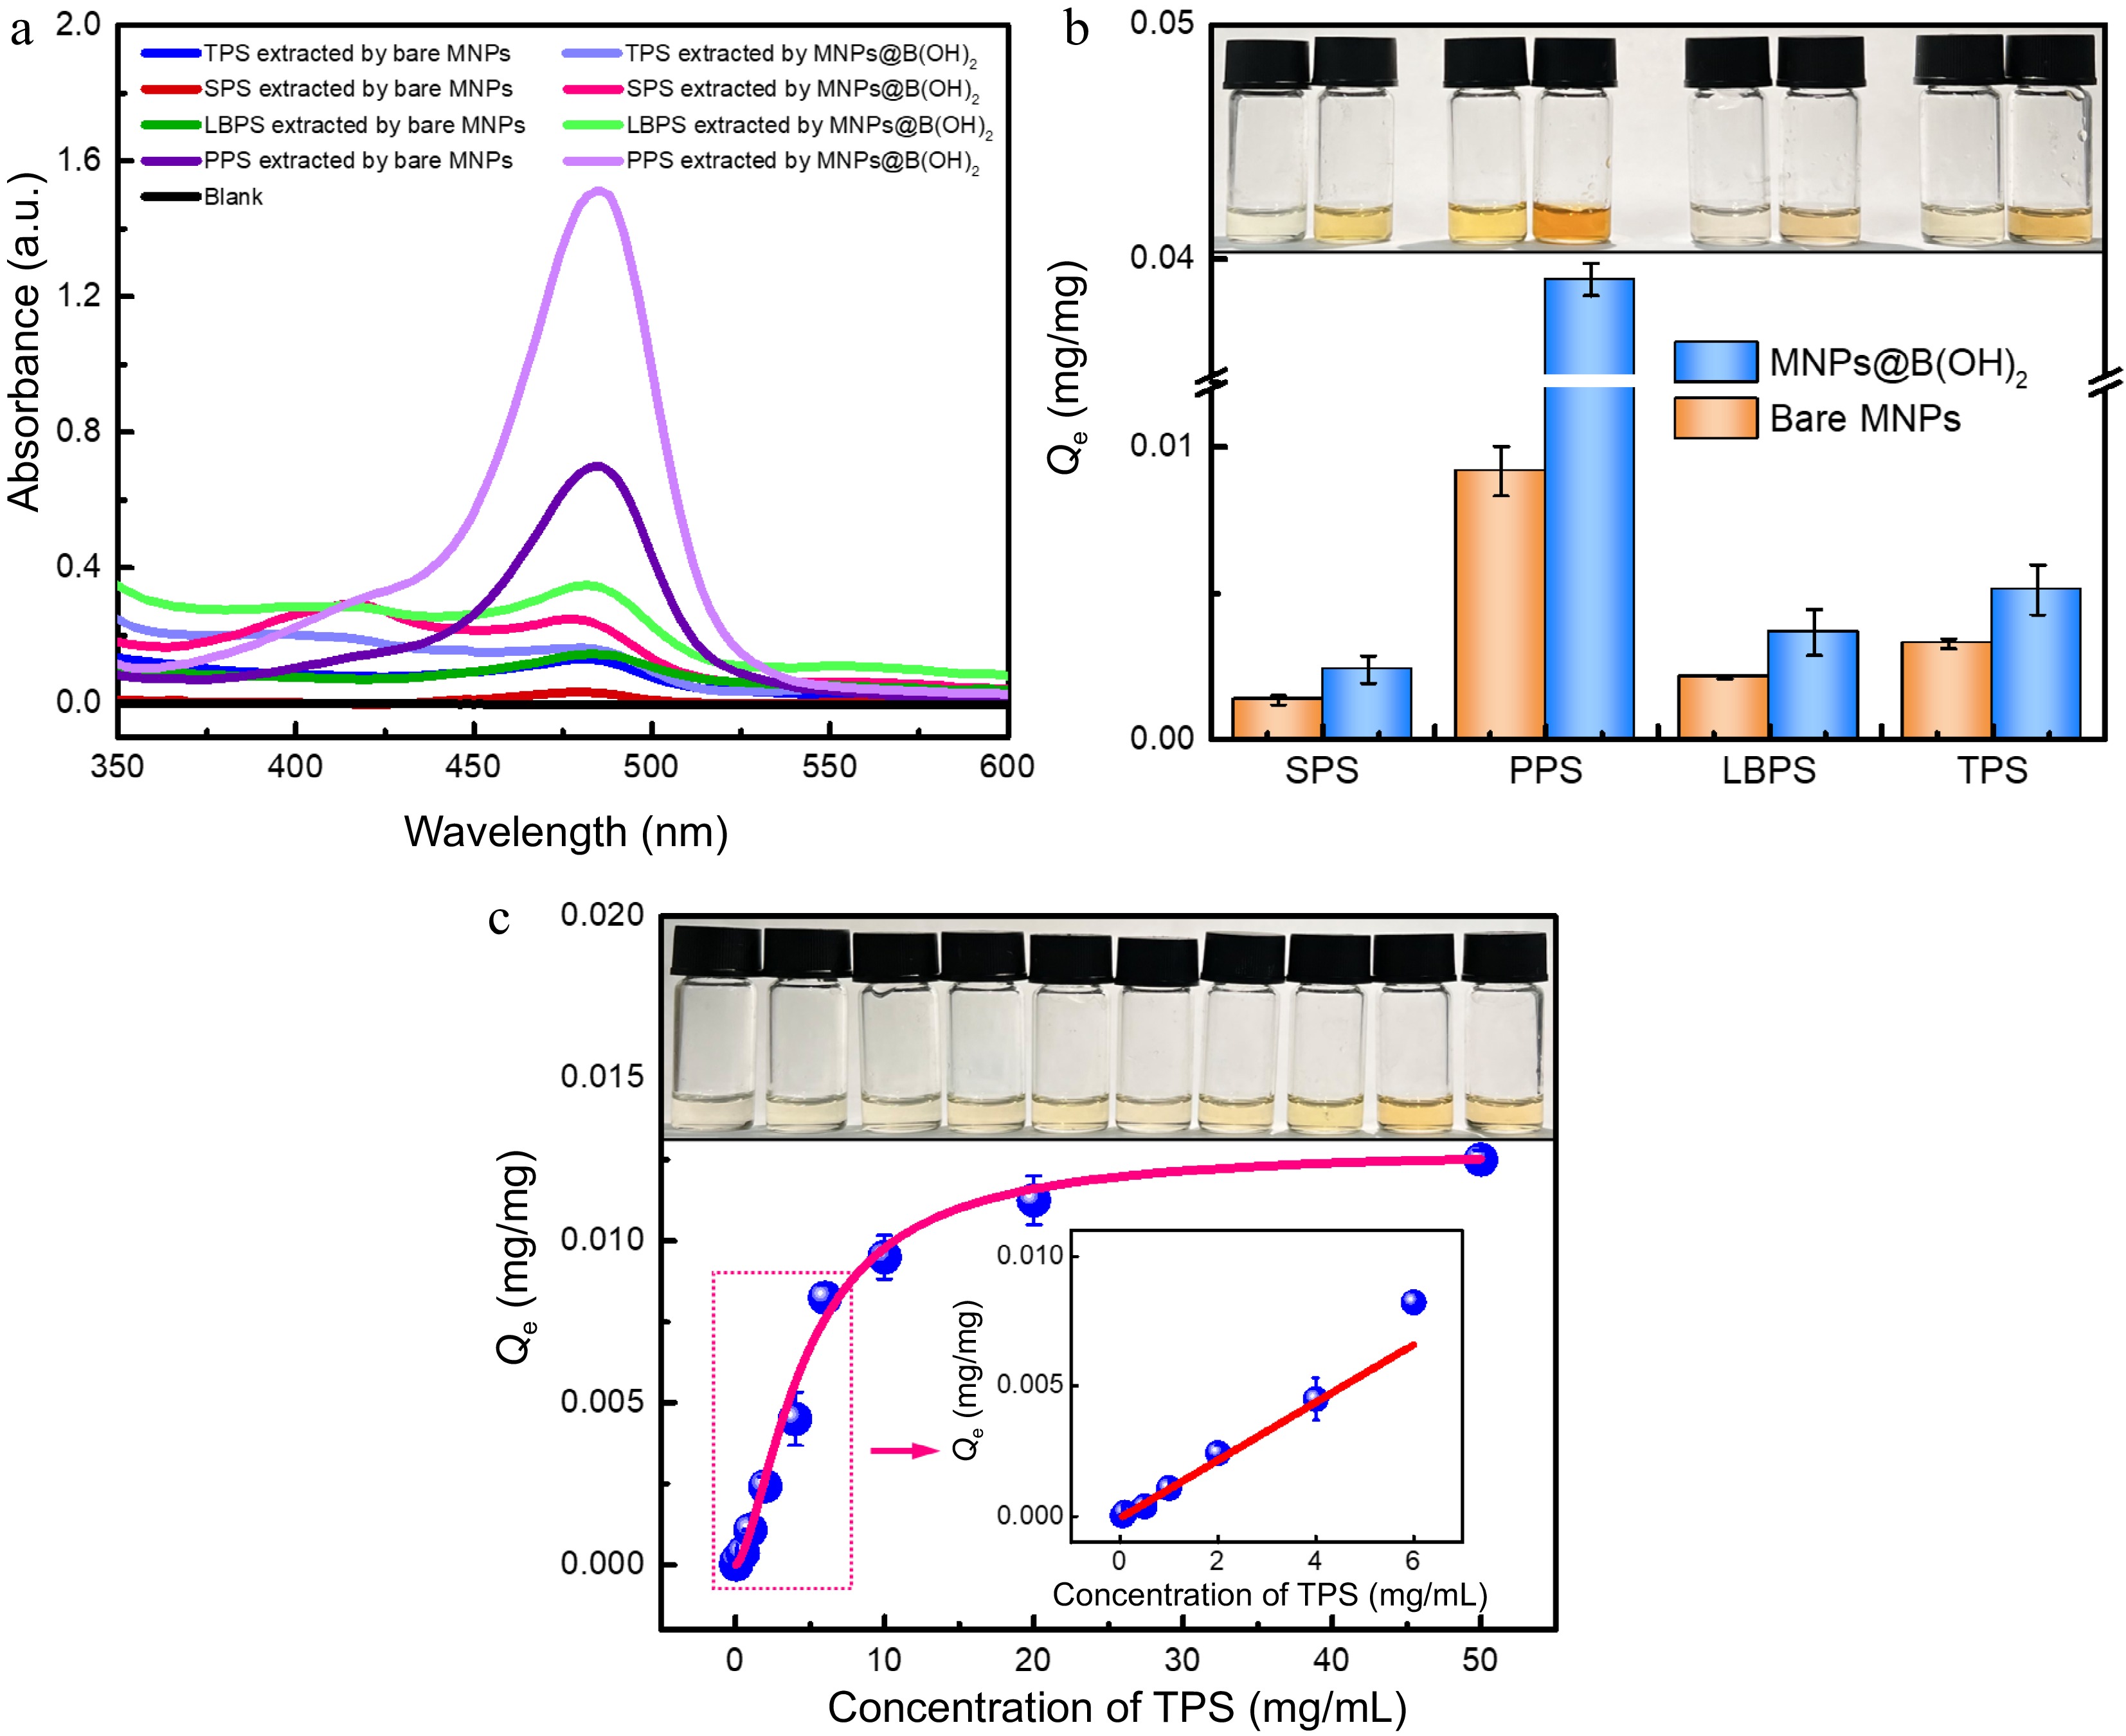
      Figure 4. 

      UV-vis spectra of four polysaccharide extractives by different MNPs after (a) color development by the phenol-sulfuric acid method, and the (b) equilibrium binding capacity of bare MNPs and MNPs@B(OH)2 toward four model polysaccharides, all with a concentration of 1.0 mg/mL); (c) Adsorption isotherms for TPS binding to MNPs@B(OH)2. Insets in (b) and (c): digital photos of polysaccharide extractives (derived by phenol-sulfuric acid chromogenic reaction) with the same order as relevant horizontal axis. Diagrams inserted in (c): linear fitting in the working range of 0.05~6.0 mg/mL (y = 0.0445x − 0.0029, R2 = 0.9579). All measurements were repeated in triplicate at least for quantitative calculations.

      Adsorption isotherm was further used to assess the binding properties of MNPs@B(OH)2 using tea polysaccharide (TPS) as a model analyte, in which the standard curve method presented in Supplemental Fig. S3 and Supplemental Table S1 was utilized for quantification, and the Hill equation[2527] was selected to nonlinearly fit the data. The theoretical maximum binding capacity (Qmax) of MNPs@B(OH)2 toward TPS was deduced to be 12.93 μg/mg (Fig. 4c), accompanying a dissociation constant (Kd) of 4.72 mg/mL or 4.63 × 10⁻³~4.63 × 10⁻⁶ M (R2 = 0.9896, the molecular weight of TPS from tea leaves was ca. 1.02~1020 kDa according to literature reports[28]). Such a Kd level was lower than that of boronic acid and small molecular cis-diol compounds (Kd was usually on the order of magnitudes of 10−1~10−4 M[2224]), indicating higher binding force between boronic acid and polysaccharides as compared with the binding between boronic acid and small molecular cis-diol compounds. This outcome would be explained by the plenty of 1,2- and 1,3-cis-diol structures of polysaccharide and consequently formed positive synergetic effects by the multi-sites binding between boronic acid and polysaccharide. It also implied the correctness of the possible binding mechanism proposed in Fig. 1. Moreover, a fine linear correlation (y = 0.0445x − 0.0029, R2 = 0.9579) between the Qe of MNPs@B(OH)2 and TPS concentrations could be found in the concentration range of 0.05~6.0 mg/mL, and a good color evolution of polysaccharide extractives after color development by phenol-sulfuric acid method also emerged as polysaccharide concentrations increased, paving the way for quantification of BA-MPSE and giving a guideline for the consumption of materials in real applications.

    • The above-mentioned results encouraged us to explore the feasibility of polysaccharides BA-MSPE in real beverage plants. Lycium barbarum, tea leaves (green tea) and soybeans were devoted as real plant samples, and the extraction of polysaccharides from these plants by bare MNPs and MNPs@B(OH)2 was compared in Fig. 5. After chromogenesis by phenol-sulfuric acid method, strong absorption of leaching liquors at 488 nm demonstrated that polysaccharides were successfully released from plant samples. Higher absorbance of extractives by MNPs@B(OH)2 than those by bare MNPs declared better MSPE performance of MNPs@B(OH)2 (Fig. 5a~c), giving the binding capacity 4.6 times as high in MNPs@B(OH)2 as in bare MNPs (LBPS, Fig. 5d). The possible reason for the variation in the relative binding capacity of MNPs and MNPs@B(OH)2 in Figs 4b & 5d would be attributed to the fact that the initial concentrations of standard polysaccharides and the polysaccharides in leaching liquors of real beverage plants were different. The digital photos of freeze-dried polysaccharide extractives and standard polysaccharide samples were showed in Supplemental Fig. S4, and the similar appearance and colors between them also implied that it was practicable to extract polysaccharides in real beverage plants by MNPs@B(OH)2.
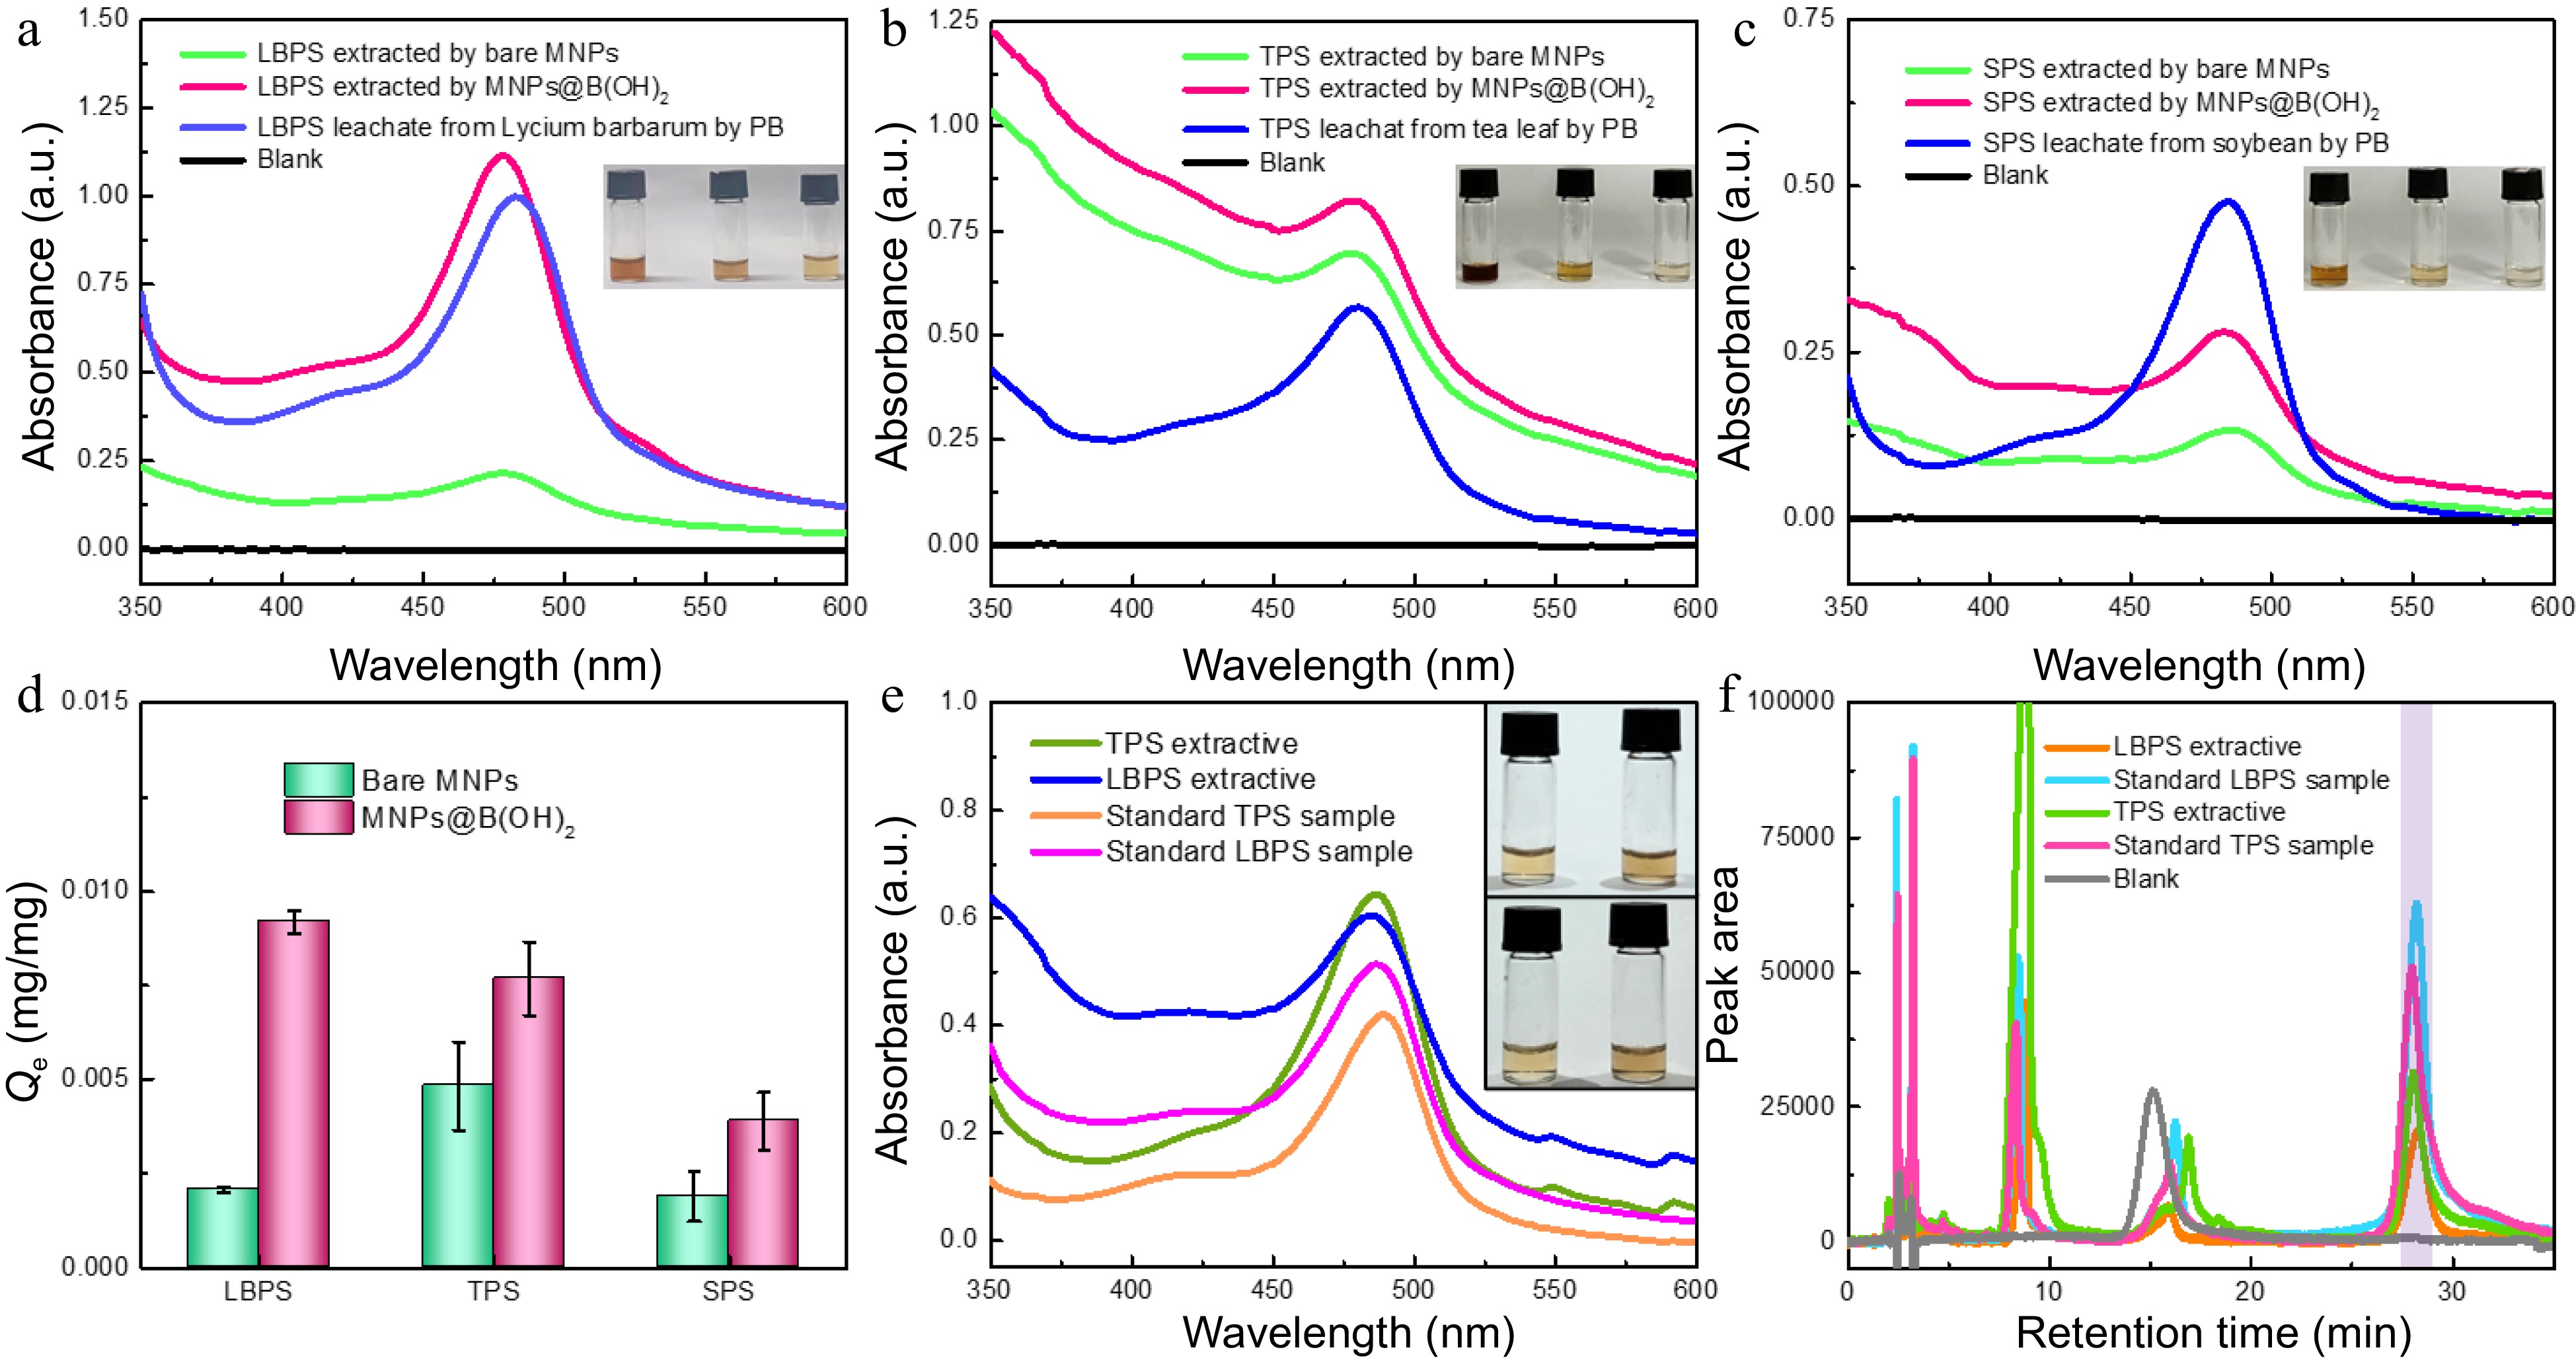
      Figure 5. 

      UV-vis spectra of polysaccharide leaching liquors and extracts from (a) Lycium barbarum, (b) tea leaves and (c) soybeans by different materials. The comparison in extraction performance of bare MNPs and MNP@B(OH)2 (d, n = 3); (e) UV-vis spectra of TPS and LBPS extractives (1.0 mg/mL) and standard polysaccharide solutions (0.5 mg/mL); (f) HPLC chromatograms of TPS and LBPS extractives (1.0 mg/mL for TPS, and 0.5 mg/mL for LBPS) and standard polysaccharide solutions (0.5 mg/mL for TPS, and 0.3 mg/mL for LBPS) after labelling with PMP , in which light violet zone indicated the peak position of polysaccharides. Insets in (a)−(c) were, respectively, the digital photos of relevant polysaccharides obtained in different pathways after color development with phenol-sulfuric acid chromogenic method, and the order was leachates and the extractives by MNPs@B(OH)2 and bare MNPs from left to right. The inset in (e) was the photos of polysaccharide extractives (top) and standard polysaccharide samples (bottom) of TPS (left) and LBPS (right) with the same concentrations as UV-vis spectra tests. All UV-vis spectrograms were obtained after phenol-sulfuric acid chromogenic reaction.

      The relative purities of TPB and LBPS extractives were roughly estimated by UV-vis spectrometry using standard polysaccharides as benchmarks and standard curve method for quantification. As displayed in Fig. 5e, the same characteristic bands at ~488 nm and the similar colors between polysaccharide extractives and standard polysaccharide samples after color development by phenol-sulfuric acid chromogenic reaction demonstrated that polysaccharides were efficiently extracted by MNPs@B(OH)2, showing a deduced relative purity of (56.8 ± 0.9)% and (69.1 ± 1.9)% for LBPS and TPS (Supplemental Table S1), respectively. HPLC, a powerful tool for quantification of polysaccharides[29,30], was applied to further confirm these outcomes using PMP labeling reaction for the pre-column derivatization of polysaccharides. Standard curve method showed in Supplemental Fig. S5 and Supplemental Table S2 were employed to infer the content of polysaccharides in extracts. As shown in Fig. 5f, the similar chromatographic retention behaviors could be found between polysaccharide extractives and standard polysaccharides, and the peaks at retention time near 28 min (light violet area in Fig. 5f) could be allotted to the chromatographic curves of polysaccharides by virtue of the mapping between peak area and concentrations, which further verified that polysaccharides were effectively extracted by MNPs@B(OH)2. The relative purities were, respectively, (43.1 ± 1.3)% and (59.2 ± 5.3)% for LBPS and TPS. Higher purities produced by UV-vis spectrometry than those from HPLC might be attributed to the existence of unknown impurities, while such a positive error could be avoided thanks to the separation effect of HPLC. Although the purity level was not so high, it was acceptable considering that only once extraction was implemented in such a facile way of BA-MSPE.

      FT-IR spectrometry was used for the structure identification of extracted polysaccharides. As seen in Supplemental Fig. S6, the absorption bands at 3429/3413 cm−1 and 2931/2923 cm−1 were assigned to the stretching vibration of -OH groups and C-H (in -CH2- groups); the band at 1650 cm−1 was due to the stretching vibration of aldehydic carbonyl; the band at 1405/1409 cm−1 was on count of the deformation vibration of -CH2- groups; the peaks at 1248/1251 cm−1 and 1023/1054 cm−1 were attributed to the stretching vibration of C-OH side groups or C-O-C glycosidic bond vibrations, suggesting the possible structure of pyranose ring in sugar residues; the absorption bands at 937/944 cm−1 and 849/850 cm−1 were, respectively, caused by β- and α-glycosidic bonds. These results are in agreement with the literature reports[15, 31], and also double-checked the validity of BA-MSPE for polysaccharides. The main absorption bands were basically the same for TPS and LBPS, indicating their primary chemical structures were similar. Meanwhile, the similarity in characteristic peaks between polysaccharide extracts and standard polysaccharide samples suggested that the structural integrities of extracted polysaccharides were well maintained, which would benefit from the mild extraction conditions during the process of BA-MSPE.

      HPLC analysis was applied to roughly estimate the monosaccharide composites of extracted LBPS and TPS. The polysaccharides were first hydrolyzed by the trifluoroacetic acid method and subsequently labeled by PMP prior to sample loading. As presented in Supplemental Fig. S7, six chromatographic peaks could be found from the chromatographic curves of TPS and LBPS, and the principal compositions of xylose (Xyl), arabinose (Ara), glucose (Glc), and galactose (Gal) could be identified. Detailly, peaks 1~6 would be respectively assigned to Xyl, Ara, Xyl, Ara, Glc and Gal for LBPS, and Xyl, Xyl, Ara, Glc, Ara and Gal for TPS as compared with the retention of monosaccharides, giving peak area percentages of 1.5%, 1.5%, 14.8%, 14.2%, 22.1% and 45.9% for LBPS, and 14.4%, 42.4%, 20.1%, 6.3%, 5.0% and 11.8% for TPS. Since no UV absorption signal could be produced by monosaccharides themselves, it was rational to roughly estimate the relative content of monosaccharides by peak area percentages. It was clear that the predominant monosaccharides were Glc and Gal in LBPS, and Xyl and Ara in TPS, which is basically consistent with the results reported in the literature[28, 32, 33]. The content of Xyl in TPS was somewhat different from that reported in the literature[28], and the reason might be related to the difference of tea categories, origin, as well as the hydrolysis conditions.

      The relationship between extraction capacity and the dosage of MNPs@B(OH)2 used for MSPE was furtherly probed using TPS and LBPS as model polysaccharides, and the consequences were presented in Supplemental Fig. S8. Although the relative binding capacity of MNPs@B(OH)2 was not so high (Fig. 5d) due to their large specific gravity (chemical compositions of MNPs were mainly Fe3O4 and/or Fe2O3[34]), the extracted amounts of two polysaccharides were linearly enhanced as the consumption of MNPs@B(OH)2 increased from 10 to 150 mg (Supplemental Fig. S8ac), giving a linear regression equation of y = 0.0056x + 0.4535 (R2 = 0.9392) for TPS, and y = 0.0073x + 0.2953 (R2 = 0.9294) for LBPS, respectively. Correspondingly, the colors of polysaccharide extractives were gradually deepened as the increase of MNPs@B(OH)2 loading amounts (Supplemental Fig. S8d). Clearly, to some extent, such a dosage-dependent extraction capacity remedied the foible of relatively low binding capacity of MNPs@B(OH)2, and provided a guidance for their dosage selection in real applications.

      The reusability of MNPs@B(OH)2 for BA-MSPE was further explored using TPS as a model polysaccharide, and the results are showed in Supplemental Fig. S9. The fluctuation in binding capacity of MNPs@B(OH)2 after continuous extraction and desorption ten times was less than 13%, demonstrating an acceptable recyclability of MNPs@B(OH)2 for polysaccharide extraction. Likewise, after color development with phenyl-sulfuric acid method, the colors of TPS extractives obtained by ten consecutive extractions were very close, which confirms the above-stated claim.

    • Antioxidant activity of the obtained TPS and LBPS extractives by MNPs@B(OH)2 was investigated by DPPH radical scavenging assays[3537]. As shown in Fig. 6, no obvious change could be observed in the absorbance of DPPH after monitoring continuously for 1 h in the absence of polysaccharide (∆A < 1.9%, Fig. 6a & d), by contrast, the absorbance of DPPH was significantly decreased in the presence of TPS and LBPS even their concentration as low as 0.2 mg/mL (Fig. 6bd), showing a free radical scavenging rate of 31.4% and 18.8%, respectively. Correspondingly, the color of DPPH solution without the addition of polysaccharides was stable while the color variations of polysaccharide-added DPPH were eye-catching enough. These findings certified that the polysaccharides extracted by MNPs@B(OH)2 were of fine antioxidant activity. The possible reasons for stronger antioxidant capability of TPS than that of LBPS could ascribe to its higher relative purity, broader distribution in molecular weight[28] and abundant active functional groups[38].
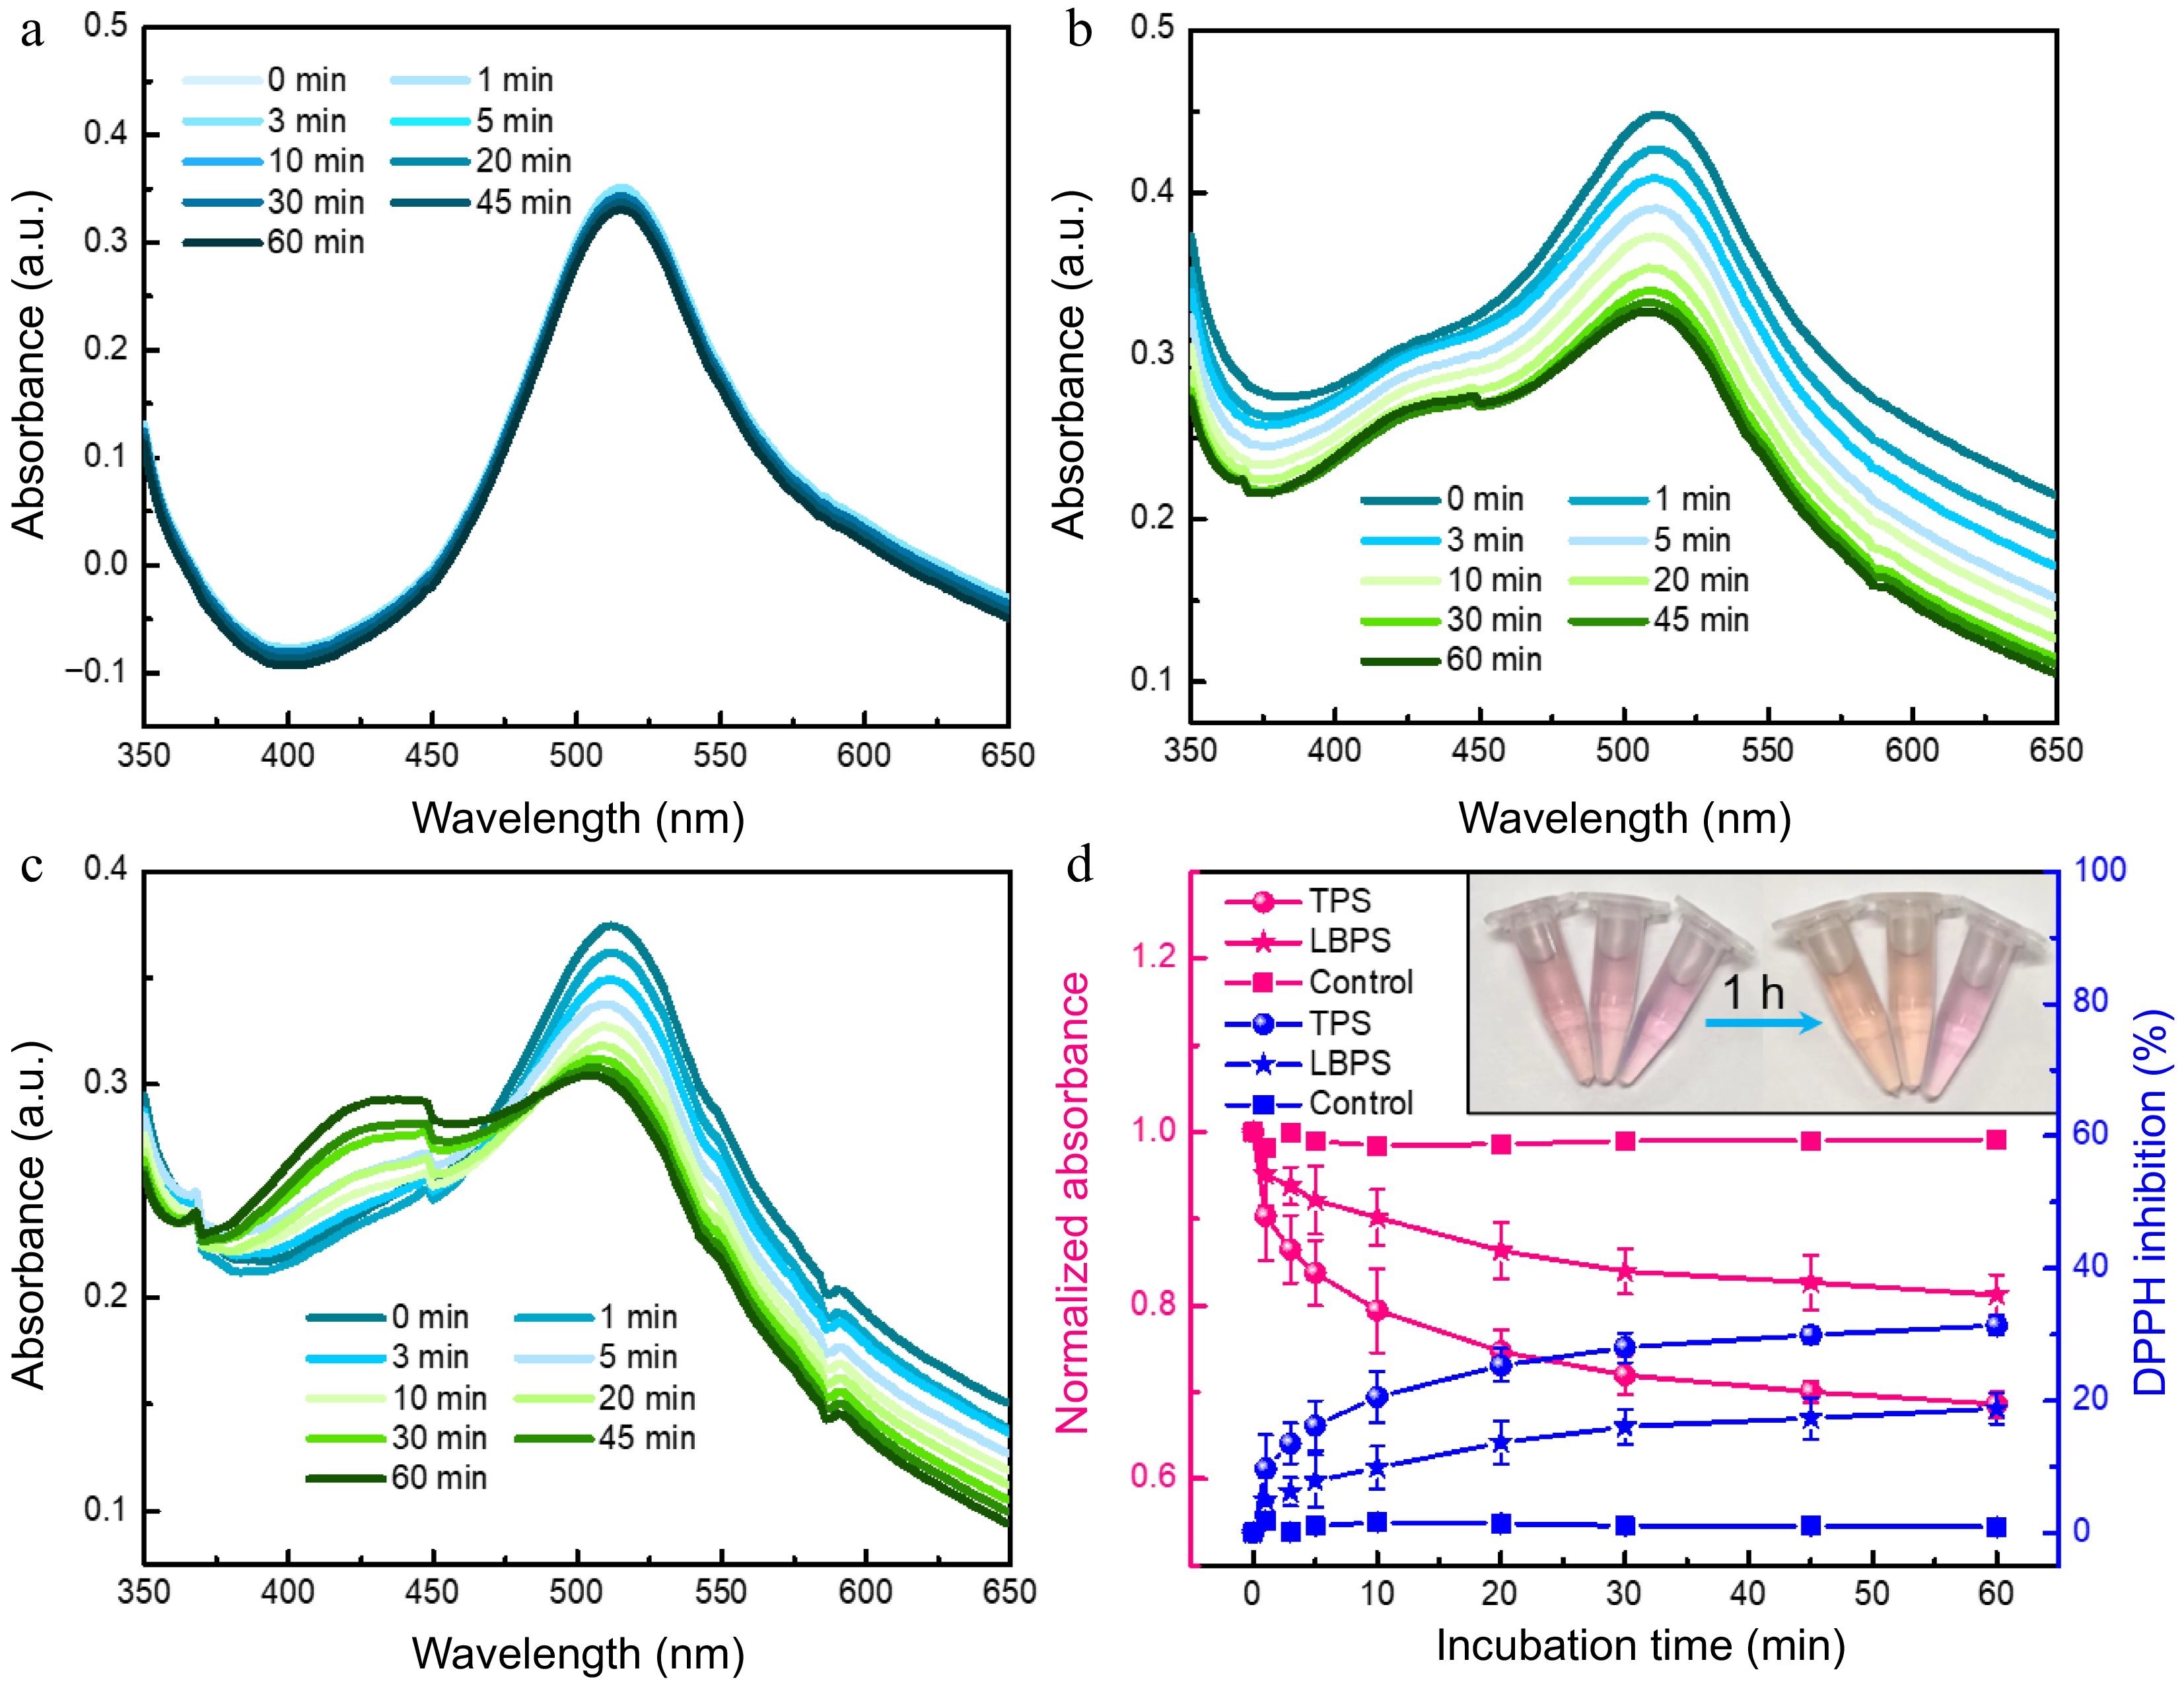
      Figure 6. 

      UV-vis spectra of (a) DPPH, (b) TPS- and (c) LBPS- added DPPH obtained at incubation time ranging from 0 to 60 min. Antioxidant ability of TPS and LBPS assessed by DPPH scavenging activity assay (d, n = 3). The final concentration of both TPS and LBPS added in DPPH was 0.2 mg/mL.

      The antitumor activities of LBPS and TPS were subsequently probed by microscopic imaging, MTT trials, along with trypan blue staining assays[39] using A549 and MCF-7 as representative carcinoma cell lines, and the results were presented in Supplemental Figs 7 & S10. Microscopic imaging implied that the cells morphology changed significantly, focusing on cell shrinkage, deteriorated adhesion ability, and the abnormal distribution of intracellular contents. Irreversible vacuolation emerged widely in both A549 and MCF-7 cells under the culture condition in the presence of LBPS (Fig. 7c, d, Supplemental Fig. S10c, d), while cell disruption was more distinct after culturing with TPS (Fig. 7e, f, Supplemental Fig. S10e, f), and a large number of cell fragments could be found in this case, suggesting cells were dying and cell functional statuses changed. These phenomena might be closely related with different apoptosis pathways induced by TPS and LBPS. TPS have been proved to be of lysosomes targetability and induced apoptosis by a lysosomal-mitochondrial pathway mediated caspase cascade[40], while the inhibitions in proliferation, migration and survival of tumor cells by LBPS were testified to be related with Pi3K/AKT signaling pathway[41]. Furthermore, all cells were well stained by trypan blue after administrating by LBPS and TPS (Figs 7d, f, Supplemental Fig. S10d, f), as controls, only a few cells were stained in control groups, which further confirmed that polysaccharide extracts were of antitumor activity and caused cell death. The relative cell viabilities were profiled by MTT assays and the results were given in Fig. 7g, h. An obvious dosage-dependent cytotoxicity could be observed for both LBPS and TPS extractives, showing a relative cell survival rate less than 60.0% and 22.8% for A549 cells, and 43.4% and 8.2% for MCF-7 cells after respectively treating by LBPS and TPS with an equal concentration of 5.0 mg/mL. The higher cell mortality rate induced by TPS as compared with LBPS might be thanks to its relatively higher purity obtained during BA-MSPE. These findings were consistent with the results of literature reports[4043], and confirmed the reliability of antitumor activities of polysaccharide extractives.
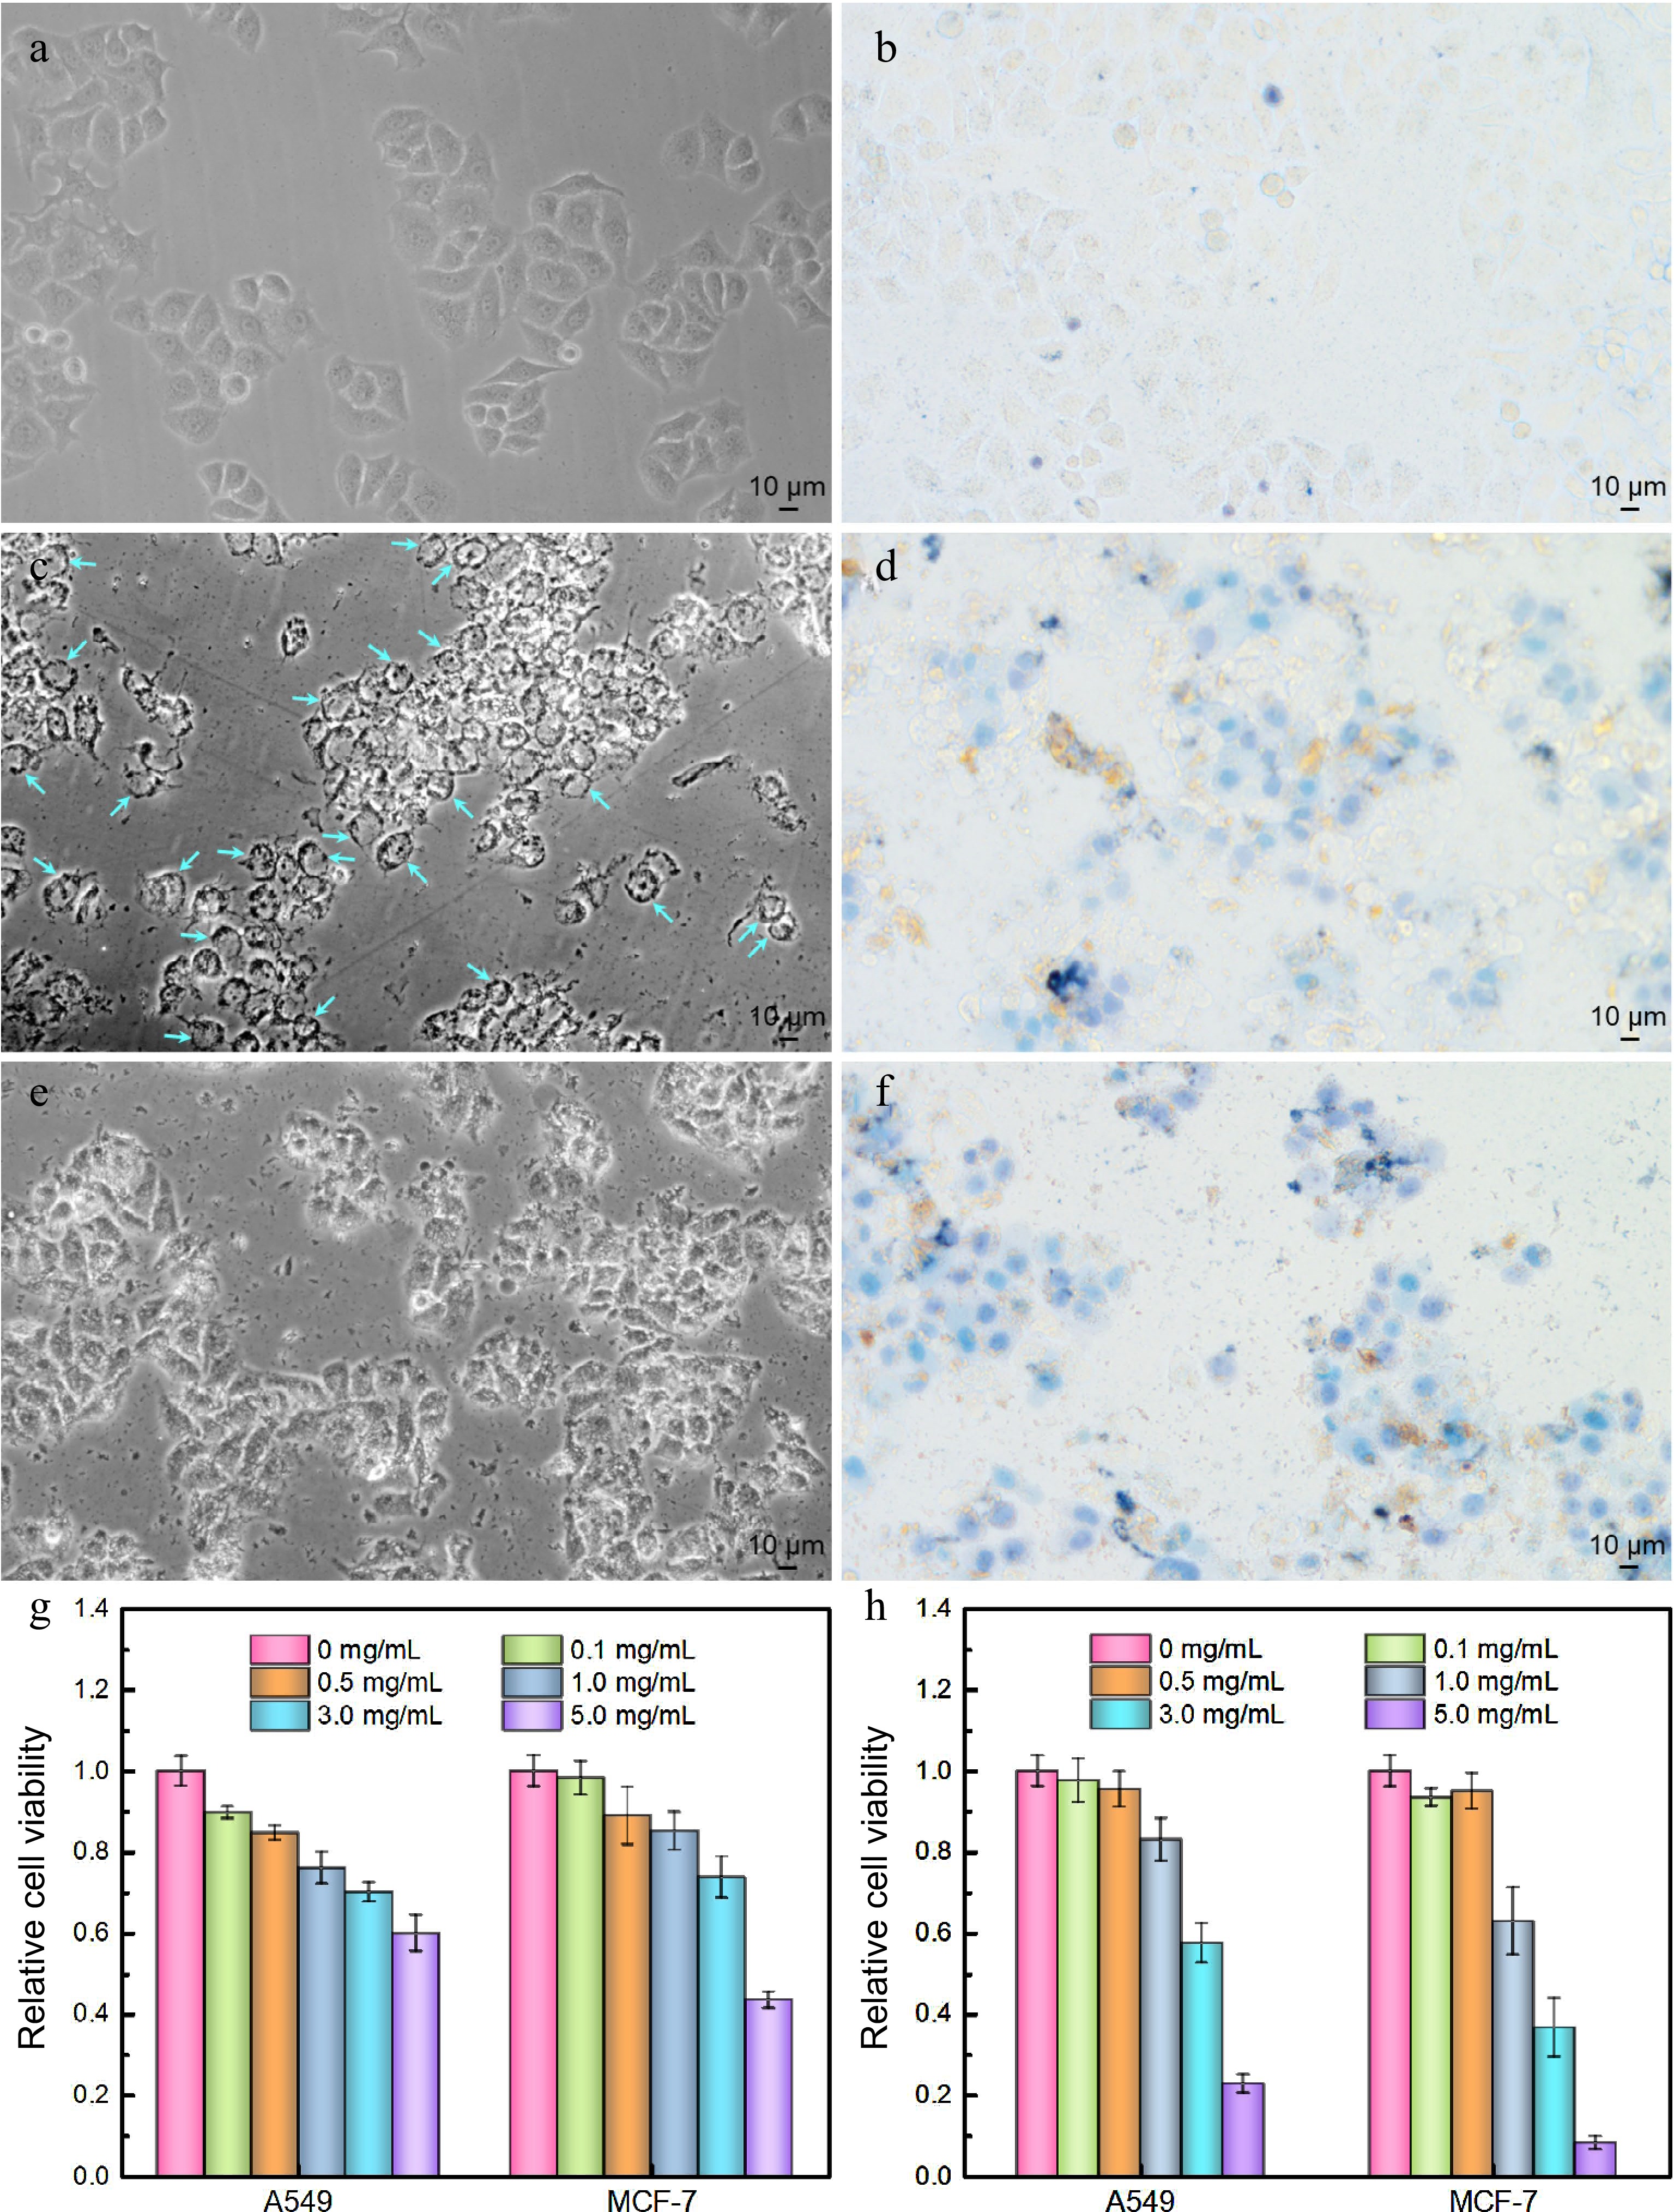
      Figure 7. 

      Antitumor activities of polysaccharide extracts assessed by optical microscopic imaging (a) − (f) using MCF-7 cells as a model cell line and (g), (h) MTT assays. (a) Cell imaging of control group, (b) trypan blue stained control group, (c) LBPS-treated group, (d) trypan blue stained LBPS-treated group, (e) TPS-treated group, and (f) trypan blue stained TPS-treated group. The dosage of TPS and LBPS in (c) − (f) was set as 5.0 mg/mL. Relative cell viabilities of A549 and MCF-7 cells after administrating by (g) LBPS and (h) TPS by MTT assays. Blue arrows in (c) on behalf of the typical vacuolated cells.

    • Boronic acid-functionalized magnetic nanoparticles (MNPs@B(OH)2) have been prepared and used as sorbents for boronate affinity-mediated MSPE of polysaccharides in this work. Boronate affinity effect and its work parameters were investigated, the mechanism for the binding of polysaccharides by MNPs@B(OH)2 was discussed, and the extraction conditions were also optimized. Three polysaccharides, including TPS, LBPS and SPS, were successfully extracted from relevant real-world beverage plants, and the main active ingredients in extracts were identified by several instrumental analysis techniques, such as UV-vis/FT-IR spectrometry and HPLC. In the end, the extracted TPS and LBPS were experimentally proven to be of fine antioxidant and antitumor bioactivities in terms of DPPH radical scavenging experiments, trypan blue staining, as well as MTT assays. Since the operations of BA-MSPE were straightforward and do not necessitate the use of organic solvents or other intricate impurities elimination steps during BA-MSPE, coupled with the fine recyclability of MNPs@B(OH)2, this approach may have more potential for the simple separation and purification of cis-diol containing compounds in the fields of food and agricultural product processing.

      • This work was funded by the National Natural Science Foundation of China (Grant No. 21904003), the University Scientific Research Project of Anhui Province (2022AH050296), the Natural Science Foundation of Anhui Province (Grant No. 2108085QB85), the Open Project of Anhui Engineering Technology Research Center of Biochemical Pharmaceutical (Bengbu Medical College) (Grant No. 2022SYKFZ02), and the Student Research Training Program of Anhui University of Technology (Grant No. 202210360031, 202210360038).

      • The authors declare that they have no conflict of interest.

      • # These authors contributed equally: Yuwen Ding, Haiyang Li

      • Supplemental Fig. S1 Synthetic route of amino group-capped MNPs (a) and boronic acid-modified MNPs (b).
      • Supplemental Fig. S2 Representative ζ potential distribution curves of MNPs@B(OH)2 (a), PPS-extracted MNPs@B(OH)2 (b), and TPS-bound MNPs@B(OH)2 (c); The quantitative comparison of their ζ potentials (d).
      • Supplemental Fig. S3 UV-vis spectra of polysaccharides with different concentrations (a, c, e) measured after phenol-sulfuric acid chromogenesis, and the standard curves fitted by the relationship between absorbance and polysaccharides concentrations (b, d, f). The details for linear regression equation and related working parameters were listed in Table S1.
      • Supplemental Fig. S4 Digital photos of standard polysaccharide samples (1, 2) and freeze-dried extractives (3, 4) of TPS (1, 3) and LBPS (2, 4) by MNPs@B(OH)2.
      • Supplemental Fig. S5 HPLC chromatograms (a, c) of polysaccharides with different concentrations, and the standard curves (b, d) obtained by the relationship between peak area and polysaccharides concentrations. (a, b): LBPS; (c, d): TPS. Linear equations, their working parameters along with the tested purities of polysaccharides were given in Table S2.
      • Supplemental Fig. S6 FT-IR spectra of polysaccharide extractives (blue) and standard polysaccharide samples (red). (a) TPS; (b) LBPS.
      • Supplemental Fig. S7 Chromatograms of several monosaccharides and the hydrolysates of LBPS and TPS after labelling by PMP. (b) Partial enlargement of chromatographic curves for peak 2 in (a). Peaks identification for LBPS and TPS: (1, 3) xylose (Xyl); (2, 6) arabinose (Ara); (4) mannose (Man) and Ara; (5) glucose (Glc); (7) galactose (Gal).
      • Supplemental Fig. S8 UV-vis spectra of TPS (a) and LBPS (b) extractives from tea leaves and Lycium barbarum by MNPs@B(OH)2 with different doages; The extraction capacity of TPS and LBPS as a function of MNPs@B(OH)2 usage (c); Digital photos of TPS (top) and LBPS (bottom) extractives recorded after color development by phenol-sulfuric acid method with a decreased dosage of MNPs@B(OH)2 sorbents from left to right (d), which corresponding to the amounts used in (a-c). Linear equations in (c) were, respectively, y=0.0056x+0.4535, R2= 0.9392 (TPS) and y=0.0073x+0.2953, R2= 0.9294 (LBPS), both with a dosage gradient of MNPs@B(OH)2 ranged from 10 to 150 mg.
      • Supplemental Fig. S9 Reusability of MNPs@B(OH)2 for polysaccharide extraction. UV-vis spectra of TPS extractives obtained by continuous extraction for ten times (a) and the fluctuation of relative binding capacity of MNPs@B(OH)2 after ten consecutive extractions (b). Inset in (b) was the chromogenic photos of TPS extractives obtained by ten extractions. UV-vis spectra and digital photos were produced with the help of color development by phenyl-sulfuric acid method.
      • Supplemental Fig. S10 Optical microscopic imaging of A549 cells before and after treating with polysaccharide extractives. Treatments in (a-f): control group (a), trypan blue stained control group (b), LBPS treated group (c), trypan blue stained LBPS treated group (d), TPS treated group (e), and trypan blue stained TPS treated group (f). The concentration of polysaccharide extractives for cell treatment was set as 5.0 mg/mL.
      • Supplemental Table S1 Linear regression equations, relevant running parameters along with the tested relative purities (the purities of standard polysaccharides were used as references) of polysaccharides by UV-vis spectrometry.
      • Supplemental Table S2 Linear regression equations, their working parameters and the measured relative purities (the purities of standard polysaccharides were used as references) of polysaccharides by HPLC.
      • Copyright: © 2023 by the author(s). Published by Maximum Academic Press, Fayetteville, GA. This article is an open access article distributed under Creative Commons Attribution License (CC BY 4.0), visit https://creativecommons.org/licenses/by/4.0/.
    Figure (7)  References (43)
  • About this article
    Cite this article
    Ding Y, Li H, Liu T, Liu Y, Yan M, et al. 2023. Boronate affinity-mediated magnetic solid phase extraction and bioactivities of polysaccharides from beverage plants. Beverage Plant Research 3:14 doi: 10.48130/BPR-2023-0014
    Ding Y, Li H, Liu T, Liu Y, Yan M, et al. 2023. Boronate affinity-mediated magnetic solid phase extraction and bioactivities of polysaccharides from beverage plants. Beverage Plant Research 3:14 doi: 10.48130/BPR-2023-0014

Catalog

  • About this article

/

DownLoad:  Full-Size Img  PowerPoint
Return
Return