


-
Tea, Camellia sinensis (L.) O. Kuntze, is a perennial woody evergreen plant and is one of the oldest domesticated crops utilized in China, first as a medicine and then as a beverage as early as 2737 BC[1]. Although tea is known as a traditional Asian beverage, today tea is produced worldwide and is available in a range of products of which green (non-fermented), oolong (semi-fermented), black (fermented) tea are the most popular. Global tea production continues its steady increase, reaching 6.5 million metric tons (MT) in 2021. The top two producers, China and India, produced 3.1 and 1.3 million tons, respectively in 2021 (Food and Agriculture Organization, 2022,
http://faostat.fao.org/site/339/default.aspx ). With over 290 billion liters, tea is the world's most consumed beverage, outpacing bottled water, carbonated drinks, beer, and coffee. But, with a global retail value of just US${\$} $ ${\$} $ ${\$} $ The germplasm of tea are the building blocks for sustained development of high yielding cultivars with superior quality and resistance to pests, diseases, and environmental stresses for climate smart agriculture. Tea plants produce recalcitrant seeds therefore tea germplasm is typically maintained as living trees in ex situ genebanks. At least 15,000 of tea germplasm accessions are maintained by different universities/research institute throughout the world[1]. Since the late 1990s, molecular markers, especially co-dominant DNA markers have been widely used in molecular characterization of tea genetic resources[3], which has provided a powerful tool complementary to morphological, physiological, and chemical characterization and has significantly improved the understanding of tea genetic resources. However, recent advances in molecular technologies have made SNPs an attractive option for high throughput genotyping due to the relatively low cost per data point, the high abundance of SNPs in the genome, the locus specificity, codominance of SNPs, and the low genotyping error rate. In the past decade, SNP markers have been increasingly used in tea for varietal identification[4,5], construction of genetic map and QTL mapping[6], and assessment of genetic diversity[7,8].
It's generally accepted that the species C. sinensis (L.) O. Kuntze could be classified into two botanical varieties: var. sinensis (small leaved type) and var. assamica (broad leaved type). Based on population genomics analysis of 190 Camellia accessions, Zhang et al.[9] reported independent evolutionary histories and parallel domestication in var. sinensis and var. assamica. Within these two botanical varieties, there are many landraces, farmer selections and modern clonal varieties[1,9]. Population genetic and transcriptomic analyses reveal that during domestication, selection for disease resistance and flavor in var. sinensis populations has been stronger than that in var. assamica populations[10,11]. These two botanical varieties were raised to the status of species by Wight[12], who also advocated the recognition of a third taxon, the Cambod type (or 'Southern form', lasiocalyx type) which is native to Southeast Asia. The key morphological characteristics for the above proposed classification was leaf size and tree type, which presented large difference among the three proposed taxa and are highly inheritable. The 'sinensis types' are characterized by a bush with small leaves adaptable to cold temperatures, while 'assamica types' are tall trees with large leaves and less resistant to cold[12]. The 'lasiocalyx type'[13] has been treated as intermediate between the sinensis and assamica types[14,15] with intermediate leaf size turning red in Autumn[13]. As an outcrossing species, the three taxa can freely interbreed, resulting in a wide array of hybrids that are still generally referred to as assamica, lasiocalyx or sinensis types depending on the proximity of their morphological characteristics[16].
Controversy still exists regarding the classification of cultivated tea plant despite the numerous studies using molecular markers. While there is a good consensus regarding var. sinensis type and var. assamica type, the classification of assamica tea has not been fully clear. For example, the status of lasiocalyx tea as an independent taxon has been under debate. Using AFLP markers, Paul et al.[17] and Misra & Sen-Mandi[18] demonstrated a clear separation among the three taxa as sinensis type, assamica type and lasiocalyx type, which is consistent with Wright's classification of tea. Supporting evidence for lasiocalyx type as an independent taxon was also reported by Magoma et al.[19], who used catechins as biochemical markers in diversity studies of tea. Moreover, they showed that the lasiocalyx types had the highest catechin ratio among the three taxa.
However, the independent status of lasiocalyx type was not supported by some other studies using molecular markers[19,20]. Using 23 nuclear microsatellite markers, Meegahakumbura et al.[19] regrouped the studied accessions into three groups: var. sinensis, China assamica tea, and Indian assamica tea. In addition to these three groups, there was also an admixture group that included the lasiocalyx type. The lasiocalyx type did not form a distinct group in the STRUCTURE analyses but showed a mixed genetic composition of Chinese assamica tea and Indian assamica tea. Based on this result, Meegahakumbura et al.[19] conclude that the lasiocalyx type tea originated through hybridization between Indian assamica and Chinese assamica tea, thus should not be recognized as a natural taxon. The same conclusion was reached by Wambulwa et al.[20], where lasiocalyx type teas were shown as admixtures between Indian and Chinese assamica. Using the same SSR and cpDNA markers as reported by Wambulwa et al.[20], Meegahakumbura et al.[19] confirmed the existence of the three independent gene pools (var. sinensis, China var. assamica, and India var. assamica). Furthermore, a differentiation was detected between the var. assamica types from Southern Yunnan (Pu'er and Xishuang Banna) and those from Western Yunnan. The latter was grouped together with haplotypes of Indian var. assamica. They postulated that var. assamica tea from Western Yunnan and var. assamica tea from Assam India arose from a single ancestral origin from an area where Southwest China, Indo-Burma, and Tibet meet. The results still supported a separate domestication area for var. sinensis tea in Southern China, but its exact origin was still not clear[21].
In this context, it is very much essential to further understand the genetic diversity and population structure in C. sinensis var. assamica for efficient conservation and use of assamica tea germplasm in crop improvement program. China and India are the two largest tea producers in the world and are rich in tea genetic resources. Thorough understanding of genetic diversity of assamica tea germplasm in China and India is essential for sustainable conservation and use of tea germplasm for breeding new varieties with resistance/tolerance to biotic and abiotic stresses and improved quality attributes.
The Tocklai Experimental Station (Presently Tocklai Tea Research Institute, TTRI) Tea Research Association, India possesses one of the most extensive collections of tea germplasm from both national and international sources[22]. Since 1911, the year of establishment of the TTRI, the tea germplasm collection at Tocklai has been augmented by numerous introductions over time, with the addition of several foreign genotypes, clones from South India and promising plants from tea estates from different agro-climatic conditions and tissue culture derived plants. Today, the Tea Research Association has around 3,065 tea germplasm accessions maintained at its different substations: Tocklai Tea Research Institute, Jorhat, Assam (1,871 accessions), North Bengal Regional Research and Development Centre (NBRRDC), Nagrakata, West Bengal (934 accessions) and Clonal Proving Station (CPS), Ging Tea Estate, West Bengal, India (260 accessions).
In this study we have utilized 150 SNP markers to analyze 252 tea accessions including 94 tea accessions with diverse background from TTRI, India and compared them with 130 assamica type tea from ancient tea gardens in Southwest and Southeast Yunnan. In addition, we included 28 accessions of typical small leaf sinensis type (var. sinensis) from Eastern China, to provide a reference group for the analysis. Our objectives were: i) to understand the genetic diversity and population structure in the assamica tea germplasm from India and China; and ii) to assess the efficacy of current classification system for tea. The resultant information would form the basis on which a more accurate and efficient management and utilization of genetic resources of this important crop can be achieved.
-
A total of 252 tea accessions from India and China were used in the present investigation (Table 1). Among 94 Indian germplasm, 37 were morphologically classified as original India assamica type, which were indigenous to India. In addition, there are 18 accessions of lasiocalyx type or 'Southern form', which have long been recognized by curators and breeders based on their morphological characteristics and horticultural traits. These lasiocalyx type of tea germplasm were introduced into India from Indochina in the year 1917 or progeny of these original introduction[22]. The third group from Indian germplasm includes 39 known hybrid accessions with admixed pedigrees. Out of the 130 var. assamica accessions from China, 38 were collected from an ancient tea garden in Jingmai mountain, Pu'er city and 16 were from an ancient tea garden in Mangshi, Dehong prefecture. Both sites were in Southwest Yunnan. From Southeast Yunnan, two wild populations were sampled from Jinping (Honghe city) and Malipo (Wenshan city). Lastly, we included 28 accessions of C. sinensis var. sinensis as a reference set in the analysis. These are traditional cultivars from Eastern China, including Zhejiang, Jiangsu, and Anhui provinces (Table 1).
Table 1. Sample name, sample size, source and location of tea germplasm analyzed using SNP markers.
Taxa Number
of sampleSource/
locationType of
germplasmIndia Assam (var. assamica) 37 TTIR, Assam, India Genebank Cambod (var. assamica) 18 TTIR, Assam, India Genebank Breeding line (hybrids) 39 TTIR, Assam, India Genebank C. sinensis var. sinensis 28 Hangzhou, China Genebank China var. assamica 38 Jingmai, Yunnan, China Ancient tea garden China var. assamica 16 Mangshi, Yunnan Ancient tea garden China var. assamica 41 Jinping, Yunnan, China Wild population China var. assamica 35 Malipo, Yunnan, China Wild population Total 252 DNA extraction and SNP genotyping
-
For the leaf samples from China, DNA was extracted from dried tea leaves with the DNeasy Plant Kit (Qiagen Inc., Valencia, CA, USA), which is based on the use of silica as an affinity matrix. The dry leaf tissue was placed in a 2-mL micro centrifuge tube with one-inch ceramic sphere and 0.15 g garnet matrix (Lysing Matrix A; MP Biomedicals, Solon, OH, USA). The leaf samples were disrupted by high-speed shaking in a TissueLyser II (Qiagen Inc.) at 30 Hz for 1 min with 25 mg polyvinylpolypyrrolidone. Lysis solution (1,600 μL) (DNeasy Stool kit buffer AP1), was added to the powdered leaf samples and the mixture was incubated at 70 °C for 20 min with shaking of the solution at 5 min intervals. The remainder of the extraction method followed manufacturer's suggestions. DNA was eluted from the silica column with two washes of 50 mL Buffer AE, which were pooled, resulting in 100 mL DNA solution. Using a NanoDrop spectrophotometer (Thermo Scientific, Wilmington, DE, USA), DNA concentration was determined by absorbance at 260 nm. DNA purity was estimated by the 260:280 ratios and the 260:230 ratios. For the 94 germplasm accessions from TTRI, Assam, India, high quality DNA was extracted following the CTAB method[23] and the DNA was shipped to USDA, MD, USA to be included in the investigation.
The procedure for development of SNPs through data mining was as described in Fang et al.[4,5]. A total of 150 prescreened SNP sequences were submitted to the Assay Design Group at Fluidigm Corporation (South San Francisco, CA, USA) for design and manufacture of primers for a SNPtypeTM genotyping panel. The SNP loci, their genomic position and flanking sequences were presented in Supplementary Table S1. The protocol for SNP genotyping used the Fluidigm 96.96 Dynamic ArrayTM (Fluidigm, San Francisco, CA, USA). Each 96.96 Dynamic Array can run 96 samples against 96 SNP assays generating a total of 9,216 data points in a single experiment. One key feature of this protocol is the inclusion of a specific targeted amplification (STA) reaction[24], which allows the enrichment of template molecules for each individual Integrated Fluidic Circuit® (IFC) reaction that facilitates the multiplexing during genotyping. An advantage to STA is that it allows the use of limited or low-quality DNA samples and reduces bias that may occur when samples are loaded to the 96 sample wells of the IFC. Since tea leaf tissues contain high levels of polyphenolic compounds that can potentially inhibit PCR amplification, the STA step was strongly recommended. The STA reaction was performed as described in the Fluidigm SNP Genotyping User Guide, PN 68000098 Rev I[25]. The STA master mix consisted of 2.5 µL of TaqMan® Taq polymerase (Life Technologies, Carlsbad, CA, USA), PreAmp Master Mix (2X), 1.25 µL of Pooled assay mix (0.2 X), and 1.25 µL of genomic DNA for a total reaction volume of 5.0 µL.
PCR was performed with an initial denaturation step of 95 °C for 10 min, followed by 14 cycles of a 2-step amplification profile consisting of 15 s at 95 °C and 4 min at 60 °C. The resulting amplified DNA was then diluted 1:5 in TE buffer to reduce the concentration of any remaining PCR by-products. Samples were then genotyped using the nanofluidic 96.96 Dynamic ArrayTM IFC (Integrated Fluidic Circuit; Fluidigm Corp.). The 96.96 Dynamic Array IFC for SNP genotyping was described by Wang et al.[24]. End-point fluorescent images of the 96.96 IFC were acquired on an EP1TM imager (Fluidigm Corp.). The data was recorded with Fluidigm Genotyping Analysis Software (Fluidigm, San Francisco, CA, USA).
Data analysis
-
Raw data was organized in Microsoft Excel 2007 for each SNP locus and sample call. Quality control criteria (data filtering) were performed using the software SNP & Variation Suite v8.x (Golden Helix, Inc., Bozeman, MT, USA,
www.goldenhelix.com ). SNP having less than a 95% overall amplification was excluded from the dataset. The retained data set was presented in Supplementary Table S2.Population structure of the tea samples was determined using a model-based Bayesian cluster analysis software STRUCTURE v2.3.422. The analysis was carried out in three steps. We used the admixture model, and the analyses were carried out without assuming any prior information about the genetic groups or geographic origins of the samples. Ten independent runs were assessed for each fixed number of clusters (K value) ranging from 1 to 10, each consisting of 100,000 iterations after a burn-in of 200,000 iterations. The most probable number of clusters was detected using the methods of Evanno et al.[26], as well as the method of Puechmaille[27]. The computation was performed using the on-line program STRUCTURESELECTOR[28]. For the Puechmaille[27] method, we used a mean membership threshold value of 0.5 after testing values between 0.5 and 0.8. The program STRUCTURE SELECTOR was also used to visualize the graphical representations of specific K by running CLUMPAK[29] on the selected K.
The consistency of the clusters identified through the STRUCTURE approach was tested by Analysis of Molecular Variance (AMOVA), as implemented in the programs GenAlex 6.5[30]. The significance of Φ statistics (analogous to Wright's F-statistics), was tested using 9999 random permutations. In addition, the fixation index (FST) for each pair of core germplasm groups was calculated and the statistical significance was tested using permutations with the program GenAlEx 6.5[30,31].
Key summary statistics viz. observed heterozygosity and expected heterozygosity were calculated for each core germplasm group using program GenAlEx 6.5[31]. To provide a complementary illustration of the genetic relationships among germplasm groups, a distance-based multivariate analysis was performed on the parental populations. Pairwise genetic distances were computed using the Distance option, and Principal Coordinates Analysis (PCoA) within the GenAlEx 6.5program. Both distance and covariance were standardized. The PCoA results are presented as two-axis PCO plots, and both plots axis 1 vs 2 and axis 1 vs 3 are presented separately.
To further examine the genetic relationship among the different germplasm groups, a neighbor-joining (NJ) clustering analysis was performed. Nei's distance[32] was chosen as genetic distance measurement for the individual accessions with the program MICROSATELLITE ANALYZER[33]. The distance was bootstrapped 999 times. Dendrograms were generated using the NJ algorithm available in PHYLIP version 3.697[34] and the resultant consensus tree was visualized using the program Fig Tree v1.4.3[35].
-
The most probable number of genetically distinct groups (K) was six and seven (MedMedK, MedMeaK, MaxMedK, MaxMeaK; Fig. 1a) using Puechmaille's method as implemented in STRUCTURESELECTOR[28]. When K = 7, there are only six populations that have fully assigned membership (Q-value > 0.95). The returned value is consistent when the threshold option was changed from 0.5 to 0.8, as described in STRUCTURESELECTOR[28]. However, the most probable clusters determined by the method of Evanno et al.[26 ] is three (Fig. 1b). For this reason, the results of K = 3 and K = 6 were both presented (Fig. 2a & b).
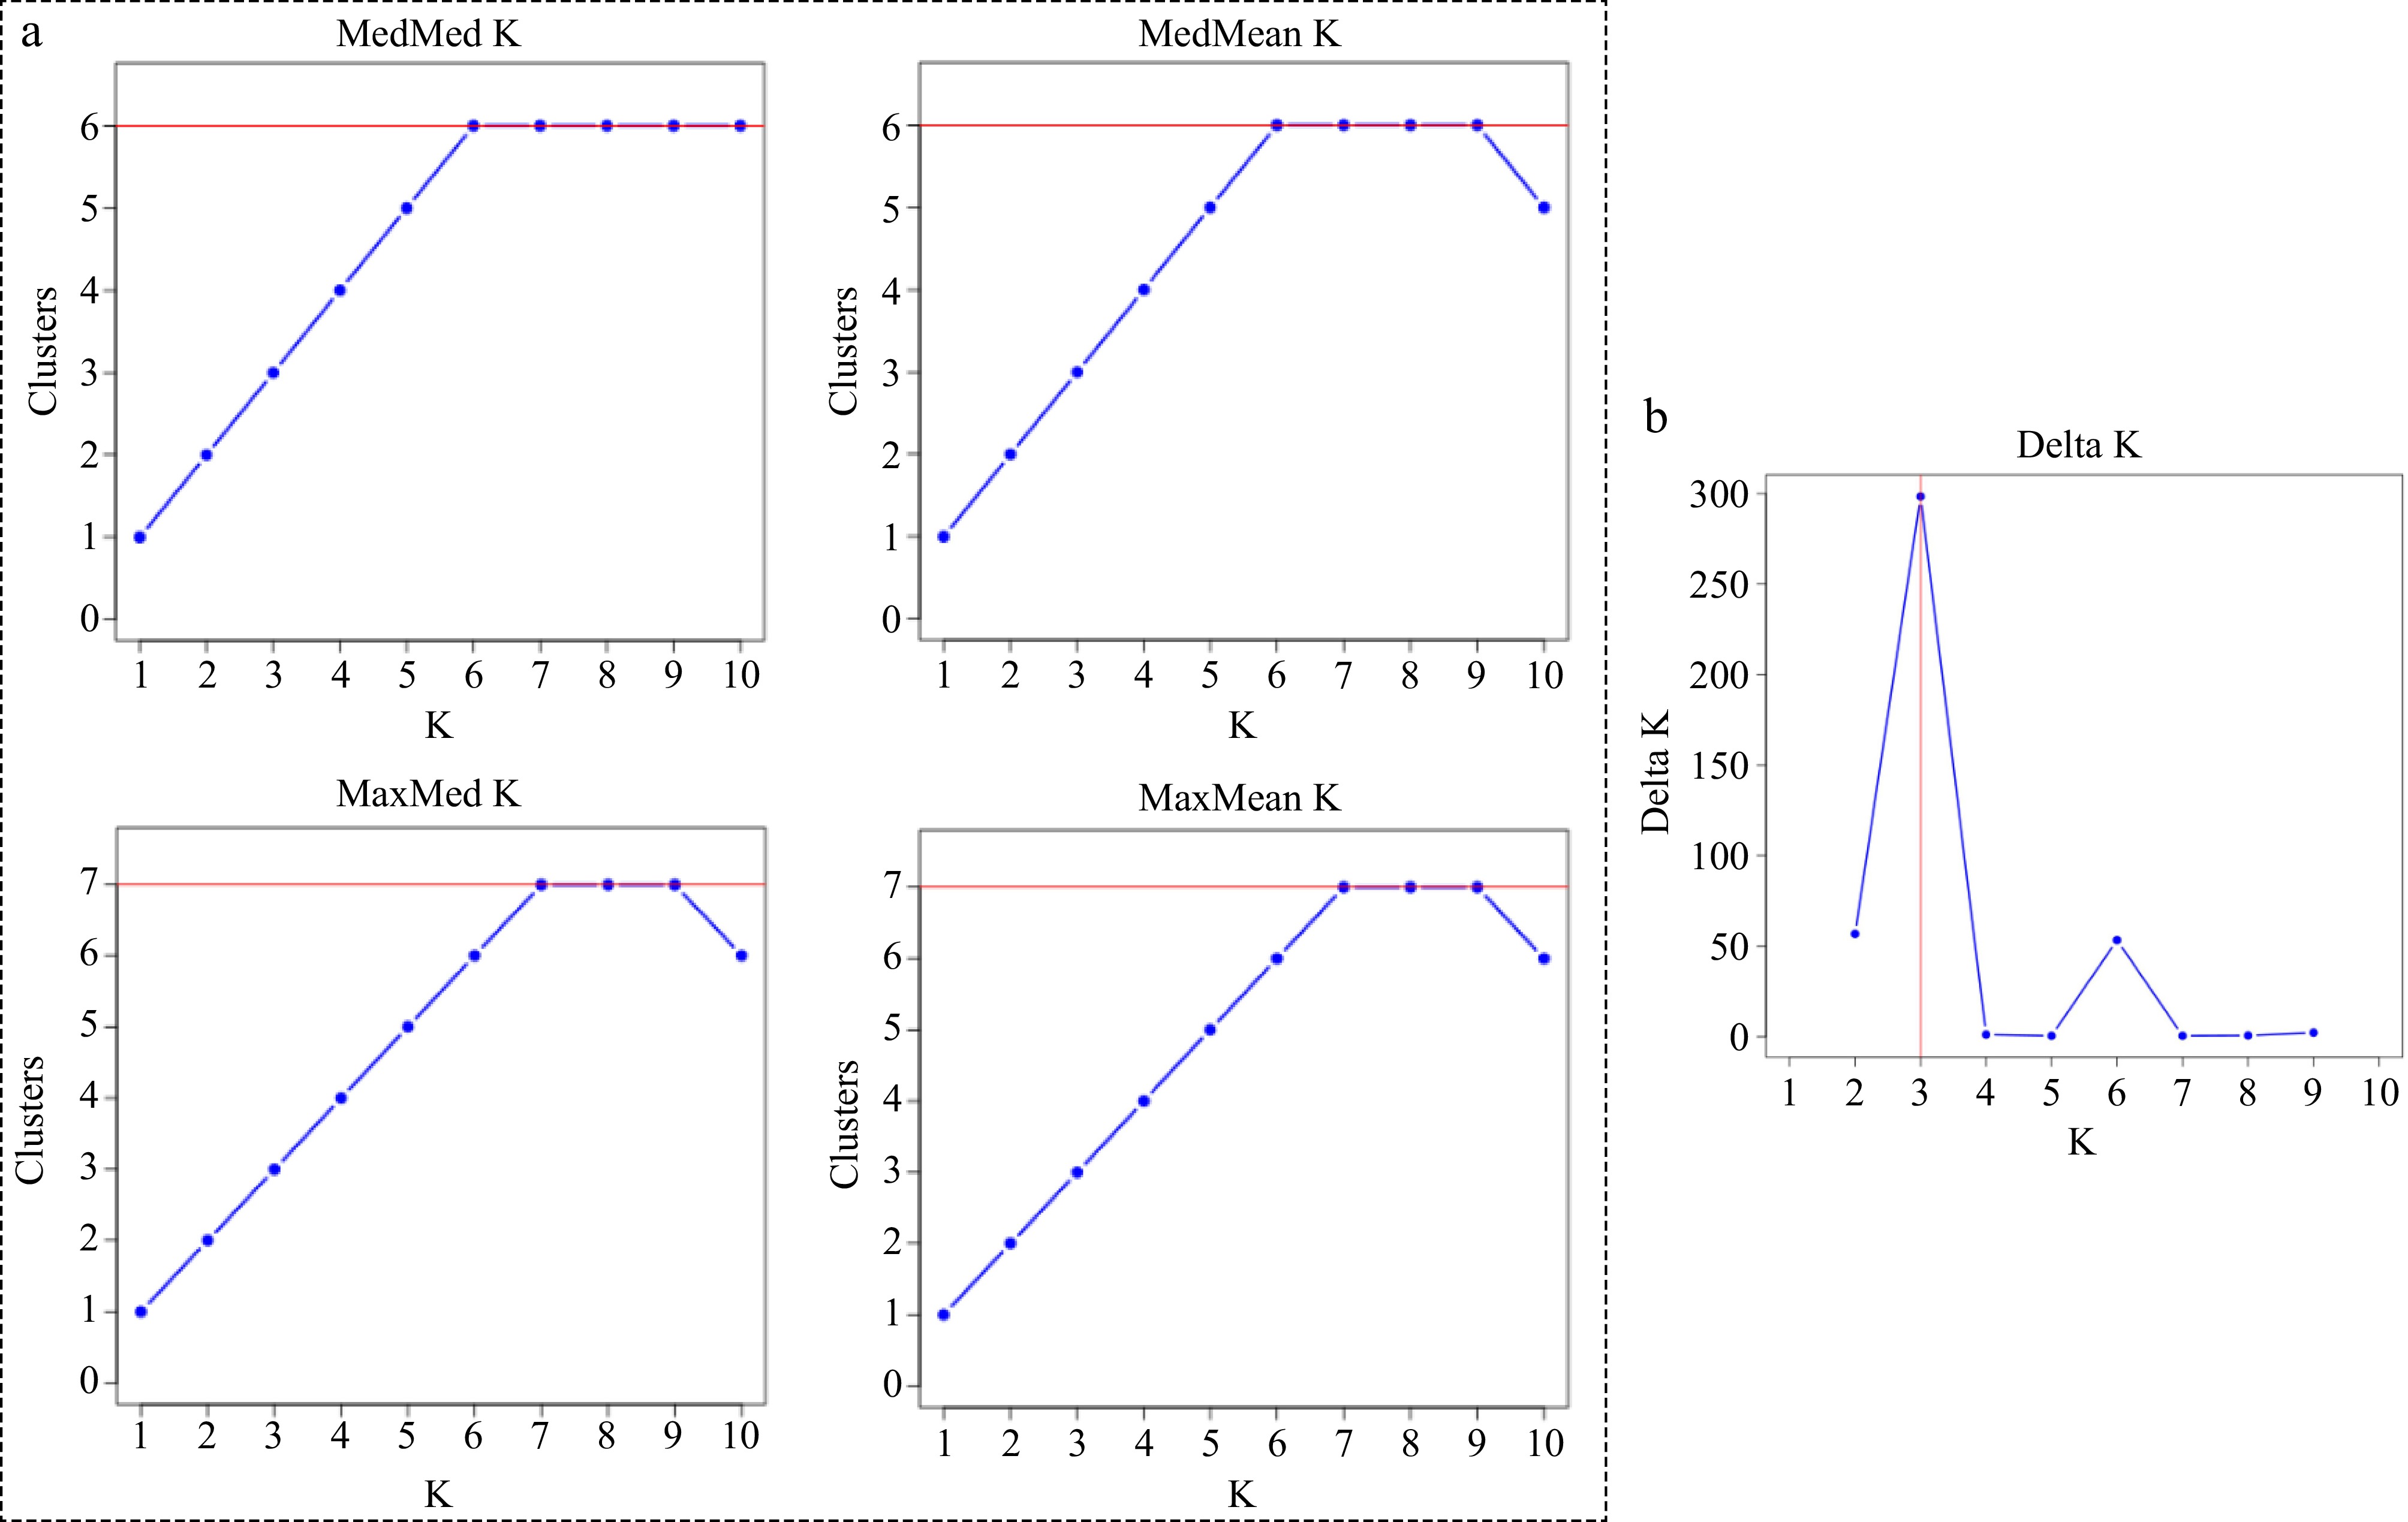
Figure 1.
(a) The most probable number of genetically distinct groups (MedMedK, MedMeaK, MaxMedK, MaxMeaK) using Puechmaille's method as implemented in STRUCTURESELECTOR[29]. (b) Plot of Delta K (filled circles, solid line) calculated as the mean of the second-order rate of change in likelihood of K divided by the standard deviation of the likelihood of K, m(|L(K)|)/s [L(K)].
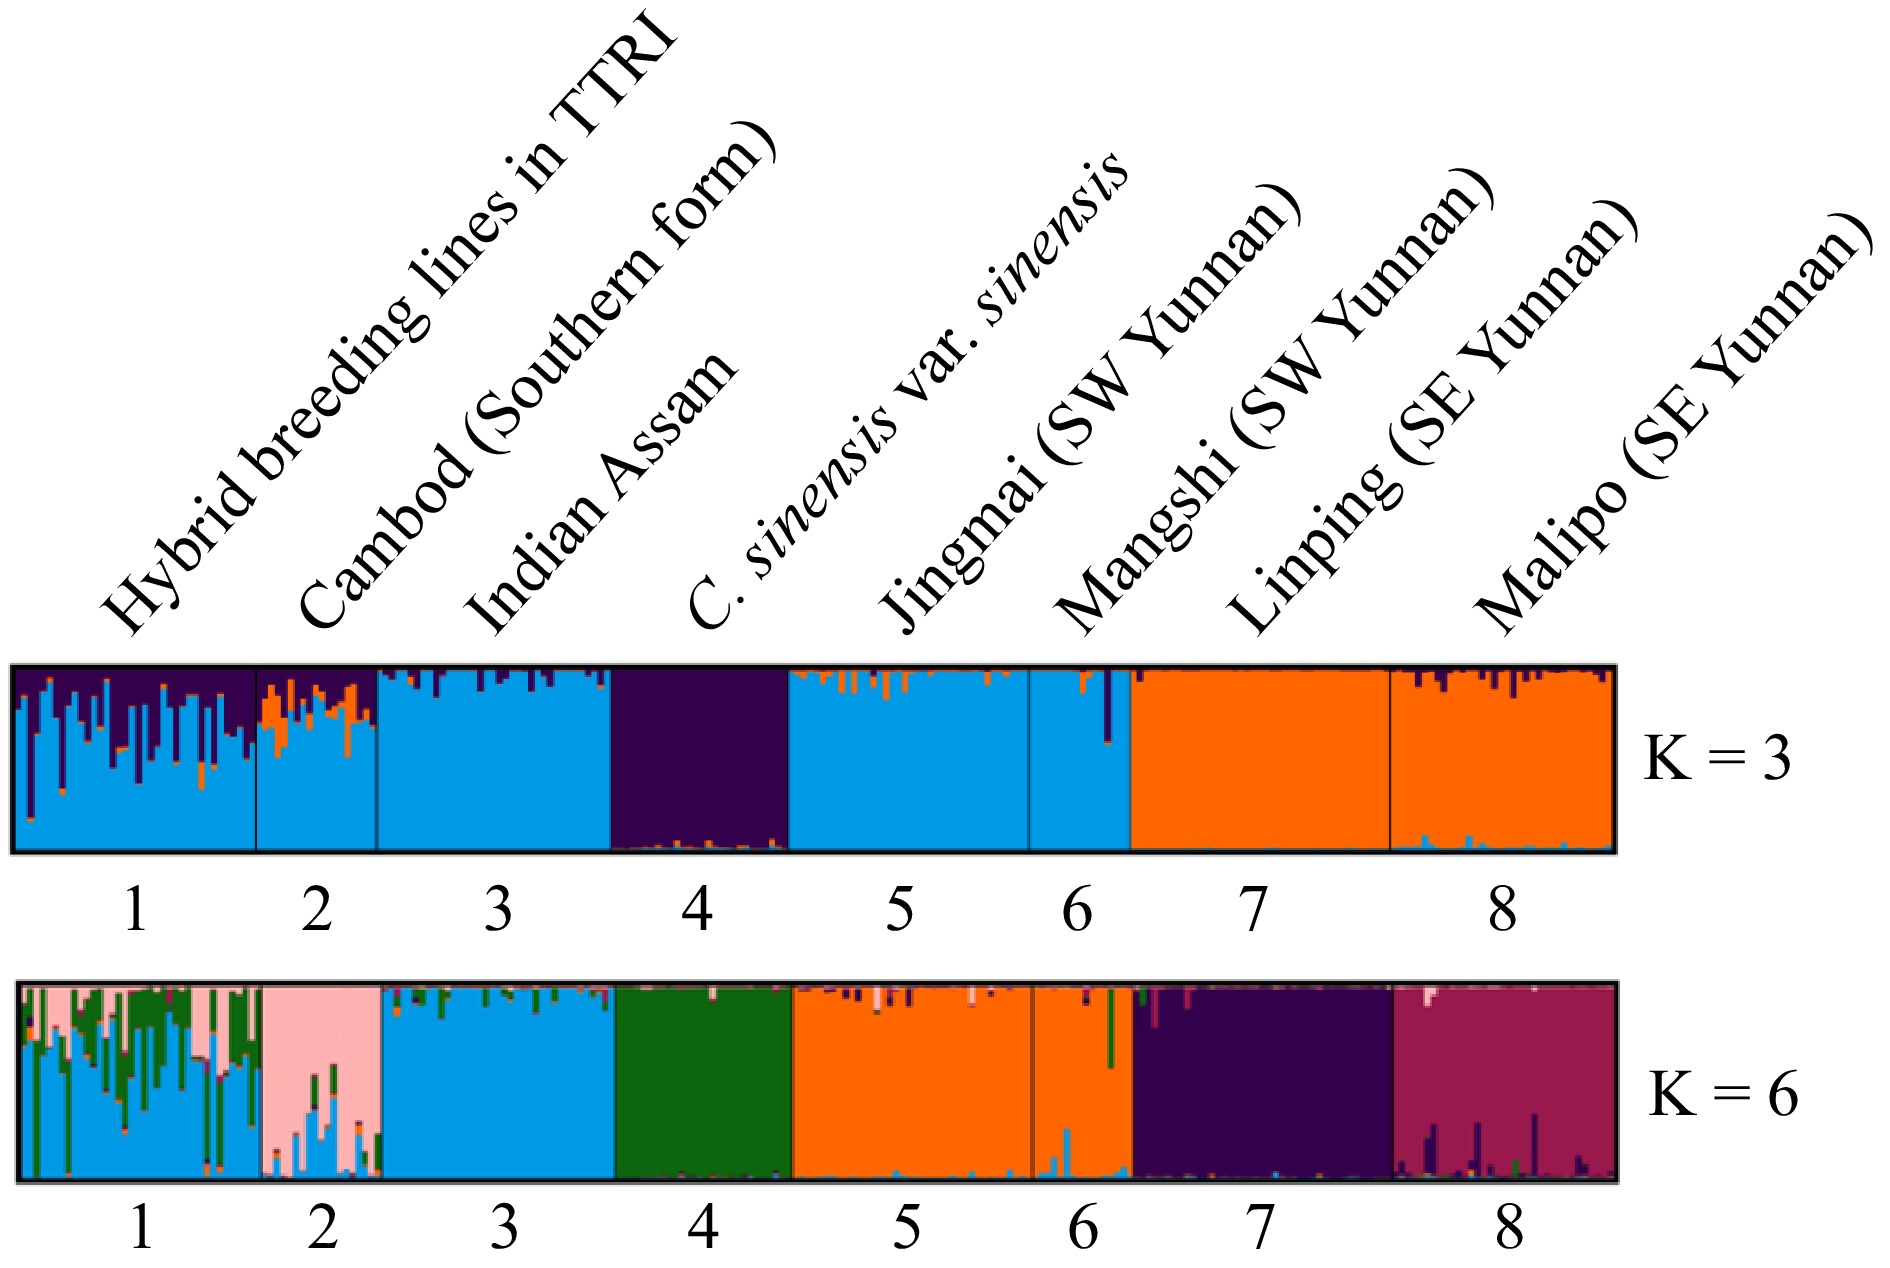
Figure 2.
Population structure of the seven tea germplasm groups using STRUCTURE, where K = 3 and K = 6. Bar plot of reference groups to which the tea samples are descendants of. Each color represents a distinct ancestral germplasm group (or population). Black vertical lines indicate the separation of the genetic groups. Genotypes with multiple colors are denoted as admixed genotypes or inter-population hybrids.
At K = 3, the partitioning among the eight germplasm groups, comprising of 252 accessions, could be viewed as the sinensis type (var. sinensis), vs two groups of assamica type (var. assamica). The first group of var. assamica include populations from India, Cambod and Southwest Yunnan (Jingmai and Mangshi), whereas the second group include var. assamica from Southeast Yunnan (Jingping and Malipo). The result was highly compatible with the morphological classification and passport data regarding var. assamica and var. sinensis.
At K = 6, the partitioning result, based on STRUCTURE, was highly compatible with their known classification of tea germplasm groups, which was based on morphological characteristics and geographical origin. All the var. sinensis accessions were grouped into the first cluster, which is highly differentiated from the rest of the assamica tea accessions. The second group is the India var. assamica, which were mostly originated from Assam, India. This group included some accessions collected from primary forest, tribal villages, and old tea gardens from the hilly regions of Northeast India and along the Indo-Burma boarder. The third group is the Cambod assamica teas. Among this cluster were several accessions with typical Cambod characters of morphology such as 124.35.18, a stock developed from the original stock 19/22 collected from Indochina and 270.3.11, a selection from the hybrid progeny developed by crossing a sinensis hybrid clone and a lasiocalyx clone (14.7.17 × 124.27.11)[36]. The Cambod assamica cluster also includes several Tocklai Vegetative (TV) clones from India, such as TV 23, TV 25, TV 26, TV 27, TV 28 and TV 29. These TV clones are advanced clones selected from introduced germplasm with Cambod background or are developed from a hybridization program involving Cambod germplasm and they are widely used in tea production in India. The 4th cluster included the var. assamica from the ancient tea gardens in Jingmai and Mangshi, which were grouped together representing Southwest Yunnan. The 5th and 6th cluster include var. assamica from Jinping and Malipo in Southeast Yunnan (Fig. 2), exhibiting clear differences of this group from the assamica tea from Southwest Yunan.
The admixed ancestry of the putative hybrid accessions from TTRI were dominantly explained by the top three groups (India assamica, var. sinensis and lasiocalyx) which had a combined parentage contribution of more than 95% (Table 2). Among them, the Indian Assam apparently made most parentage contribution to these hybrids (54.9%), followed by var. sinensis (28.1%) and Cambod assamica (14.0%). The contribution from var. assamica of Southwest Yunnan (Jingmai and Mangshi) and Southeast Yunnan (Jingping and Malipo) to the TTRI hybrids is negligible (Table 2). The extensive admixture in the advanced germplasm demonstrated a combination of different genetic background in these breeding lines and advanced clones. The revealed ancestry/parentage in these hybrids, however, also demonstrated little introgression from either Southwest Yunnan or Southeast Yunnan, illustrating a major gap in using China var. assamica germplasm in tea breeding program in India.
Table 2. Inferred parentage/ancestry for 39 hybrid breeding lines from Tocklai tea germplasm collection, Assam, India based on six populations, using Bayesian clustering analysis.
Name India Assam Cambod var. sinensis China C. sinensis var. assamica Jingmai & Mangshi Malipo Jinping Tingaliam 0.677 0.095 0.208 0.013 0.004 0.002 111/1 0.720 0.008 0.146 0.065 0.004 0.058 128.26.2 0.002 0.288 0.703 0.002 0.003 0.002 14.06.28 0.636 0.009 0.343 0.004 0.005 0.003 19.56.27 0.674 0.315 0.002 0.002 0.002 0.004 19.61.36 0.771 0.206 0.001 0.012 0.007 0.002 292/60 0.545 0.259 0.189 0.003 0.003 0.001 317/3 0.007 0.383 0.573 0.014 0.015 0.007 7.3 0.780 0.016 0.185 0.012 0.004 0.003 B.9F 1/9 0.732 0.143 0.079 0.010 0.033 0.002 B.9F 2/10 0.608 0.085 0.268 0.023 0.009 0.007 Bagh 10 0.577 0.011 0.389 0.006 0.006 0.011 MORNAI 3 0.804 0.009 0.162 0.018 0.004 0.004 N 79 0.440 0.269 0.258 0.011 0.011 0.011 N-89 0.822 0.149 0.008 0.010 0.007 0.004 Namdag 1 0.375 0.051 0.545 0.024 0.003 0.003 Namdag 12 0.184 0.389 0.358 0.036 0.020 0.013 nf100 0.517 0.022 0.420 0.009 0.024 0.009 OPS of Betz 0.774 0.020 0.190 0.010 0.003 0.003 P 126 0.341 0.017 0.619 0.011 0.008 0.004 P38 0.788 0.004 0.198 0.006 0.002 0.002 R/D-3/27 0.458 0.043 0.487 0.004 0.004 0.003 R94 0.583 0.004 0.406 0.003 0.002 0.002 S.13C 1/5 0.866 0.011 0.034 0.004 0.077 0.008 S.3A/5 0.802 0.009 0.182 0.003 0.001 0.003 Sikim 1 DJ 0.461 0.018 0.501 0.003 0.011 0.006 SRI LANKA 4 0.782 0.004 0.206 0.004 0.002 0.002 SS 28 0.604 0.371 0.008 0.006 0.007 0.004 SS 42 0.600 0.375 0.008 0.006 0.007 0.003 STOCK 400 0.009 0.386 0.443 0.062 0.080 0.021 T.3E/14 0.755 0.015 0.214 0.009 0.004 0.003 T383 0.025 0.473 0.423 0.032 0.041 0.005 T3E3 0.524 0.447 0.011 0.004 0.008 0.006 TA 17 0.595 0.031 0.357 0.006 0.006 0.004 Thowra/2-11 0.560 0.058 0.365 0.012 0.003 0.001 TJ 37 0.639 0.004 0.335 0.013 0.005 0.003 TRA/D/SNT 1 0.254 0.292 0.438 0.010 0.004 0.002 UPASI 1 0.564 0.018 0.404 0.006 0.003 0.004 Cj 17 0.657 0.019 0.053 0.168 0.051 0.052 Mean 0.552 0.137 0.275 0.017 0.013 0.007 Based on the result of STRUCTURE analysis, we use Q > 0.70 as a threshold to select the core members of each genetic clusters and performed a Principal Coordinate Analysis (PCoA, Fig. 3a−b). In total, 248 (out of 252) accessions were qualified as the core members representing the six germplasm lineages, including (1) var. sinensis, (2) India var. assamica, (3) lasiocalyx type, (4) Southwest Yunnan (Jingmai and Mangshi) var. assamica, (5) Jinping, Yunnan var. assamica, and (6) Malipo, Yunnan var. assamica. The result of PCoA was highly compatible with STRUCTURE analysis and provided a complementary illustration of the clear division among the six genetic lineages. The plane of the first three main axes accounted for a total of 61.3% of total variation (41.8%, 14.9%, and 4.6% for axis 1, 2 and 3 respectively).
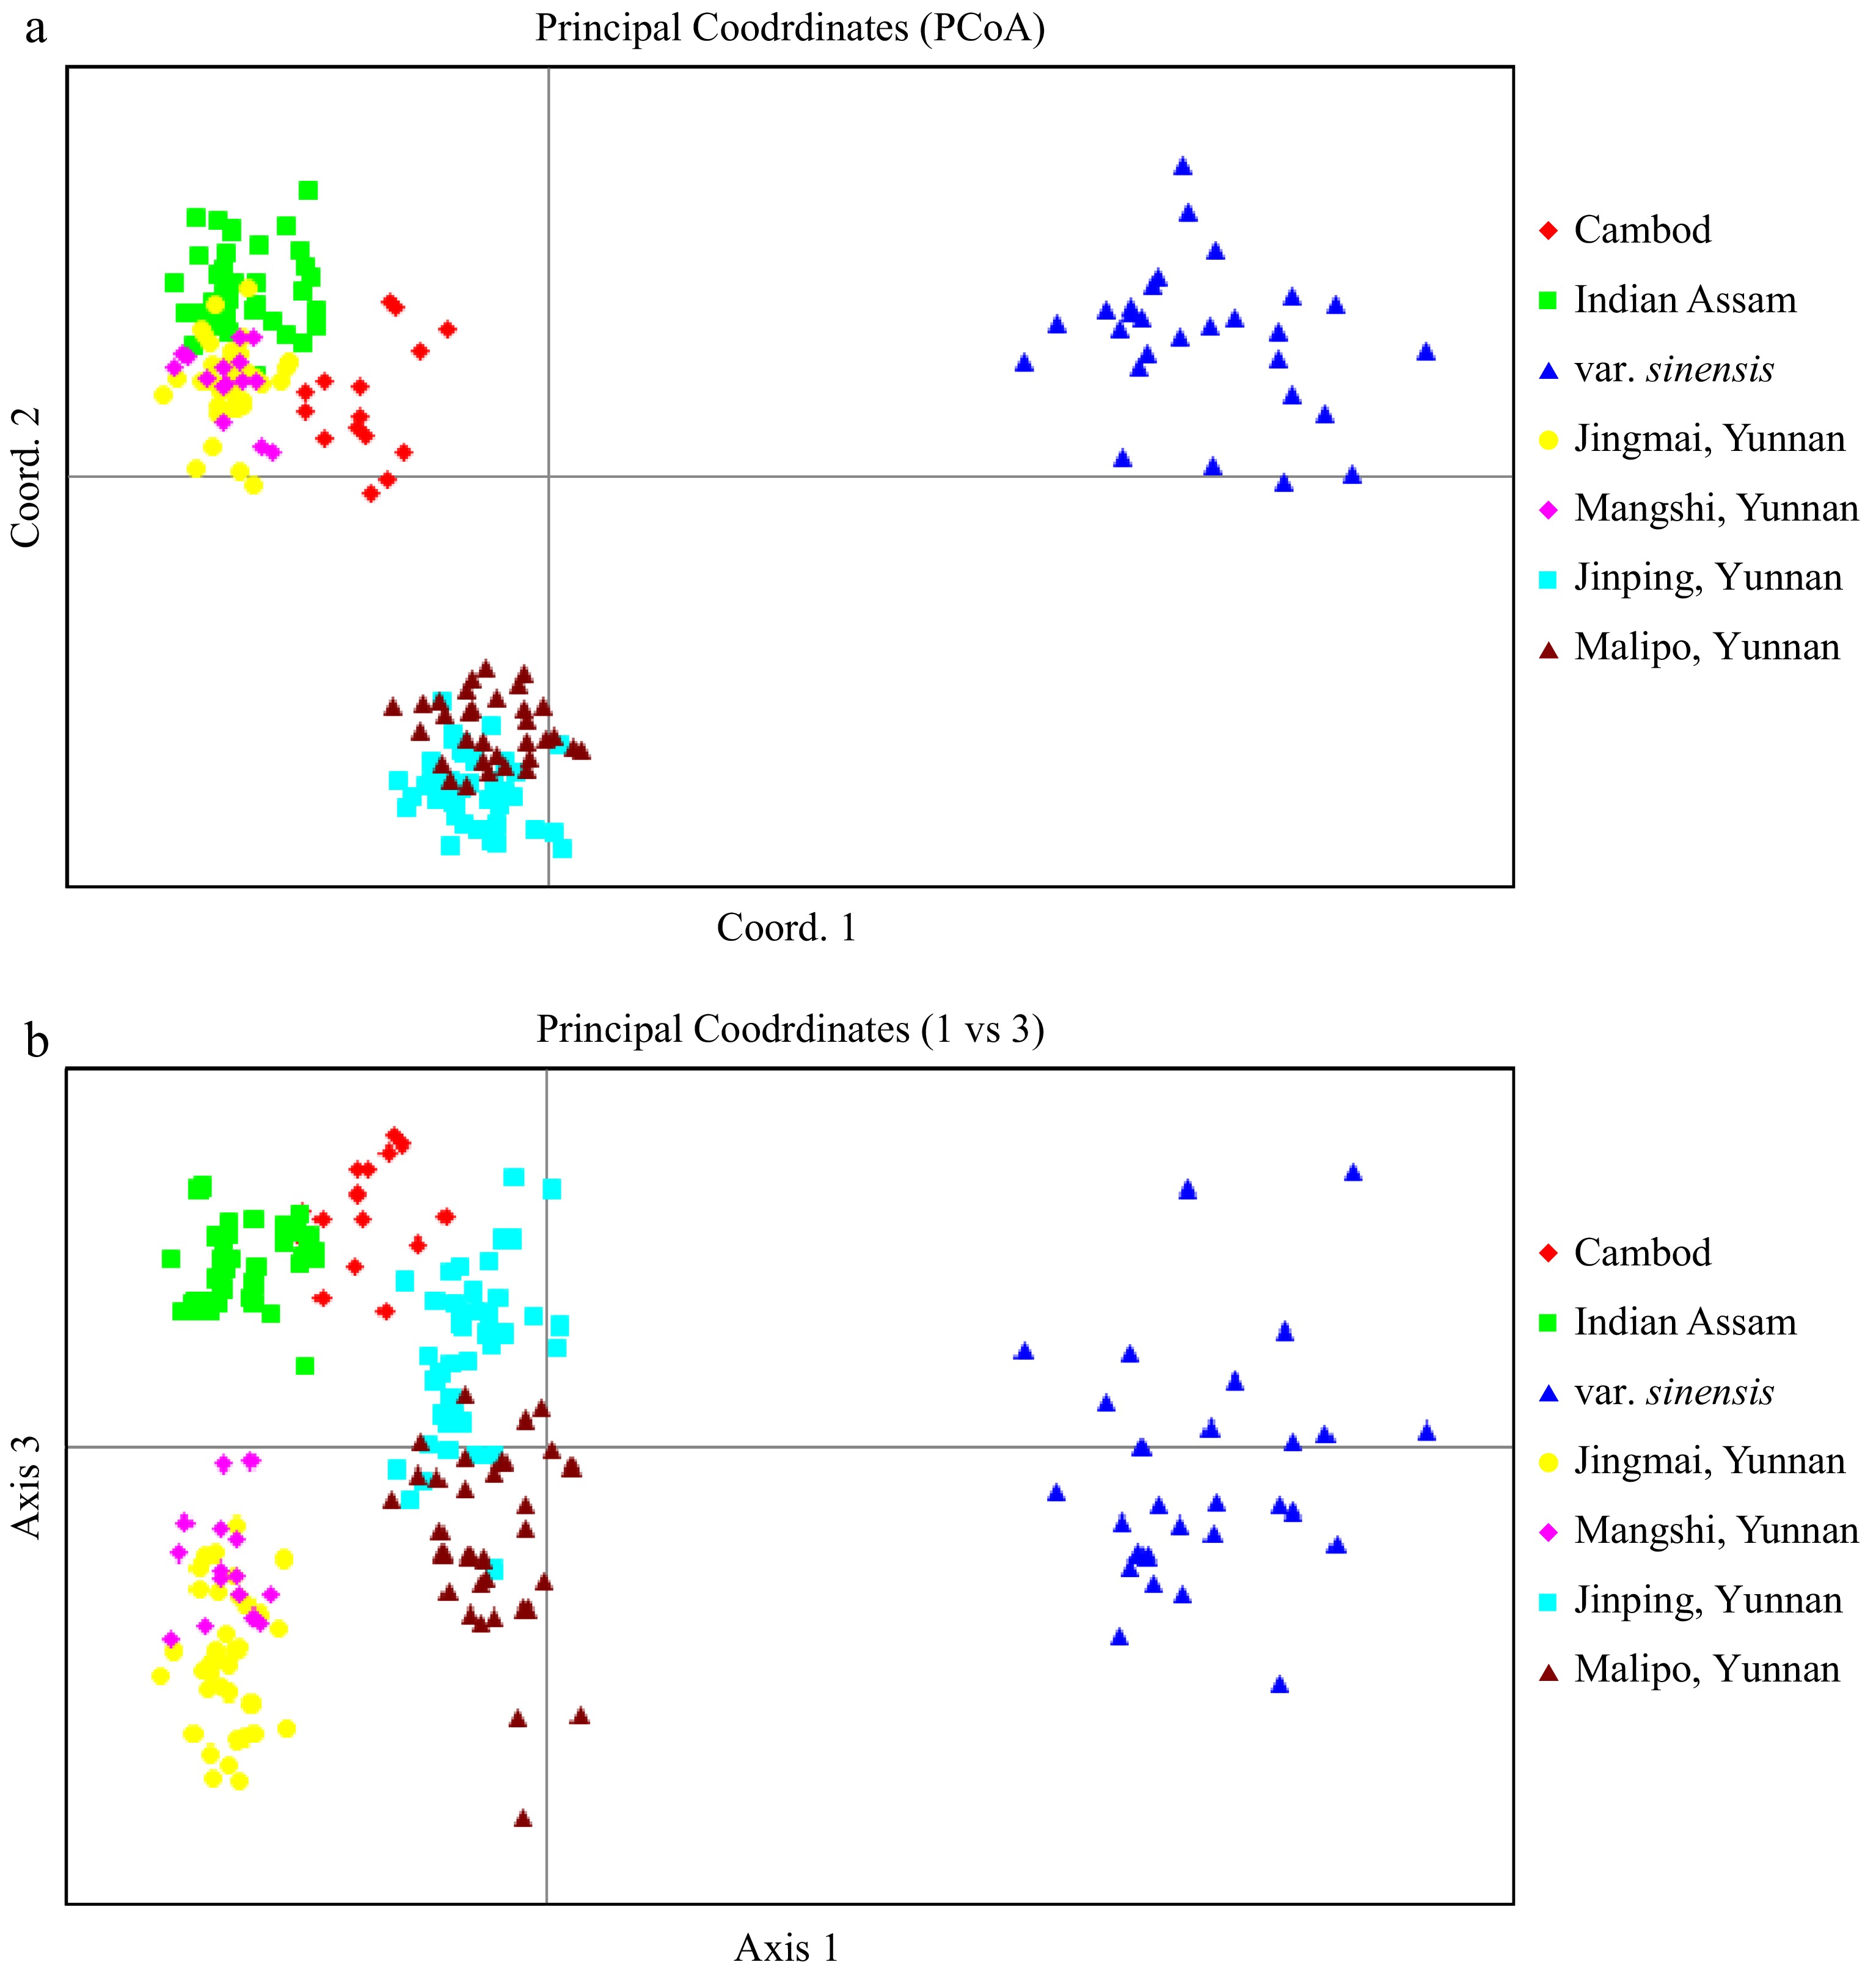
Figure 3.
PCoA plot of tea accessions from Tocklai Tea Research Inst in Assam India, ancient tea gardens and wild populations from Yunnan China, as well as the C. sinensis var sinensis from Chinese national tea collection. All hybrids classified by STRUCTURE analysis (Q value < 0.70) were excluded in the analysis. The plane of the first three main PCO axes accounted for 61.0% of total variation (First axis = 41.1% of total information, the second = 11.9% and the third = 8.0%).
The Neighbor-Joining tree (Fig. 4) provided complementary information regarding the inter-population relationships. The clustering pattern is largely consistent with the result of PCoA and STRUCTURE stratification. The two wild populations (Jinping and Malipo) from southeast Yunnan formed one larger cluster, whereas the two domesticated populations (Jiangmai and Mangshi) from Southwest Yunnan grouped together with India assamica and lasiocalyx type. Geographically also, southwest Yunan is closed to the regions of northeast India from where population of wild tea are reported. All the branches were supported by the bootstrapping value above 50%, ranging from 54 to 100 in the consensus tree (Fig. 4). In addition, a detailed NJ tree including all accessions was presented as Supplementary Fig. S1.
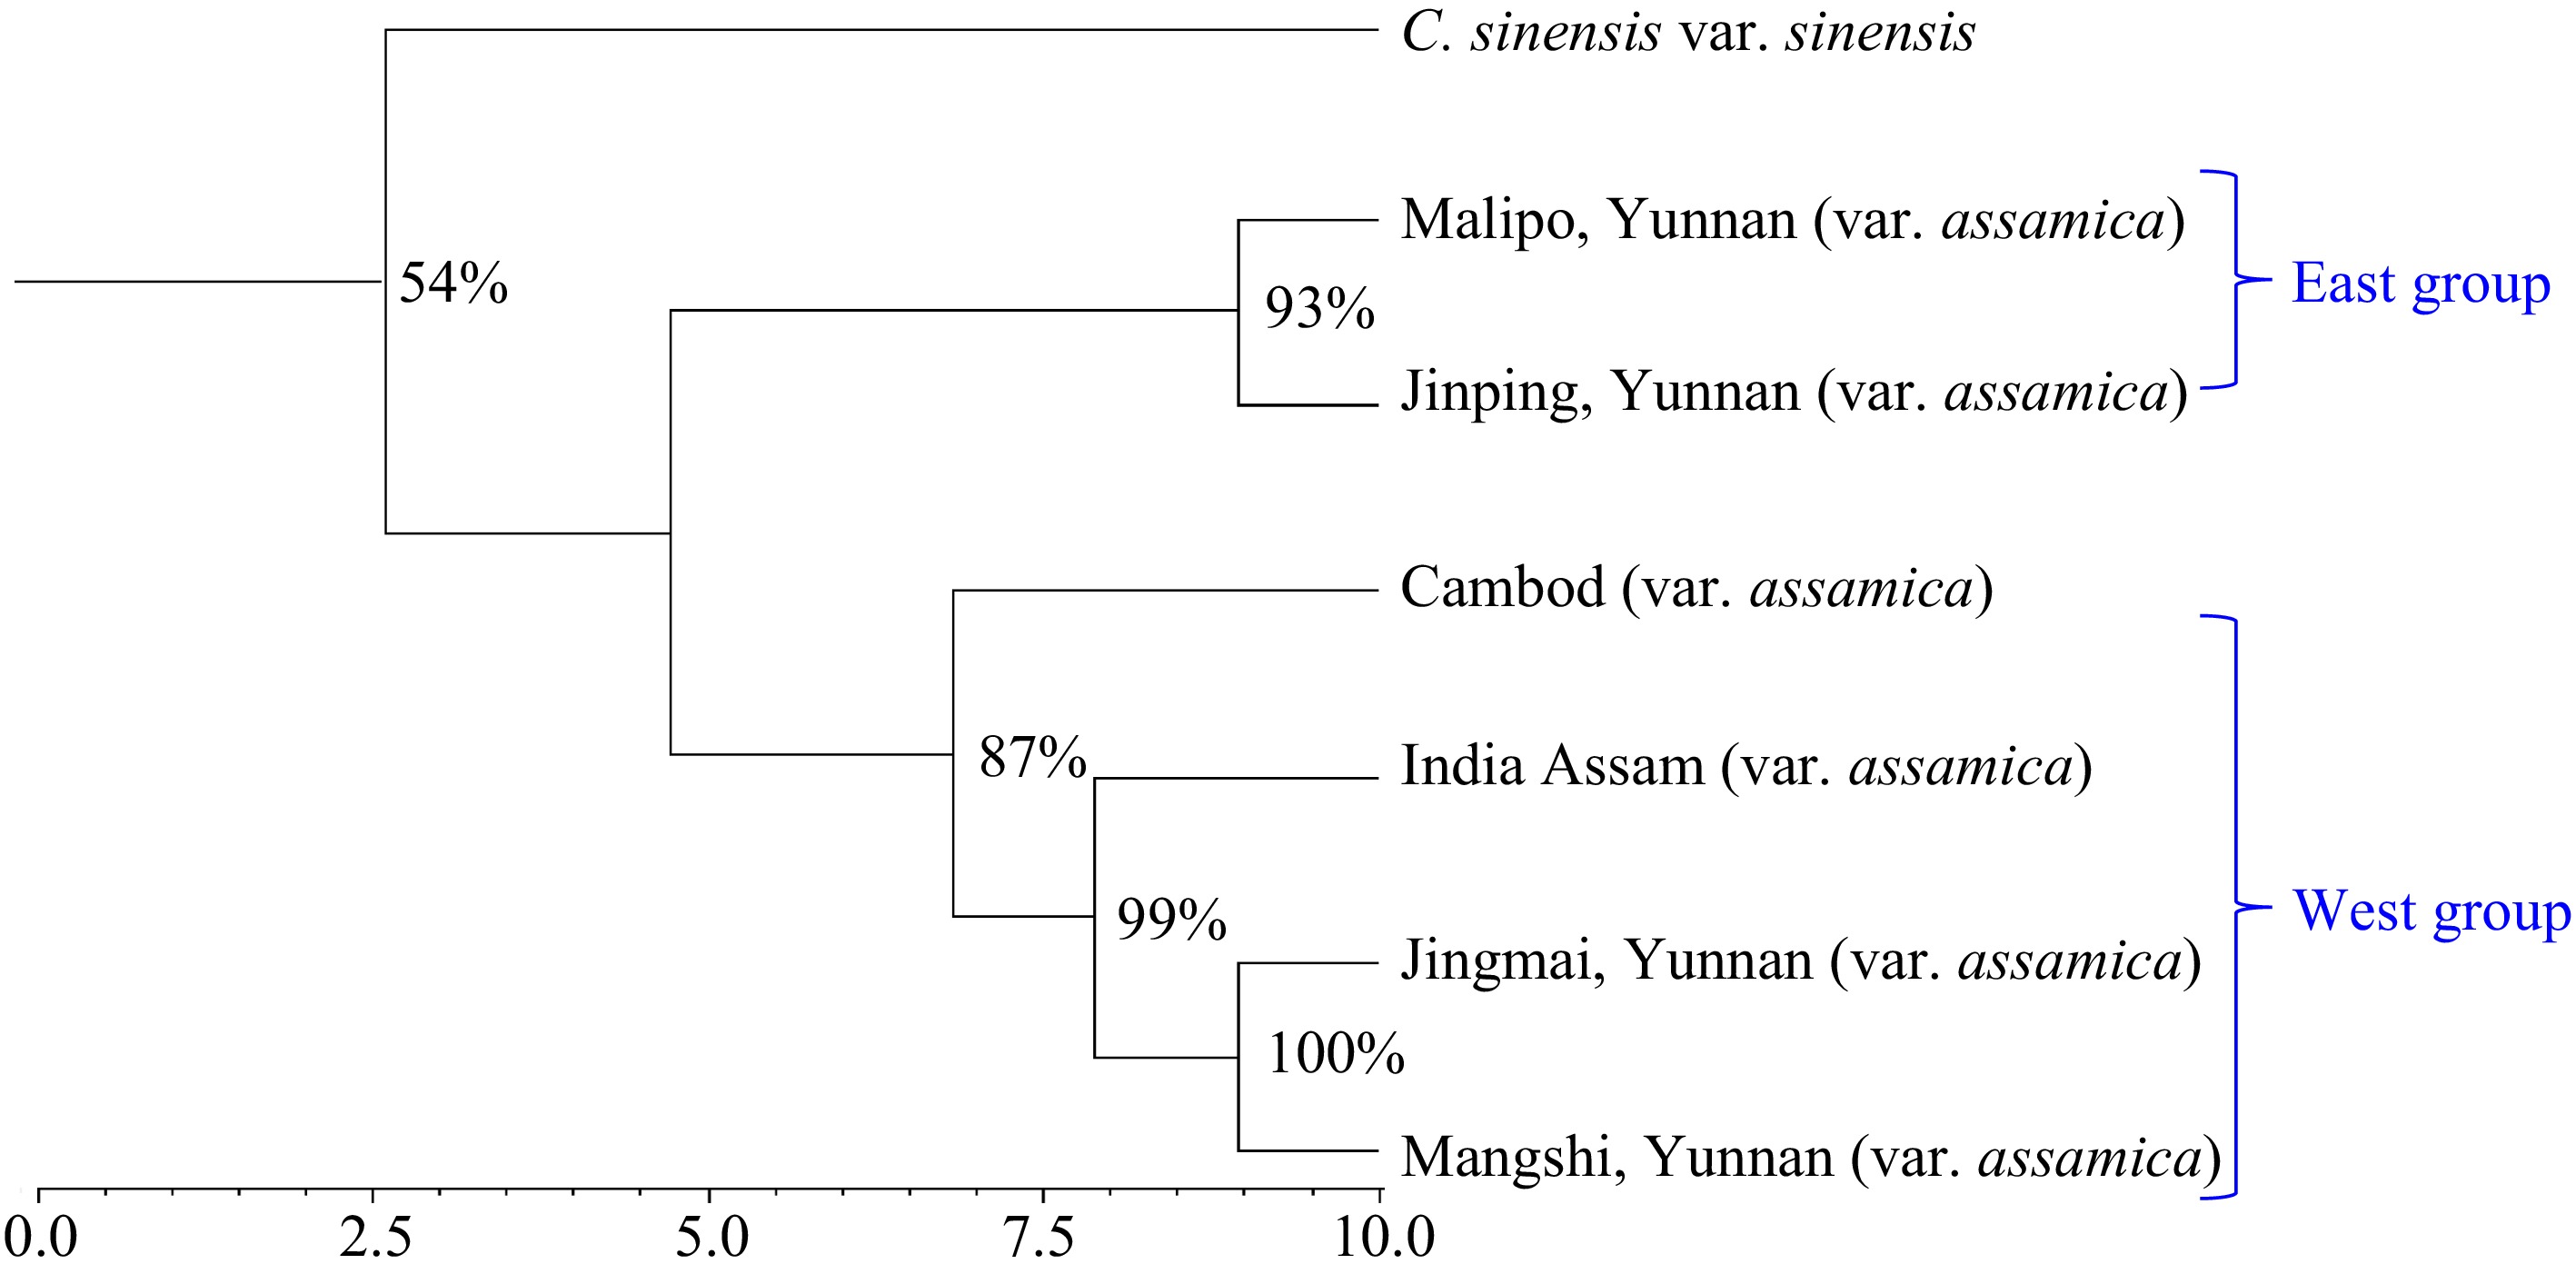
Figure 4.
Neighbor-Joining tree indicating the relationships among the seven analyzed var. assamica germplasm groups/populations.
Descriptive statistics in different germplasm groups
-
Descriptive statistics of the seven tea germplasm groups/populations, measured across the 150 SNPs are presented in Table 3. This SNP panel revealed a large variation of allelic diversity among the analyzed populations. The var. sinensis has the highest gene diversity (0.323) and observed heterozygosity (0.346) among all germplasm groups. The Malipo and Cambod group had a higher gene diversity (0.241 and 0.233) and observed heterozygosity (0.272 and 0.299), than the rest germplasm group. The lowest gene diversity and heterozygosity were found in India assamica (0.136 and 0.147) and Mangshi population (0.133 and 0.164). The 94 germplasm accessions selected from the germlasm bank of TTRI is not representing the diversity of tea germplasm available in the institute. The lasiocalyx type has second highest gene diversity and observed heterozygosity. The population of Jingmai and Jinping ranked the second and third lowest among the six assamicatea groups (Table 3).
Table 3. Observed heterozygosity and gene diversity in eight tea germplasm groups, based on 150 SNP markers.
Population Observed
heterozygosityGene diversity Cambod 0.299 ± 0.023 0.233 ± 0.016 India Assam 0.147 ± 0.017 0.136 ± 0.014 var. sinensis 0.346 ± 0.018 0.323 ± 0.013 Jinmai, Yunnan 0.190 ± 0.022 0.158 ± 0.016 Mangshi, Yunnan 0.164 ± 0.022 0.133 ± 0.016 Jinping, Yunnan 0.163 ± 0.020 0.151 ± 0.015 Malipo, Yunnan 0.272 ± 0.021 0.241 ± 0.016 Analysis of Molecular Variance (AMOVA) in the seven tea germplasm groups
-
The inter-population relationship among the six tea germplasm groups was verified by AMOVA (Table 4) and pairwise Fst values (Table 5). AMOVA showed that the within population molecular variance account for 56.0% whereas the among population molecular variance was 44 %. The inter-population differentiation was highly significant as shown by Phi-statistics (p < 0.001)[37].
Table 4. Analysis of Molecular Variance (AMOVA) and partitioning of total molecular variance within and among seven tea germplasm groups.
Source DF SS MS Est. Var. Percentile p-value* Among pops 6 6,043.3 1,007.224 33.883 54% < 0.001 Within pops 199 5,773.4 29.012 29.012 46% Total 205 11,816.8 62.895 100% * Probability, P (rand ≥ data), for PhiPT is based on standard permutation across the full data set. Table 5. Pairwise population Fst analysis among seven tea germplasm groups - Fst values below diagonal. Probability, P (rand ≥ data) based on 9,999 permutations is shown above diagonal.
Population Cambod Indian Assam var. sinensis Jingmai Mangshi Jinping Malipo Cambod 0.000 0.001 0.001 0.001 0.001 0.001 0.001 India Assam 0.197 0.000 0.001 0.001 0.001 0.001 0.001 var. sinensis 0.356 0.493 0.000 0.001 0.001 0.001 0.001 Jingmai 0.268 0.251 0.486 0.000 0.001 0.001 0.001 Mangshi 0.240 0.249 0.455 0.113 0.000 0.001 0.001 Jinping 0.324 0.446 0.418 0.402 0.409 0.000 0.001 Malipo 0.226 0.357 0.330 0.306 0.301 0.161 0.000 The pairwise Fst values among the six germplasm groups, computed using the Codominant-Allelic Distance Matrix, as implemented in GenAlex 6.51[31], were presented in Table 5. The largest Fst value (0.493) was found between India assamica and sinensis type, whereas the smallest Fst was found between the two ancient tea gardens in Jingmai and Mangshi in southwest Yunnan, (Fst = 0.113). All pairwise Fst were highly significant (p < 0.001) by permutation test using the method of Arlequin[37].
-
Despite the common adoption of the two botanical varieties (C. sinensis var. sinensis and C. sinensis var. assamica) by the tea research community, the genetic basis for the current classification system for assamica tea germplasm has not been comprehensively clarified. Since 1950, there has been suggestion of recognition of 'Cambod' or Southern form as separate taxons[13,14,38]. Phenotypically the lasiocalyx type is intermediate between the sinensis and assamica types[14,15] with intermediate leaf size turning red in Autumn[13]. However, the series of studies based on molecular markers have provided contradictory results[16,17,19, 20].
In the present study, we used 150 SNP markers to analyze a representative set of assamica germplasm sampled from the national germplasm collection at Tocklai Tea Research Institute, Assam, India and from four ancient tea gardens in China. We demonstrated that these 252 accessions of tea germplasm could be classified as six different genetic entities, including five var. assamica populations. The distinction was supported by both Bayesian clustering analysis and distance-based ordination method (PCoA). In addition, result of AMOVA showed that a large proportion (44%) of the total molecular variation was due to the inter-group difference, which strongly supported the results of STRUCTURE and ordination analysis. The pairwise Fst value among the seven populations ranged from 0.161 to 0.493 (p value < 0.001; Table 5), which are all highly significant by permutation testing. Our result, therefore, proposed that there are at least five distinctive genetic linages within var. assamica.
Meegahakumbura et al.[19] and Wambulwa et al.[20] both analyzed genetic diversity in the Cambod tea germplasm. However, in their analysis, the lasiocalyx type was treated as hybrids between var. sinensis and var. assamica. The discrepancy between the present study and the previous ones is likely because the previous studies did not use authentic lasiocalyx landraces therefore the extent of gene flow had resulted a hybrid profile in the Cambod tea plants. In the present study, we used lasiocalyx type tea germplasm that were introduced into India more than a century ago. The full population membership for 15 (out of 19) accessions supported the distinctive lineage of the lasiocalyx type.
In addition, the previous studies analyzed the STRUCTURE result only based on the rate of change in the log probability of data between successive K values (Delta K)[26]. In the present study, when the methods of Evanno et al.[26] was used, the most likely genetic clusters were found as K = 3, but the next likely K value was 6 (Fig. 1b). Moreover, when the method of Puechmaille[27] was applied (which took consideration of the unequal sample size in STRUCTURE analysis), six most probable genetic clusters were detected for MedMed K and MedMean K. Although the MaxMed K and MaxMean K detected seven clusters, only six cluster showed full population membership. Therefore, six populations appeared the most appropriate way to partition the 252 samples in the present study.
Diversity distribution in the primary gene pool of C. sinensis var. assamica
-
The revealing of multiple distinct populations of var. assamica suggests that the primary center of genetic diversity is in Yunnan, China, but Northeast India is likely the southwestern limit of natural distribution of var. assamica. The westernmost part of the gene pool is likely the Arakan Mountains along the border between India and Myanmar, including Patkoi, Lushai Hills, Naga Hills, Manipur, and the China Hills, where the India assamica teas originated. Moreover, the present result suggested that assamica tea consists of multiple distinct lineages that were domesticated separately. Southeast Asia (e.g., Indochina) is revealed as another domestication sites for assamica tea. Within Yunnan, there are likely two domestication sites located in the Southwest and Southeast of Yunnan, respectively. The populations in Southwest Yunnan grouped together with India assamica and lasiocalyx, indicating that they shared common ancestry, which was highly differentiated from the var. assamica in southeast Yunnan (i.e., Jinping and Malipo). The driving force for this diversification remains to be investigated.
The result of significantly differentiated var assamica populations is compatible with the anthropological knowledge regarding how tea was used by different ethnic groups in Yunnan, China as well as the neighboring countries. For a long time, tea was a medicinal drink for the tribal people in India, such as Singhphos, Khamtis, Deonies, Mattocks and Norahs of Assam and the neighboring hilly areas, but unfortunately there is no record as to when Assamese people started drinking the liquor extracted from the leaves of wild indigenous tea plants[39].
The discovery of the assamica tea plant in India is attributed to Robert Bruce, a Scottish adventurer who first found the plant growing wild in the hills near Rangpur, then Ahom capital of Assam, during his visit in 1823 on a trading mission[40]. In 1839, Bruce published a pamphlet, which contained a map where he showed the extent of his discoveries of wild tea. He located 80 tea tracts in the Matak Country, 12 in the Singphos and 28 in the west of the Buri Dihing at Namsang, Tipam, Jaipur and in Rangpur (now Sivasagar) and Gabru. He reported that some of the tracts were very extensive, both on the hills and in the plains[41]. In December 2012, a team from the Tocklai Experimental Station lead by the first author (DB) extensively visited the Upper Assam area from Margherita in the Tinsukia district to Bordumsa in Arunachal Pradesh in search of wild teas and to collect germplasm. The team successfully located many areas with 'wild' teas covered by dense jungle forests. However, it could not be ascertained if the plants were wild or the remains of earlier cultivated areas of the tribal Singpho people. The areas where such teas were found were Uloop, Inthem, Dooarmara, Ketetong, Panbari (in Assam), Bordoomsa (in Arunachal Pradesh), etc. The tea plants found were about 20 feet in height and were utilized by the local people for seeds that were planted in their vicinity or were pruned to bring under commercial cultivation. The germplasm was collected from the surveyed areas and the material collection from Bordumsa area were of broad leaf, light colored assamica type with plenty leaf pubescence[42]. In recent years, wild tea plants were also found in the forest of Brahmaputra valley, as well as in areas of remote dense forest in the Sonhlithi hills of Karbi Anglong district in Assam[43−45]; Kamal Singh Teron, unpublished data). Supplementary Fig. S2 shows the flowers, leaves and adult tree of the wild tea plants observed in Sonhlithi hills forest in Assam region. However, the genetic relationship between these wild tea plants and the cultivated assamica tea in this region has yet to be verified using appropriate molecular and genomic approaches.
Tea tracts discovered in these regions were believed to be cultivated tea abandoned by migratory hill tribes, namely the Singphos, and the Muttocks (presently known as the Morans). These tribes usually followed a system of cultivation known as jhuming (slash and burn agriculture), where they cleared a virgin area and raised crops for a number of years and then abandoned it to move to clear another virgin area for new cultivation. These tribes originally inhabited Burma and migrated to Assam and Arunachal Pradesh and live in the Indo-Burma border region of Kachin. In the present study, we included two progenies of these putative wild trees (DP 2 and DP 3) and assessed their population membership. Our result confirmed that these trees belong to the population of Indian assamica, with an assignment probability of above 90%. The result proves that these wild trees are indigenous to Assam, ruled out the possibility that they were introduced from Southeast Asia or China. This conclusion is consistent with the previous reports of Paul et al.[16]; Meegahakumbura et al.[19] and Wambulwa[20] and support the explanation that tea has multi-origins from different area of the primary gene pool. Moreover, our result provided new evidence that Indochina has its own unique germplasm group and independent domestication.
There is no doubt that China is the first center of domestication for tea, which can be traced back to over 5,000 years ago[1,46]. However, the hypothesis that domesticated tea dispersed to India and Southeast Asia from China is not supported by recent studies including the current. Apparently local people in Northeast India and Southeast Asia also domesticated tea using their indigenous wild tea populations. There were probably multiple events of domestication, some of which were influenced by Chinese tea culture. Nonetheless, it's also possible that the domestication was driven by other means of tea plant utilization (in addition to being a beverage plant), such as food and medicinal purposes[46,47]. For example, the tribal peoples in Yunnan and Northern Burma were known to have used tea as a vegetable (i.e., laphet). The spatial distribution of genetic diversity revealed in the present study supported the multiple domestication of Assam tea in the primary genepool of var. assamica. As a long‐lived perennial, tea is also an extensive outcrossing species with limited population structure. These features, combined with multiple origins, explained the negligible domestication bottleneck in this species.
The multiple distinctive lineages of assamica tea revealed in the present study demonstrated a much larger range of genetic diversity in the primary gene pool of var. assamica (relative to var. sinensis). Nonetheless, the present study also showed that gene diversity is higher in the var. sinensis group than var. assamica when each single population was compared (Table 3). Similar results were reported by Meegahakumbura et al.[19,21] using SSR markers. This observation is likely due to the fact that var. sinensis was cultivated much earlier than var. assamica, thus experienced more intensive hybridizations among the cultivated varieties. Especially, the var. sinensis samples in the present study are mostly elite cultivars, whereas the majority of each var. assamica population was represented by a single tea garden (e. g. Jingmai, Mangshi, Jinping and Malipo).
Implication of the present study on tea genetic improvement and conservation of tea germplasm
-
Out of the 94 TTRI germplasm accessions analyzed in the present study, there were 38 breeding lines that are putative hybrids, but their exact parentage was not clear. STRUCTURE analysis clearly revealed the parentage/ancestry of these hybrids based on the six different genetic populations. In average, Indian assamica, Cambod assamica and Chinese var. sinensis contributed 54.9%, 14.0% and 28.1% of the parentage to these breeding lines respectively. The influence of China var. assamica, either from southwest or southeast Yunnan to these hybrids is negligible. It's well known that each germplasm group has its featured attributes in terms of agronomic traits and quality characteristics. For example, the var. assamica is known for its high polyphenol content, broad leaf, and adaptability to hot and humid climates. The var. sinensis is well known for its adaptability to hardy environments, theanine content, and small leaf. The Cambod assamica has the unique ability to tolerate drought conditions. The inter-population hybrids, therefore, have the advantage that combine different specific traits from a broad genetic background. Therefore, most the advanced breeding lines and released clones from TTRI are hybrids in nature.
The revealed pattern of parentage in the hybrids is compatible with the history of tea germplasm introduction into India. The introduction of Chinese tea (var. sinensis) varieties to India began in the 19th century by the British[48]. In 1840, Mr. Fortune was assigned to China where a large numbers of tea plants were collected and sent from different provinces of China, including Zhejiang, Guangdong, Fujian, Anhui. Over time, the introduced Chinese small leave varieties have spontaneously hybridized with the Indian assamica and Cambod assamica varieties and formed various hybrid varieties. Compared with the original parental types, these hybrids combined superior agronomic traits and quality attributes from each contributing population. Moreover, these hybrids may have taken advantage of the inter-population heterosis or hybrid vigor. In tea heterosis as high as 80% was reported[49], however this high level of heterosis has not yet been exploited. Grouping of tea accession into distinct groups based on molecular information and identification of germplasm having maximum genetic distance will enable tea breeder to exploit heterosis for yield and quality traits. For example, higher net photosynthetic rates were observed in assamica hybrids than in sinensis and lasiocalyx varieties[50]. Maximum value for stomatal density was recorded in the extreme sinensis type clone (128/26/2) whereas minimum value was recorded in a hybrid clone KP 4/10[51,52]. On the other hand, it's worth noting that the China var. assamica germplasm was not detected in the Tocklai tea germplasm collection. Introduction of this type of germplasm will likely increase the representation of genetic diversity in the genebank and offer new genetic variation to exploit heterosis in breeding.
From the perspective of tea germplasm conservation, this study showed that there is still research needed on the wild teas in Assam, the neighboring Northeast Indian states and in the countries extending up to the south of China. The distribution of genetic diversity in the Assam tea germplasm needs to be systematically collected and analyzed. This current study further strengthened the necessity of exploration and germplasm collection of the remaining wild Assam teas. New discoveries are possible and may provide scientists valuable genetic resources to improve tea cultivars with high quality, productivity, and resistance to various biotic and abiotic stresses. Diversity gaps in ex situ collections need to be identified and filled through new collection expeditions to increase the representation from the geographical centers of diversity.
-
Genetic diversity of 252 tea accessions, sampled from India and China, were analyzed using 150 SNP markers. Multi-variant analysis, Bayesian population assignment, AMOVA and cluster analysis all revealed a consistent pattern of diversity distribution, providing insight of origin and domestication of assamica tea (C. sinensis var. assamica). Our result reaffirms the old postulate that lasiocalyx type ('Southern form') is a distinctive linage of assamica tea. We showed that there are at least five distinct var. assamica populations in their primary gene pool, including:
(1) India var. assamica, which is distributed in Assam, India;
(2) lasiocalyx type from Indochina, but the exact origin and distribution remain to be identified;
(3) China var. assamica from Southwest Yunnan, which was represented by Jingmai and Mangshi in this study. Since the genetic divergence between Jingmai and Mangshi is small, these two clusters can be considered as two sub-populations within the Southwest Yunnan population;
(4) Jinping, Honghe city, Yunnan. This is a wild population located near the border region between China and Vietnam. It's possible that this population stretches into North Vietnam, where wild var. assamica have been reported (e.g., Lao Cai, Fa Si Pan, and Yen Bay);
(5) Malipo, Wenshan city, Yunnan. This is also a wild population located at the border region between China and Vietnam. This wild population may also stretch into Northern Vietnam such as Ha Giang.
Based on the present study, we suggest that these multiple var. assamica populations were independently domesticated from the indigenous wild tea plants that were spontaneously grown in Yunnan, China, Northeast India, and Southeast Asia. Within each group, there was a significant genetic heterogeneity, indicating the existence of different sub-populations. Further studies with additional systematic sampling in the primary gene pool of var. assamica, is needed to fully understand the structure of genetic diversity in this vast region. Results of this pilot project provides novel baseline information for understanding the primary gene pool and improving the efficiency in conservation and utilization of tea genetic resources.
We would like to give special thanks to Dr. Liang Chen for providing the tea germplasm samples and passport information, Mr. Stephen Pinney for SNP genotyping, and Dr. Orestis Nousias for assistance in SNP data analysis. This work was partially supported by the National Natural Science Foundation of India (30800884, 31370688). References to a company and/or product by the USDA are only for the purposes of information and do not imply approval or recommendation of the product to the exclusion of others that may also be suitable. USDA is an equal opportunity provider and employer. This research was funded in part by USDA-ARS, Nanjing Agricultural University (NAJU), China, and the National Natural Science Foundation of India.
-
The authors confirm contributions to the paper as follows: study conceptualization and design: Borthakur D, Zhang D; sample collection and experiment implementation: Wang B, Borthakur D, Zhou L, Tan H, Barooah AK, Borchetia S; data analysis: Borthakur D, Tan H, Wang B, Fang W, Zhang D; Writing: Borthakur D, Zhang D, Fang W, Meinhardt LW;. All authors reviewed the results and approved the final version of the manuscript.
-
List of tea germplasm, SNP sequences, genotyping data and information on Assam wild tea are available in Supplementary information.
-
The authors declare that they have no conflict of interest.
-
# Authors contributed equally: Devajit Borthakur, Boyi Wang
- Supplementary Table S1 The 150 SNP loci, their genomic position and flanking sequences used for tea germplasm characterization.
- Supplementary Table S2 Genotyping data of 252 tea accessions generated using the Fluidigm 96.96 Dynamic ArrayTM (Fluidigm, San Francisco, CA, USA).
- Supplementary Fig. S1 The Neighbor-Joining tree of 206 tea accessions, including the core members of each tea.
- Supplementary Fig. S2 Flowers, leaves and adult tree of the wild tea (C. sinensis var. assamica) observed in Sonhlithi hills forest, Assam, India.
- Copyright: © 2025 by the author(s). Published by Maximum Academic Press, Fayetteville, GA. This article is an open access article distributed under Creative Commons Attribution License (CC BY 4.0), visit https://creativecommons.org/licenses/by/4.0/.
-
About this article
Cite this article
Borthakur D, Wang B, Meinhardt L, Zhou L, Tan H, et al. 2025. Multiple distinctive lineages of Camellia sinensis var. assamica from India and China revealed by Single Nucleotide Polymorphism markers. Beverage Plant Research 5: e026 doi: 10.48130/BPR-2023-0020 

Multiple distinctive lineages of Camellia sinensis var. assamica from India and China revealed by Single Nucleotide Polymorphism markers
- Received: 06 July 2023
- Revised: 11 August 2023
- Accepted: 14 August 2023
- Published online: 04 September 2025
Abstract: Knowledge of genetic diversity is fundamental for improving conservation and utilization of tea plant genetic resources. One hundred and fifty SNP markers were used to assess the genetic diversity in 252 tea accessions covering a wide range of geographical origins including Assam India, Southwest and Southeast Yunnan and Eastern China. Multivariate and Bayesian clustering analysis revealed six distinctive genetic lineages, corresponding to Camellia sinensis var. sinensis type and five C. sinensis var. assamica from India, Indochina, Southwest Yunnan (China), and Southeast Yunnan (China). Fst among these different lineages ranges from 0.161 to 0.493 and all are highly significant (p < 0.001). The present study suggests that there are at least five different genetic populations of var. assamica in their primary gene pool, including: (1) India assamica, (2) Cambod (or Southern form lasiocalyx), (3) Southwest Yunnan assamica, (4) Jinping, Yunnan assamica, and (5) Malipo, Yunnan assamica. We further suggest that the populations of var. assamica were independently domesticated based on the indigenous wild tea plants, rather than introduced cultigens from a single origin. Geographically, the five var. assamica populations could be grouped into two large clusters. The West cluster includes India assamica, lasiocalyx and Southwest Yunnan assamica, whereas the East cluster includes Southeast Yunnan assamica. Our results also support the old postulate that Cambod type var. assamica is a distinctive member of C. sinensis var. assamica. Inferred parentage in hybrid breeding lines from India showed that there was no introgression of Chinese assamica germplasms, suggesting the potential of exploring inter-population heterosis using the untapped germplasm.
-
Key words:
- Assamica type tea /
- Camellia sinensis (L.) O. Kuntze /
Conservation / - Domestication /
- Genebank /
- Genetic diversity