


-
In industrial food processing, offline testing is normally carried out prior to batch release as part of the quality control process. Offline testing can take hours or days, leading to delays in product release. Inline PAT is an attractive alternative as data can be collected continuously, and results can be derived automatically in minutes or seconds[1]. Inline analytical sensors provide fast, automatic, and continuous chemical or physical measurements in the form of electrical signals. Using the vast data collected from the online sensors, chemometrics can be used to analyse and extract relevant patterns and information[2−8]. Spectroscopic sensors such as Ultraviolet-Visible spectroscopy (UV-Vis), Infrared (IR) spectroscopy, Raman spectroscopy, Fluorescence spectroscopy, etc. are often used as PAT to facilitate various research studies and experiments[9].
PAT has been extensively implemented across many industries. In the dewatering process, precise process control using Focused Beam Reflectance Measurement (FBRM) was used to generate the relevant data to increase the yield of biosolids and energy generation[10]. In the pharmaceutical industry, PAT is widely used in both the manufacturing, and research and development process[11]. A few of the many applications in the manufacturing process include acoustic resonance spectroscopy or laser interferometric detection to rapidly and accurately identifying tablets and detect physical defects without destruction[12,13], and NIR spectroscopy to determine the active content in uncoated pharmaceutical pellets and facilitate small-scale capsule manufacturing[14,15]. In the research space, PAT has been applied across multiple platforms, especially for the characterisation of active pharmaceutical ingredients (API). Some recent examples include homogeneity testing of a silicone-based drug reservoir[5], quantification and determination of contaminants in a tablet[4], and measurement of crystal size distribution in particulate processes[16].
Compared to the pharmaceutical industry, PAT is not as widely implemented in the food manufacturing industry. However, the implementation of PAT in the food manufacturing industry has risen in recent years. For instance, NIR spectroscopy was used to analyse the salt composition in soy sauce to facilitate the desalting process[17], Vis-NIR, Mid-infrared (MIR) and Raman spectroscopy were used to assess the quality and composition of infant milk formula[18], and NIR spectroscopy was used to investigate the composition of extra virgin olive oil[6]. In addition to composition analysis, PAT also allows precise control and monitoring of food manufacturing processes, with successes demonstrated in wine fermentation[3], yoghurt fermentation[19], and dehydration of edible coatings in bread[20].
A large hurdle that slows down the adoption of PAT in the food manufacturing industry is the high capital investment. Therefore, the most logical step is to use PAT technology in the manufacturing of high value food products such as infant milk formula. Infant milk powder is a blend of multiple dried components and therefore, uniformity is an important process end point parameter. The existing tests for uniformity focus on offline testing of the composition of known components such as vitamins, minerals, fatty acids, etc. using High-Performance Liquid Chromatography (HPLC)[21] or other chemical tests[22−24]. These offline tests are time consuming and need to be conducted by qualified personnel. In addition, it is not possible to make process end point decisions on the production floor. PAT offers continuous process monitoring with immediate test results. Online IR spectroscopy can provide results within (approx.) minutes, without the need for any sample preparation[25]. In the case of infant milk powder, the vibrational peaks due to the C-H, O-H, and N-H bonds vibrational modes can be monitored through IR spectroscopy and the concentration of the vitamins can then predicted by measuring the area under the vibrational peaks[26]. A study carried out by Khan et al.[27] demonstrated that NIR spectroscopy can effectively be used to assess the quality of milk powders. Using various data pretreatment techniques and multivariate data analysis, important milk powder qualities such as fine particle size fraction, dispersibility and bulk density could be predicted.
In this study, the feasibility of using the NIR probe as a PAT in the milk powder blending process was investigated in two areas. Firstly, as a process monitoring tool, to predict the end point of infant milk powder blending. Secondly, as a real-time analytical tool, to measure the concentration of vitamin C in the power blend.
-
A standard milk formulation (SMF) was created to mimic the composition of infant milk powder. The SMF was made up of 50% lactose (Wee Hoe Cheng Chemical Pte Ltd, Singapore), 40% skim milk powder (NTUC FairPrice Co-operative Ltd, Singapore) and 10% whey protein concentrate (MYPROTEINTM, Manchester, UK). To test for the detection limit, vitamin C powder (MYPROTEINTM, Manchester, UK) was used. All ingredients were purchased and used within the same package.
-
A series of experiments were conducted to predict the uniformity of the milk powder blending process. To achieve this, the NIR spectra of the SMF was measured during the SMF blending process, and the end point of the was determined by the conformity test as described below. To validate the uniformity end point prediction using the NIR probe, a comparative offline measurement of a well-mixed SMF using FTIR spectroscopy was carried out as described below.
The capability of the NIR probe in the detection of vitamin C was explored. The NIR spectra of SMF and known concentrations of vitamin C (0, 0.5%, 1.5%, 2.0%) mixtures were measured, and a PLSR model was constructed and subsequently validated with a known concentration of vitamin C (1.0%). The limit of detection of the probe was assessed by determining the minimum concentration level of vitamin C that could be predicted accurately by the PLSR model. The process is described below.
The set-up for the milk powder blending process using an NIR probe
-
The schematic of the experimental setup is shown in Fig. 1. The components of the SMF were weighed separately before being transferred into the blender (Huttlin Mycromix, Bosch, Germany) and blended at 250 rpm. The NIR reflectance probe connected to the NIR spectrometer (Matrix-F NIR Spectrometer, Bruker Corporation, Massachusetts, USA) was inserted through a top opening.
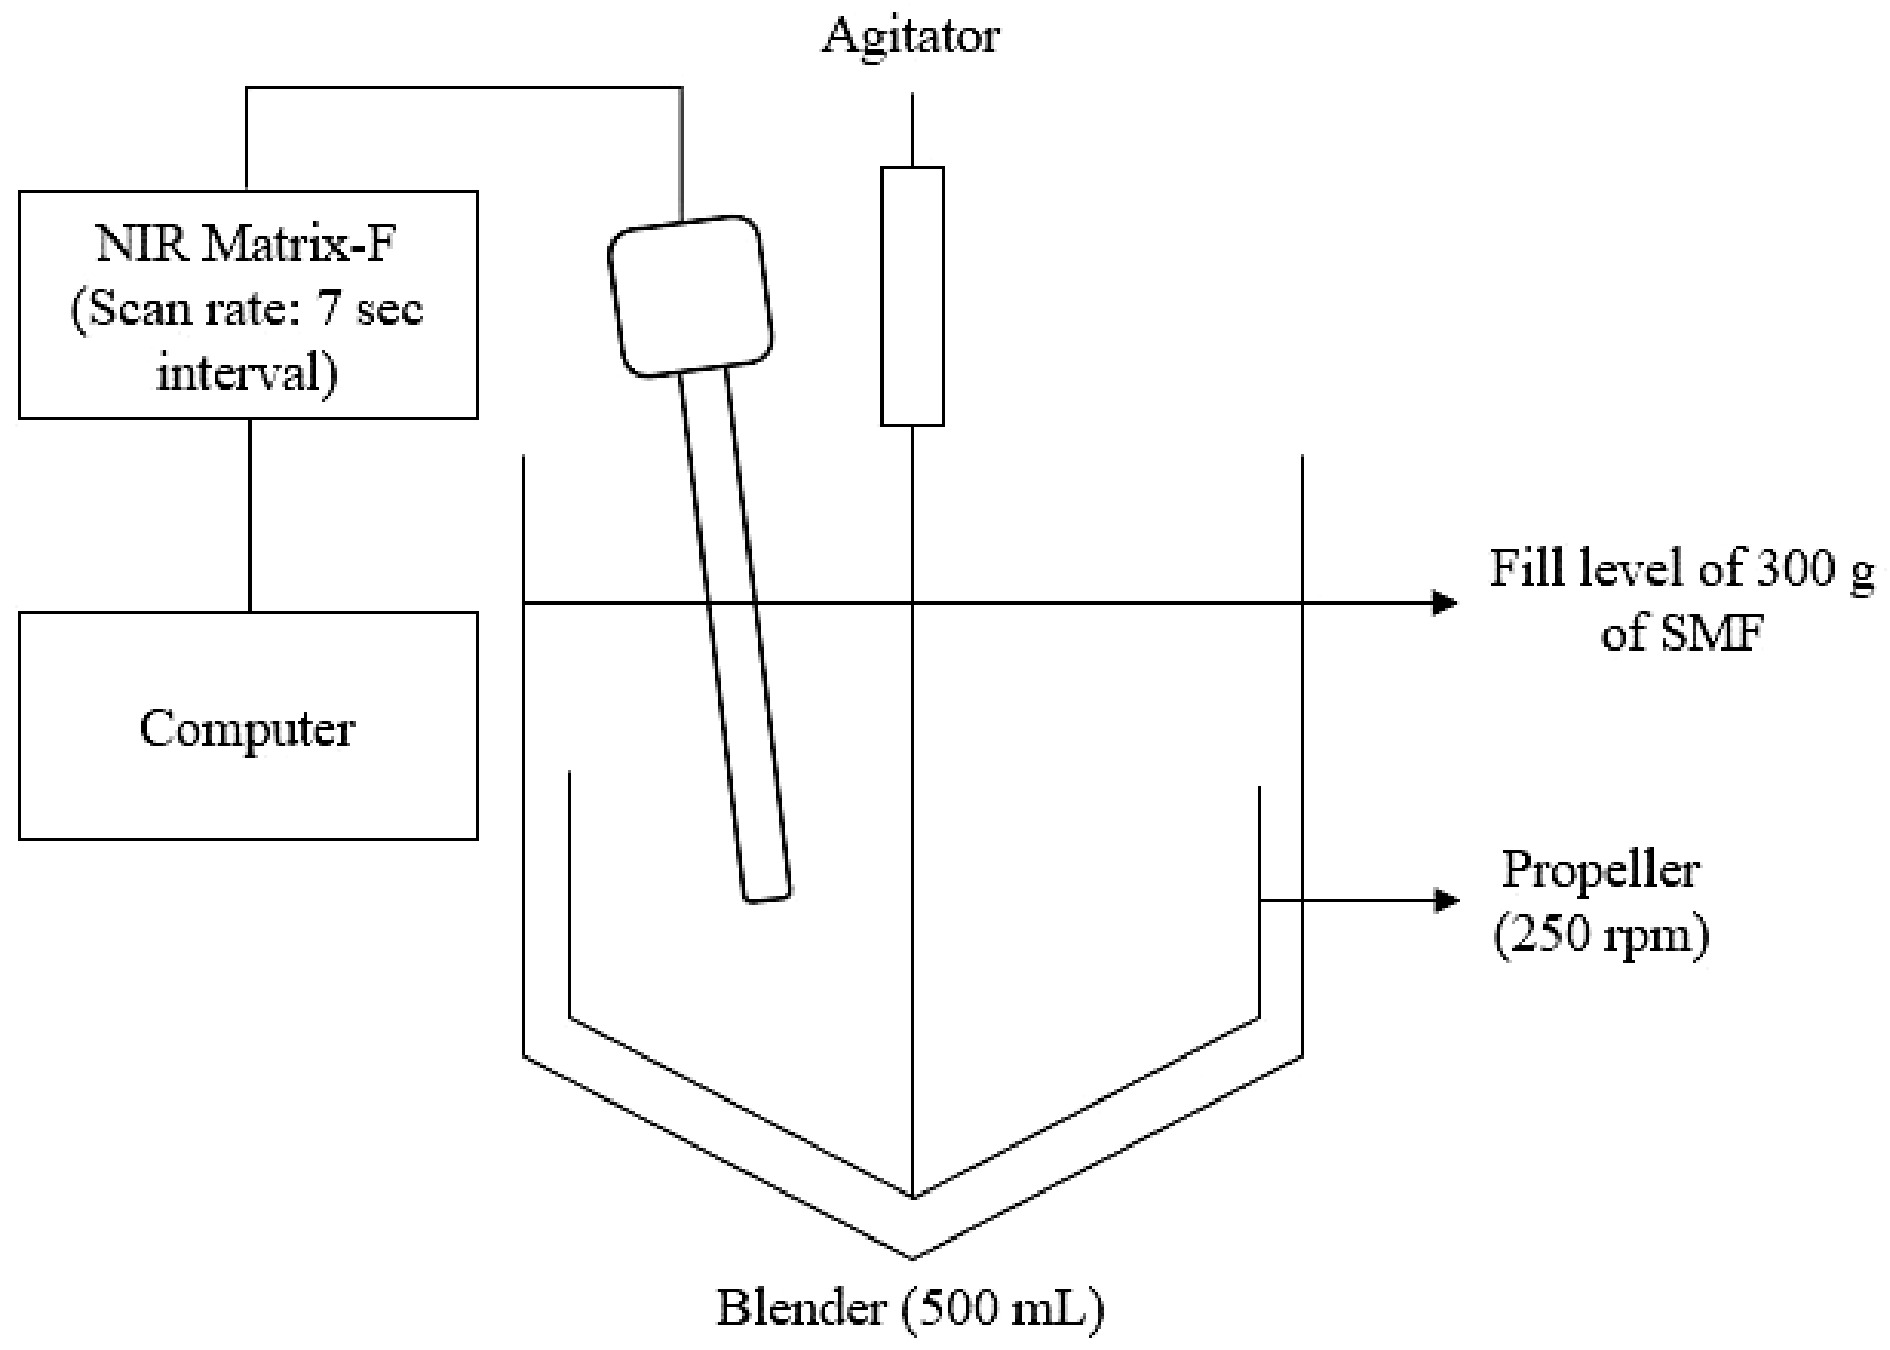
Figure 1.
The experimental set-up to monitor the SMF during the blending process.
Processing the IR spectra
-
The IR spectra collected was analysed via multivariate tools to extract relevant and useful information from the spectra. The spectra obtained were processed by 'Spectragryph 1.2.13' software (Spectroscopy Ninja, Oberstdorf, Germany). Standard Normal Variate (SNV) analysis was applied to normalise and scale the NIR spectra. For the FTIR spectra, adaptive baseline subtraction was applied to correct the baseline. The SNV works by normalizing the average of the whole spectra, while the adaptive algorithm creates a baseline that snugly fits to the bottom of the spectra, so the baseline can be effectively corrected while keeping the actual peaks.
Inline monitoring and prediction of uniformity end point of the SMF blending process
-
For the inline monitoring of the SMF blending process, NIR spectra were collected at a resolution of 16 cm−1 and frequency of 7 s from wavenumbers 12,000–4,000 cm−1. The spectra were collected for 70 min, and the room temperature was kept at an ambient temperature (25 °C).
The end point of the SMF blending process was determined by the conformity test method[5]. The conformity test is based on mixing kinetics, which measures the degree of spectra variation from fixed references at different blending times. Protein and lactose are the key components in SMF and are used as markers of detection in the NIR spectra. The C-H, N-H and O-H vibrational modes due to lactose and protein are marked, and the absorbance values are shown in Fig. 2[28−32].
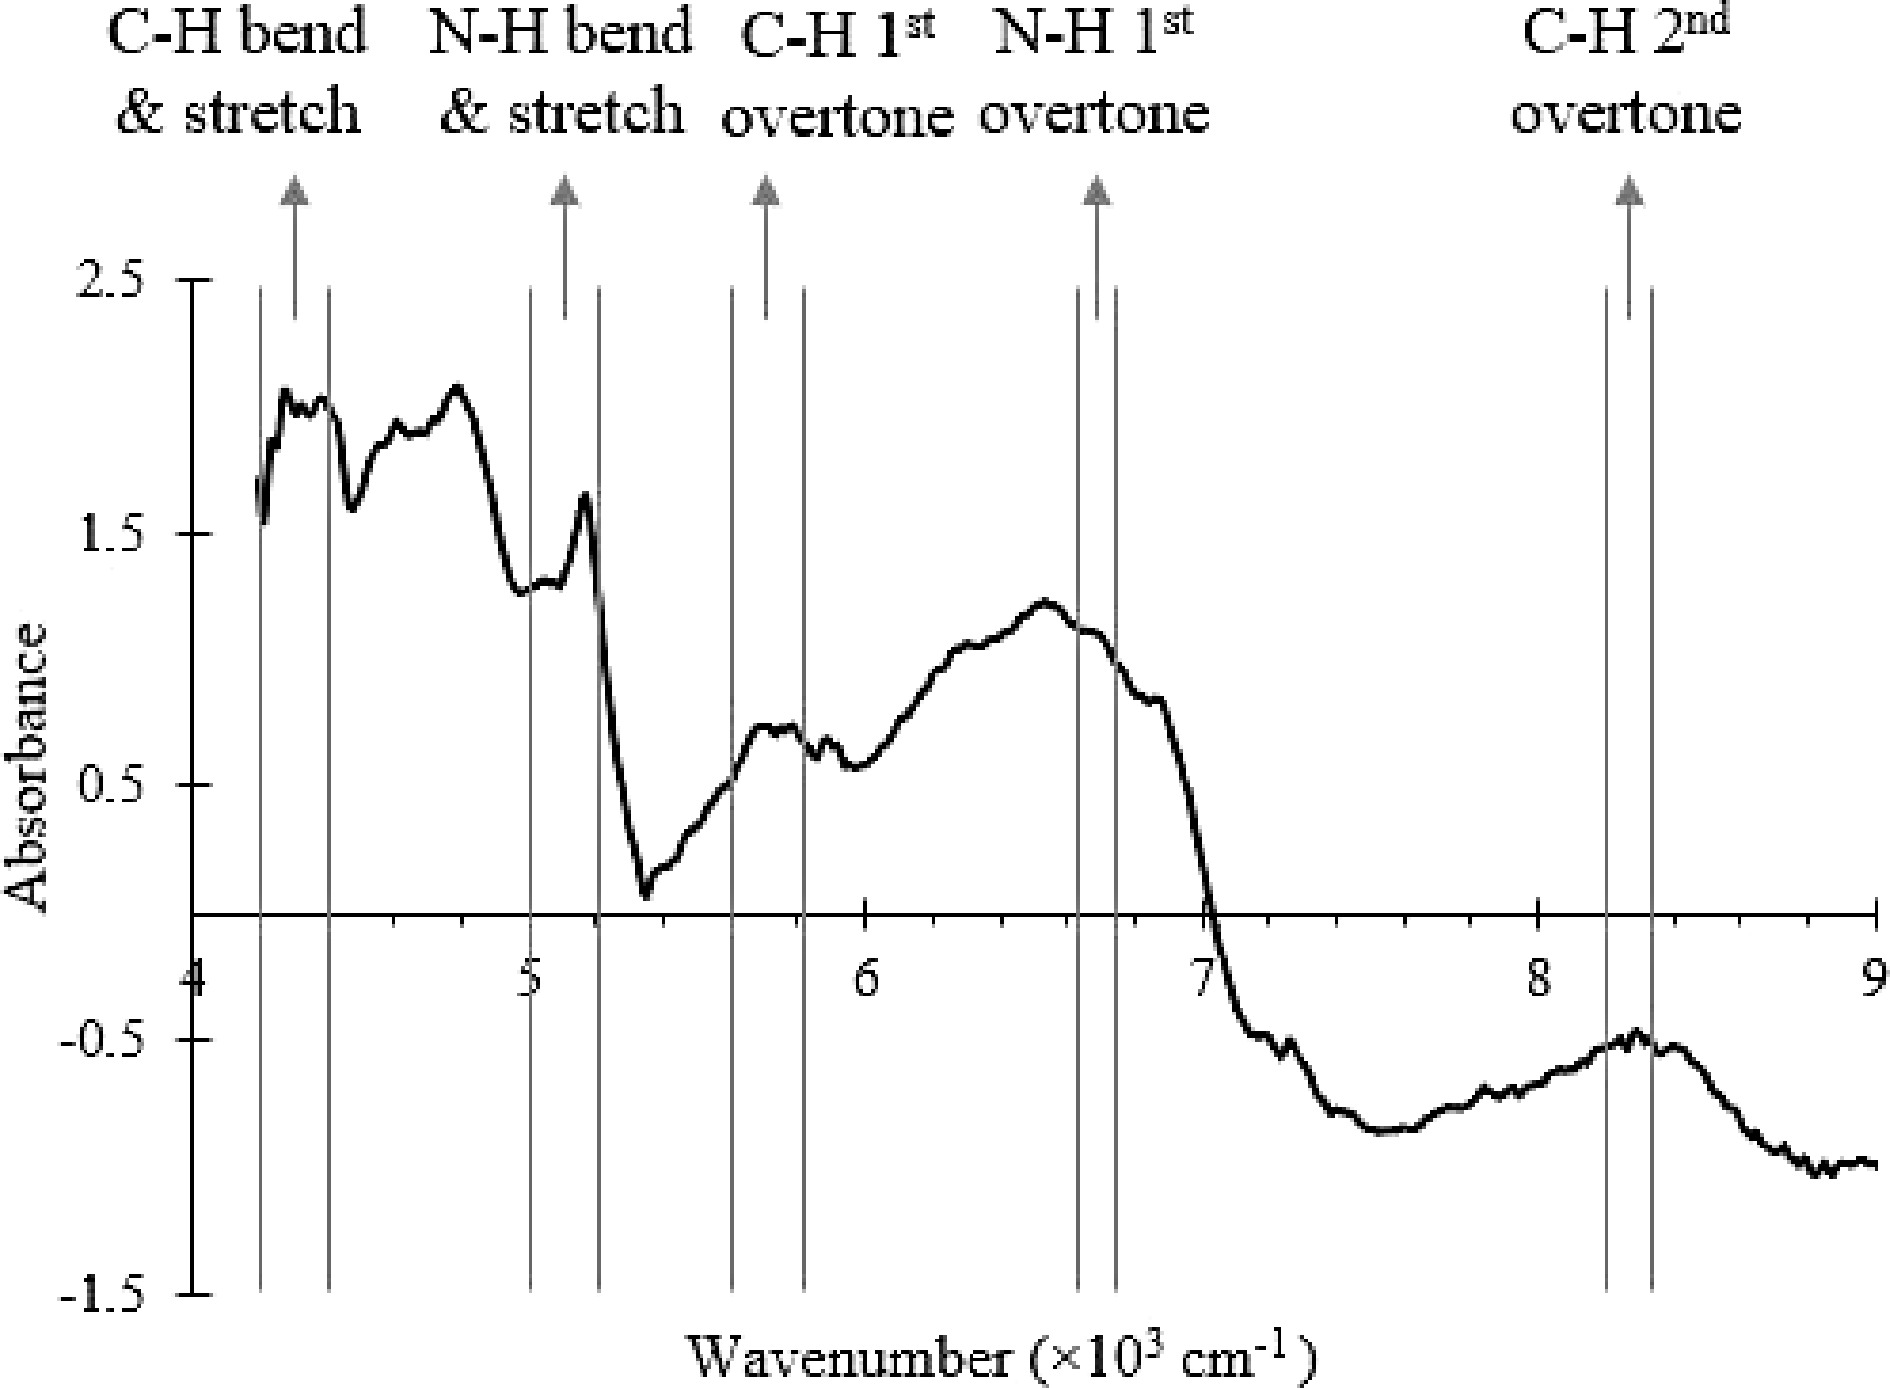
Figure 2.
NIR spectrum of the SMF with the wavenumber ranges that correspond to C-H, O-H and N-H bonds vibrational modes labelled.
The conformity test method assumed that uniformity is achieved at the end of the process (70 min). As such, the last 30 spectra (66.5 to 70 min) were used as the reference points for a uniformed powder.
The calculations to determine the uniformity end point of the blending process is summarised in Fig. 3. First, the conformity index at each specific wavenumber range (CIw) (Fig. 3a), were calculated to quantify the variation between the test spectra and the reference spectra using the following equation:
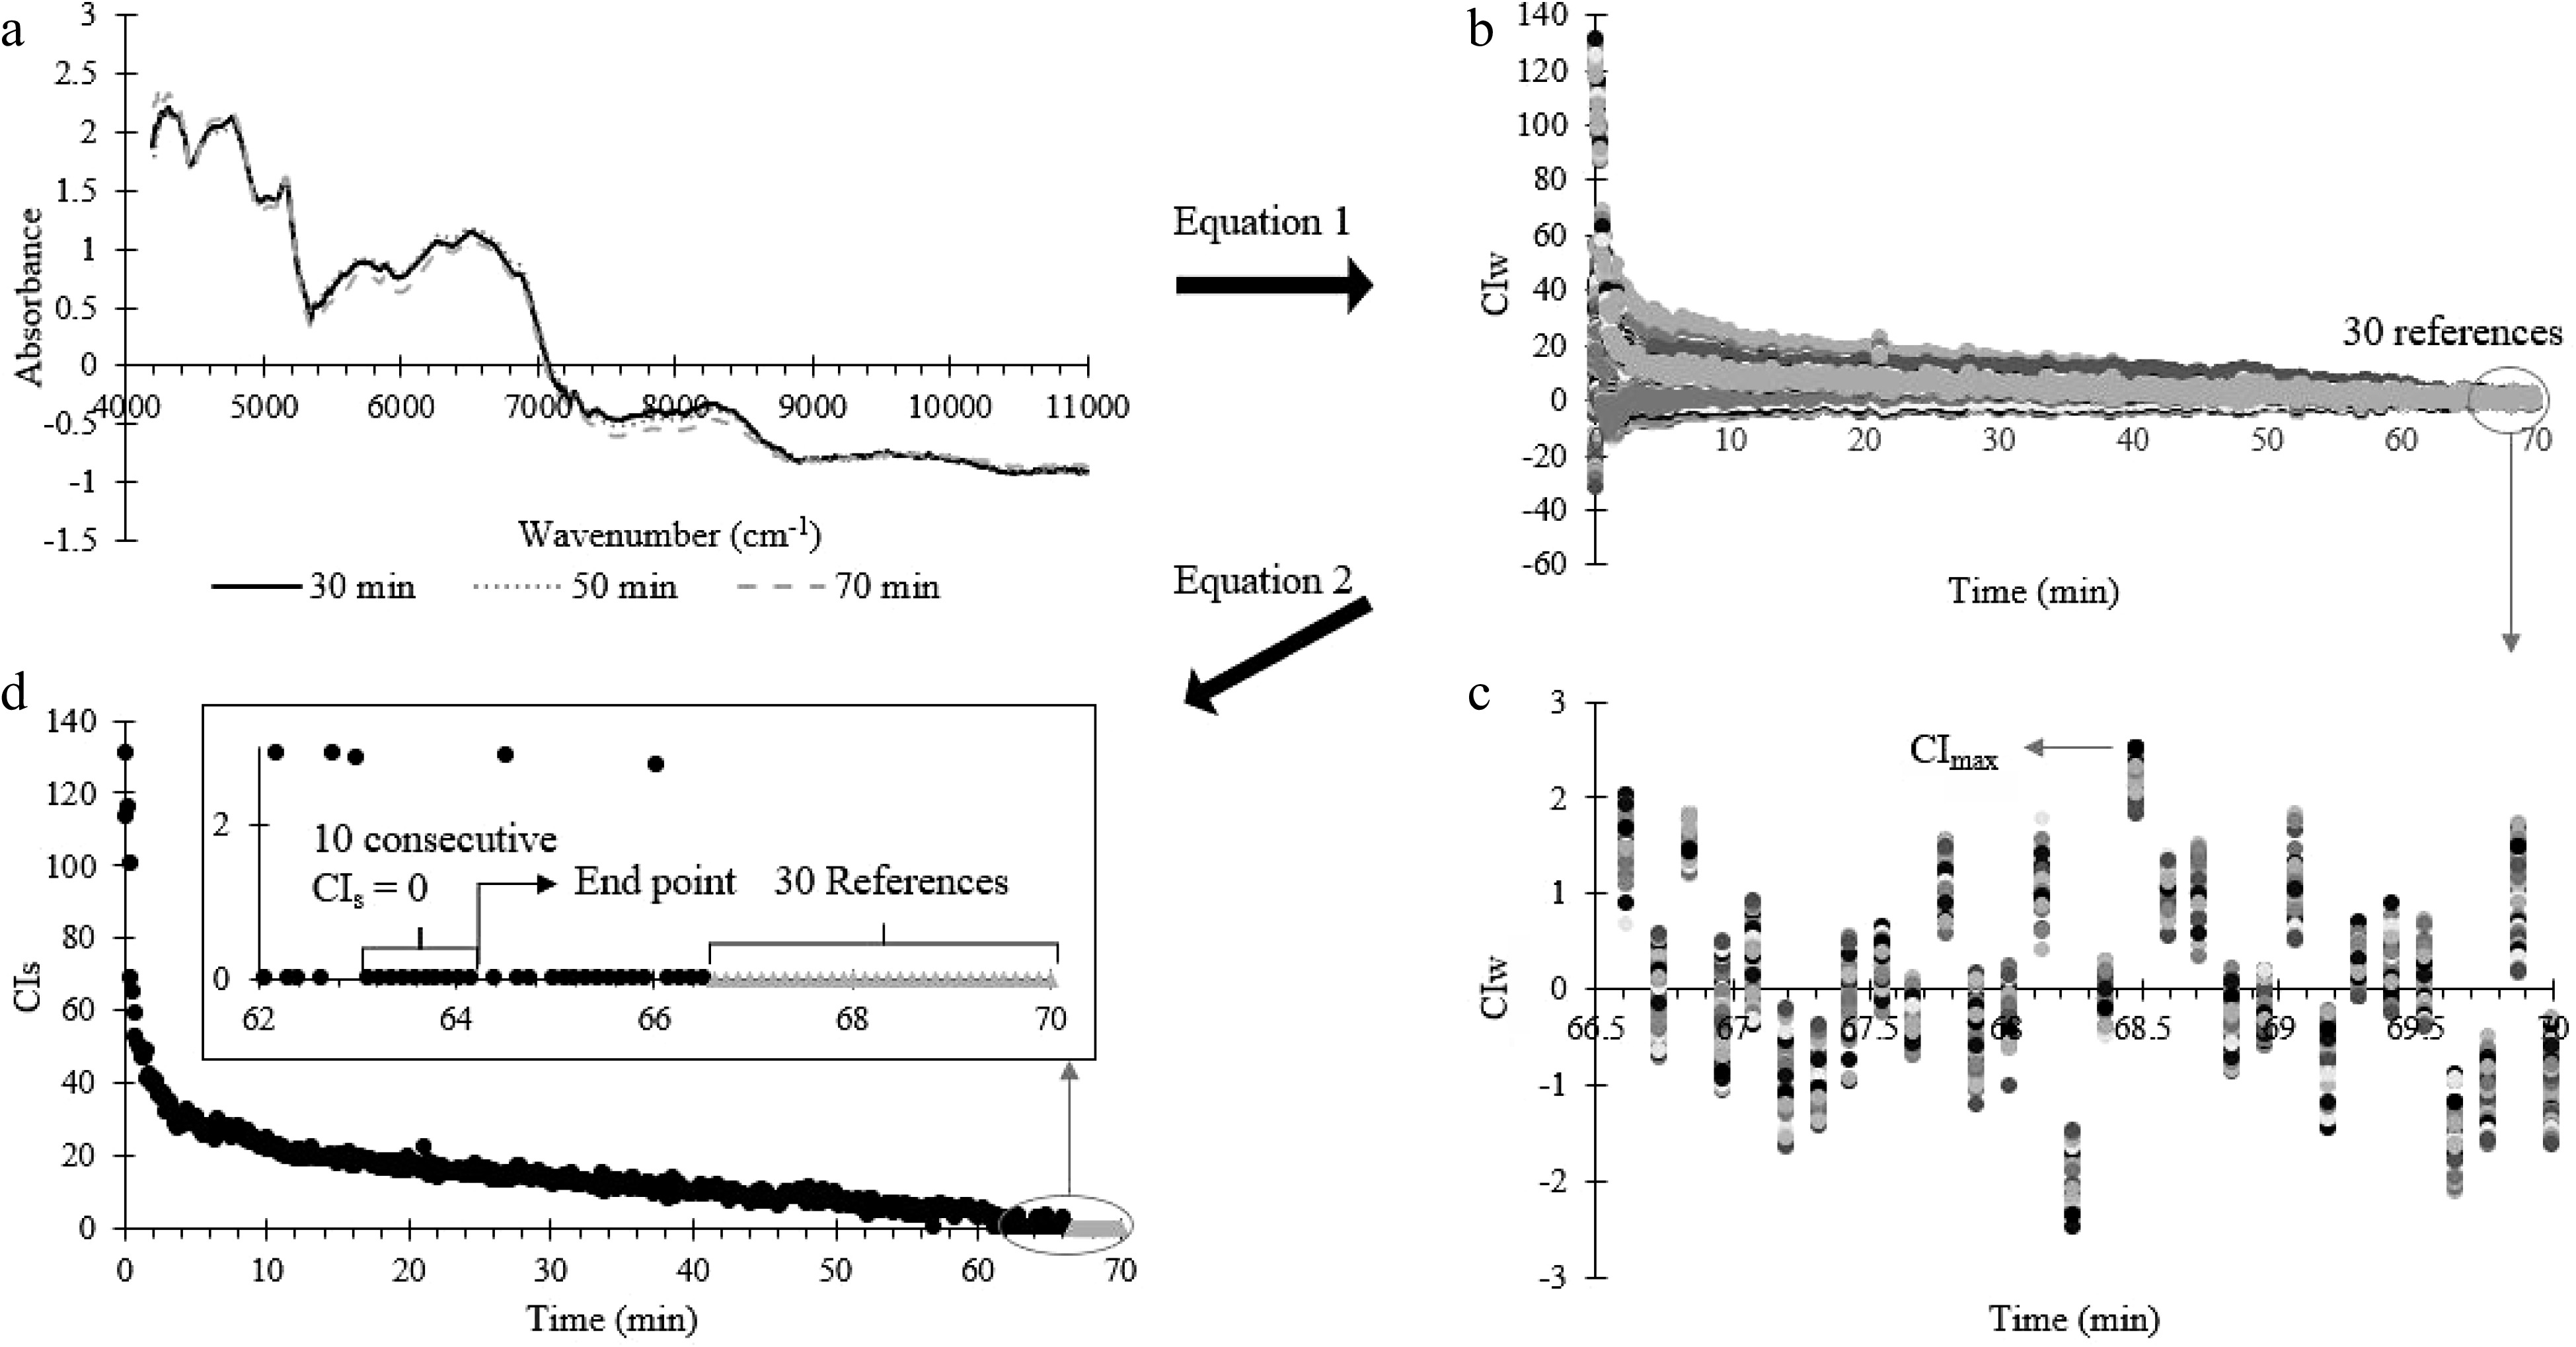
Figure 3.
Summary of the conformity index analysis process. (a) NIR spectrum (at 30, 50 and 70 min) processed by SNV. (b) CIw calculated from (a) at each blending time using Eqn 1. (c) The last 30 CIw for the last 30 reference spectrum (for uniformed powder). (d) Uniformity end point occurs when 10 consecutive CIs points are zero, where CIs were calculated using Eq. 2.
$ C{I}_{w}=\frac{AB{S}_{ref,w}-AB{S}_{test,w}}{S{D}_{ref,w}} $ (1) Where CIw is the conformity index at wavelength w,ABSref,w is the average absorbance of references points at wavelength w, ABStest,w is the absorbance of test points at wavelength w, SDref,w is the standard deviation among reference's spectrums at wavelength w.
After that, the CIw is reduced to one value (CIs) at each blending time using Eq. 2. The uniformity end point of the blending process is determined as the time when 10 consecutive CIs are consistently zero (Fig. 3b).
$ C{I}_{s}=\frac{C{I}_{high}}{n} $ (2) Where CIhigh is the sum of CIw that is higher than CImax, CImax is the maximum CIw of all reference spectra, n is the number of points with CIw > CImax.
Validation of the uniformity end point through offline FTIR spectroscopy
-
To validate the uniformity predicted by the NIR probe, a comparative offline measurement was conducted using a Fourier-transform Infrared (FTIR) spectrometer (Agilent Cary 630). First, a well-mixed SMF was created by blending the three components of SMF using a vortex mixer at 2,000 rpm (ZX3 Advanced, VELP Scientifica, Usmate Velatm, Italy).
The mid-infrared spectrum of a well-mixed SMF generated from offline FTIR is shown in Fig. 4. The key characteristic peaks due to lactose and protein were identified with the wavenumbers 3,324.785, 1,643.756, and 1,535.663 cm−1, which are consistent with the literature values (3,324.785 vs 3,320 cm−1, 1,643.756 vs 1,646 cm−1, and 1,524.481 vs 1,515 cm−1)[33−37]. The wavenumber ranges of each identified peak were marked and assigned accordingly (Fig. 4). The area under the key characteristic peaks within the marked region shown in Fig. 4 were calculated using 'MATLAB 9.7 R2019b' software (The MathWorks, Inc. Massachusetts, US).
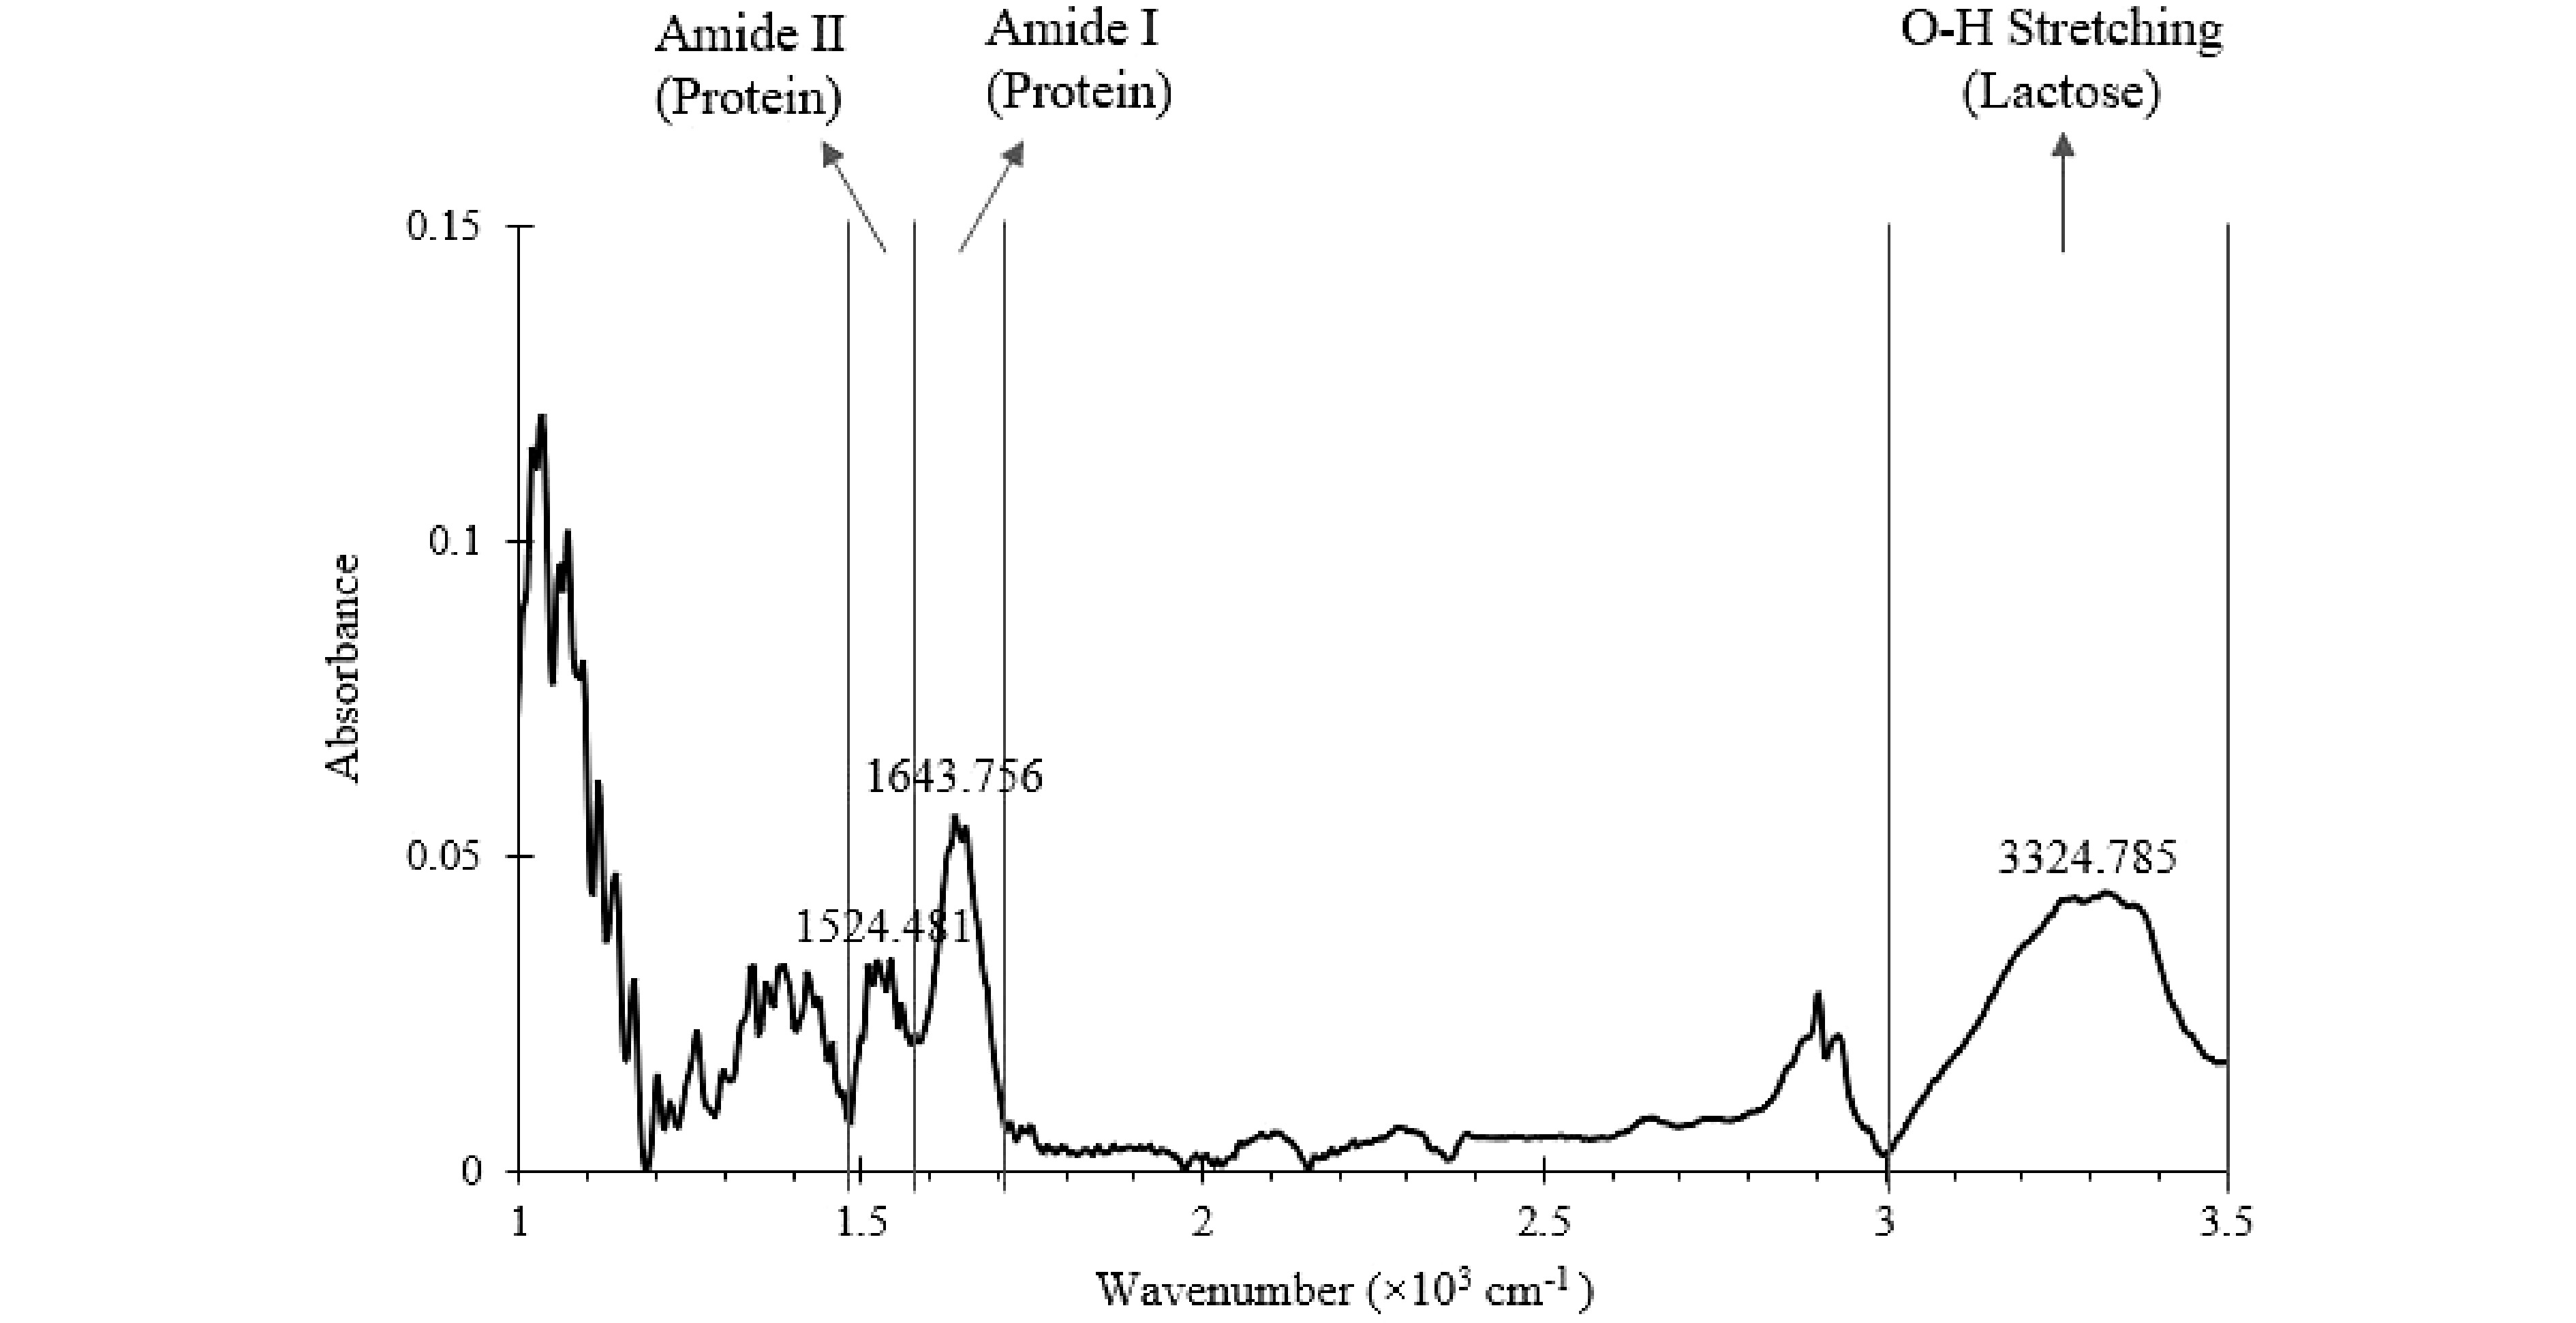
Figure 4.
Mid-Infrared spectrum of a well-mixed SMF (baseline corrected) generated from offline FTIR. The wavenumber ranges of key characteristic peaks are marked.
From the blender (Fig. 4), sampling was carried out at 10, 20, 30, 40, 50, 60, 120, 180, 210, and 240 min. At each blending time, the ratio (Rt) of the area under the O-H stretching peak (lactose) to the sum of the area under the amide I and amide II peaks (protein) was calculated. The same ratio (Rref) was calculated for a well-mixed reference, as an indication of the completion time of the blending process. When Rt is equal to Rref, the time will be considered as the uniformity end point as determined by offline FTIR. This end point was compared to the uniformity end point determined by inline NIR probe as validation.
Determination of the detection limit of the NIR probe
-
To demonstrate the feasibility of vitamin C detection using the NIR probe, vitamin C was added to the SMF at varying known concentrations (0, 0.5%, 1.5%, and 2 %) in the blender (Fig. 1) and the NIR spectrum was collected. The wavenumber ranges that correspond to O-H bond vibrational modes present in vitamin C[31,38−40] were labelled and identified in the NIR spectrum shown in Fig. 5. The absorbance values of the selected wavenumber ranges were then used to create a PLSR model using built-in MATLAB functions. The model was validated by fitting a known concentration of vitamin C (1%) into the model and calculating the % error.
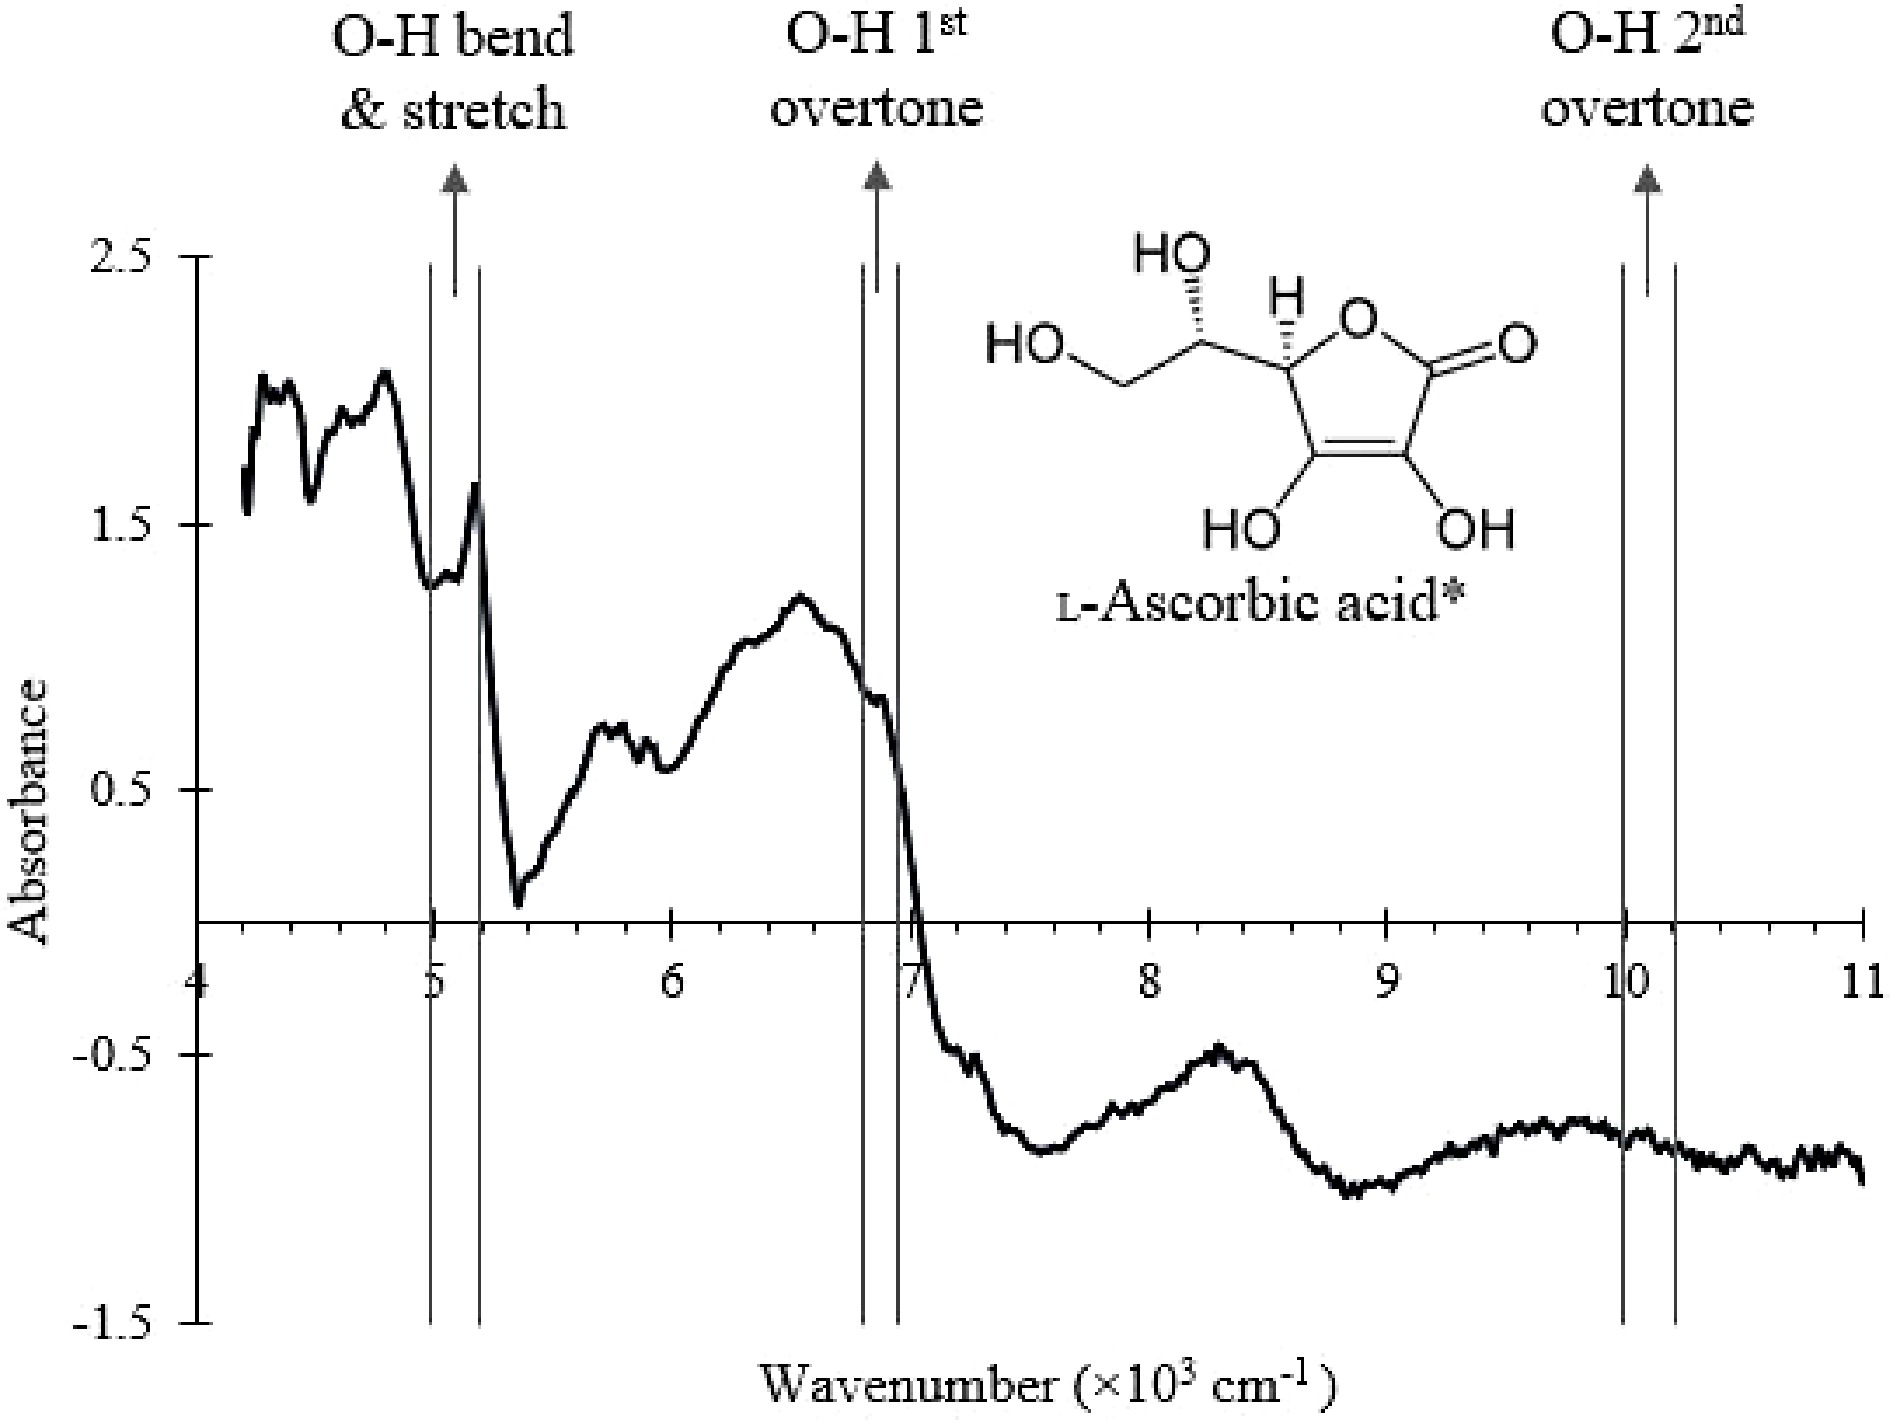
Figure 5.
NIR spectrum of the SMF with the wavenumber ranges that correspond to O-H bonds vibrational modes in ascorbic acid labelled.
Subsequently, the detection limit of the probe with respect to vitamin C was established by adding small amounts (0.001 to 0.4%) of vitamin C sequentially into the SMF. The NIR spectrum collected were fitted into the PLSR model, and the minimum concentration level of vitamin C that could be predicted accurately by the PLSR model was determined.
-
Using the conformity test method, the average uniformity end point of the SMF blending as determined by the NIR probe was 63.89 ± 2.06 min (Table 1).
Table 1. The uniformity end point predicted from fixed/dynamic reference conformity test and FTIR area ratio for three experimental runs using SMF.
Test methods Uniformity end point (min) Run 1 Run 2 Run 3 Average ± SD Fixed reference 61.72 65.80 64.17 63.89 ± 2.06 FTIR area ratio (interpolated) 56.3 56.1 57.4 56.6 ± 0.71 Dynamic reference 56.93 66.03 66.03 63.00 ± 5. 25 The ratio, Rt, of the area under the O-H stretching peak (lactose) to the sum of the area under the amide I and amide II peak (protein) was plotted against blending time (Fig. 6). The blend was assumed to be uniform when the area ratio of the sample (Rt) falls below the uniform line, which represents the calculated area ratio, Rref. As shown in Fig. 6, the area ratio of the replicates intersects the uniform line (Rt = Rref) between 50 and 60 min and the area ratio (Rt) are constantly below the uniform line. Therefore, the average uniformity end point as determined by FTIR was 56.6 ± 0.71 min (Table 1).
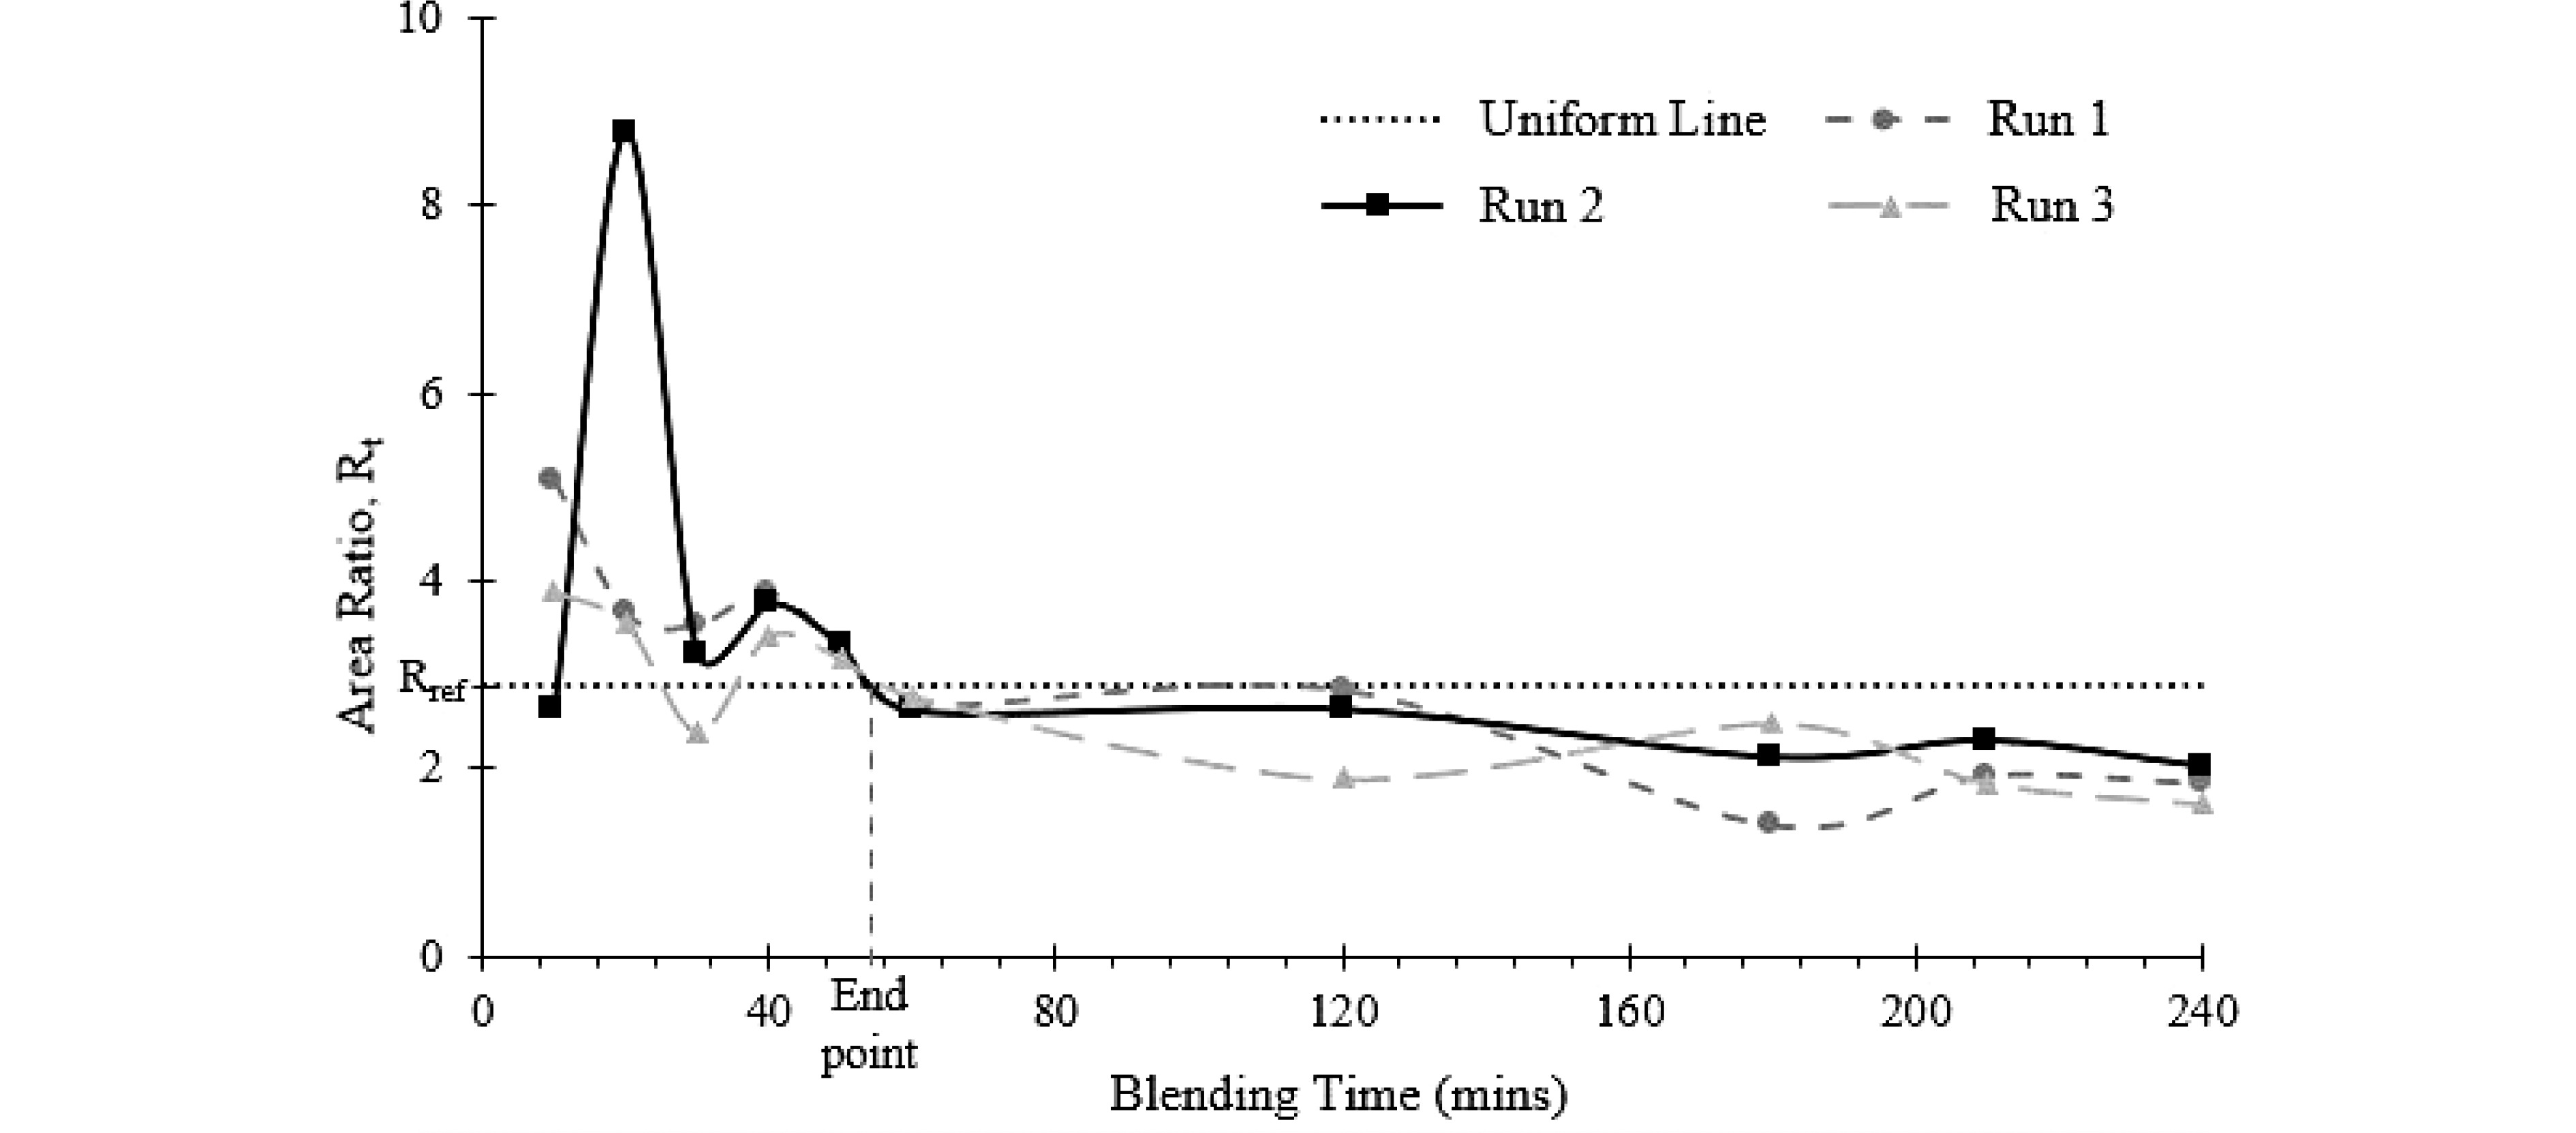
Figure 6.
Uniformity end point of the blending process determined from offline FTIR measurement. The uniformity end point is the time when Rt = Rref.
The uniformity end point measured by NIR (inline, fixed frame, blender) is generally higher than the one from FTIR (offline, vortex mixing). A statistical t-test showed that the inline and offline reading are significantly different (p-value = 0.0282) at 95% confidence level. The difference, however, is of the same order of magnitude. The different mixing method and the reference spectrum at long processing time (the 'presumed' steady state) may have contributed to the higher uniformity end point from NIR probe. The fixed reference frame method looked at the difference between the current state to the final state, any variation that is introduced into the system at a later stage would change the reference spectrum, making it difficult for the current stage to be considered as the uniformity end point. The inherent system variability is also illustrated in the FTIR data (Fig. 6), after the uniformity end point (at ~57 min), the Rf fluctuates at levels below Rref, but it did not settle to a 'steady state'. In the FTIR determination, uniformity end point was determined using a fixed Rf, which is a constant.
The results in Table 1 demonstrates the feasibility of the NIR probe as a PAT to monitor milk powder blending process. However, the uniformity end point cannot be determined inline if the reference frame's position is fixed at the end of the blending process. As such, further refinement to the definition of fixed reference frame (Fig. 3) is required to better suit inline detections and predictions.
Dynamic reference frame for inline uniformity end point determination
-
To determine the uniformity end point inline, modifications to the conformity test method must be made. As opposed to having the reference points being fixed as the last 30 spectra at the end of the blending process, the reference points must be dynamic (vary with time) (Fig. 7). This also better aligns with the characteristics of an inline monitoring process using a PAT as it incorporates the variation of spectra with time.
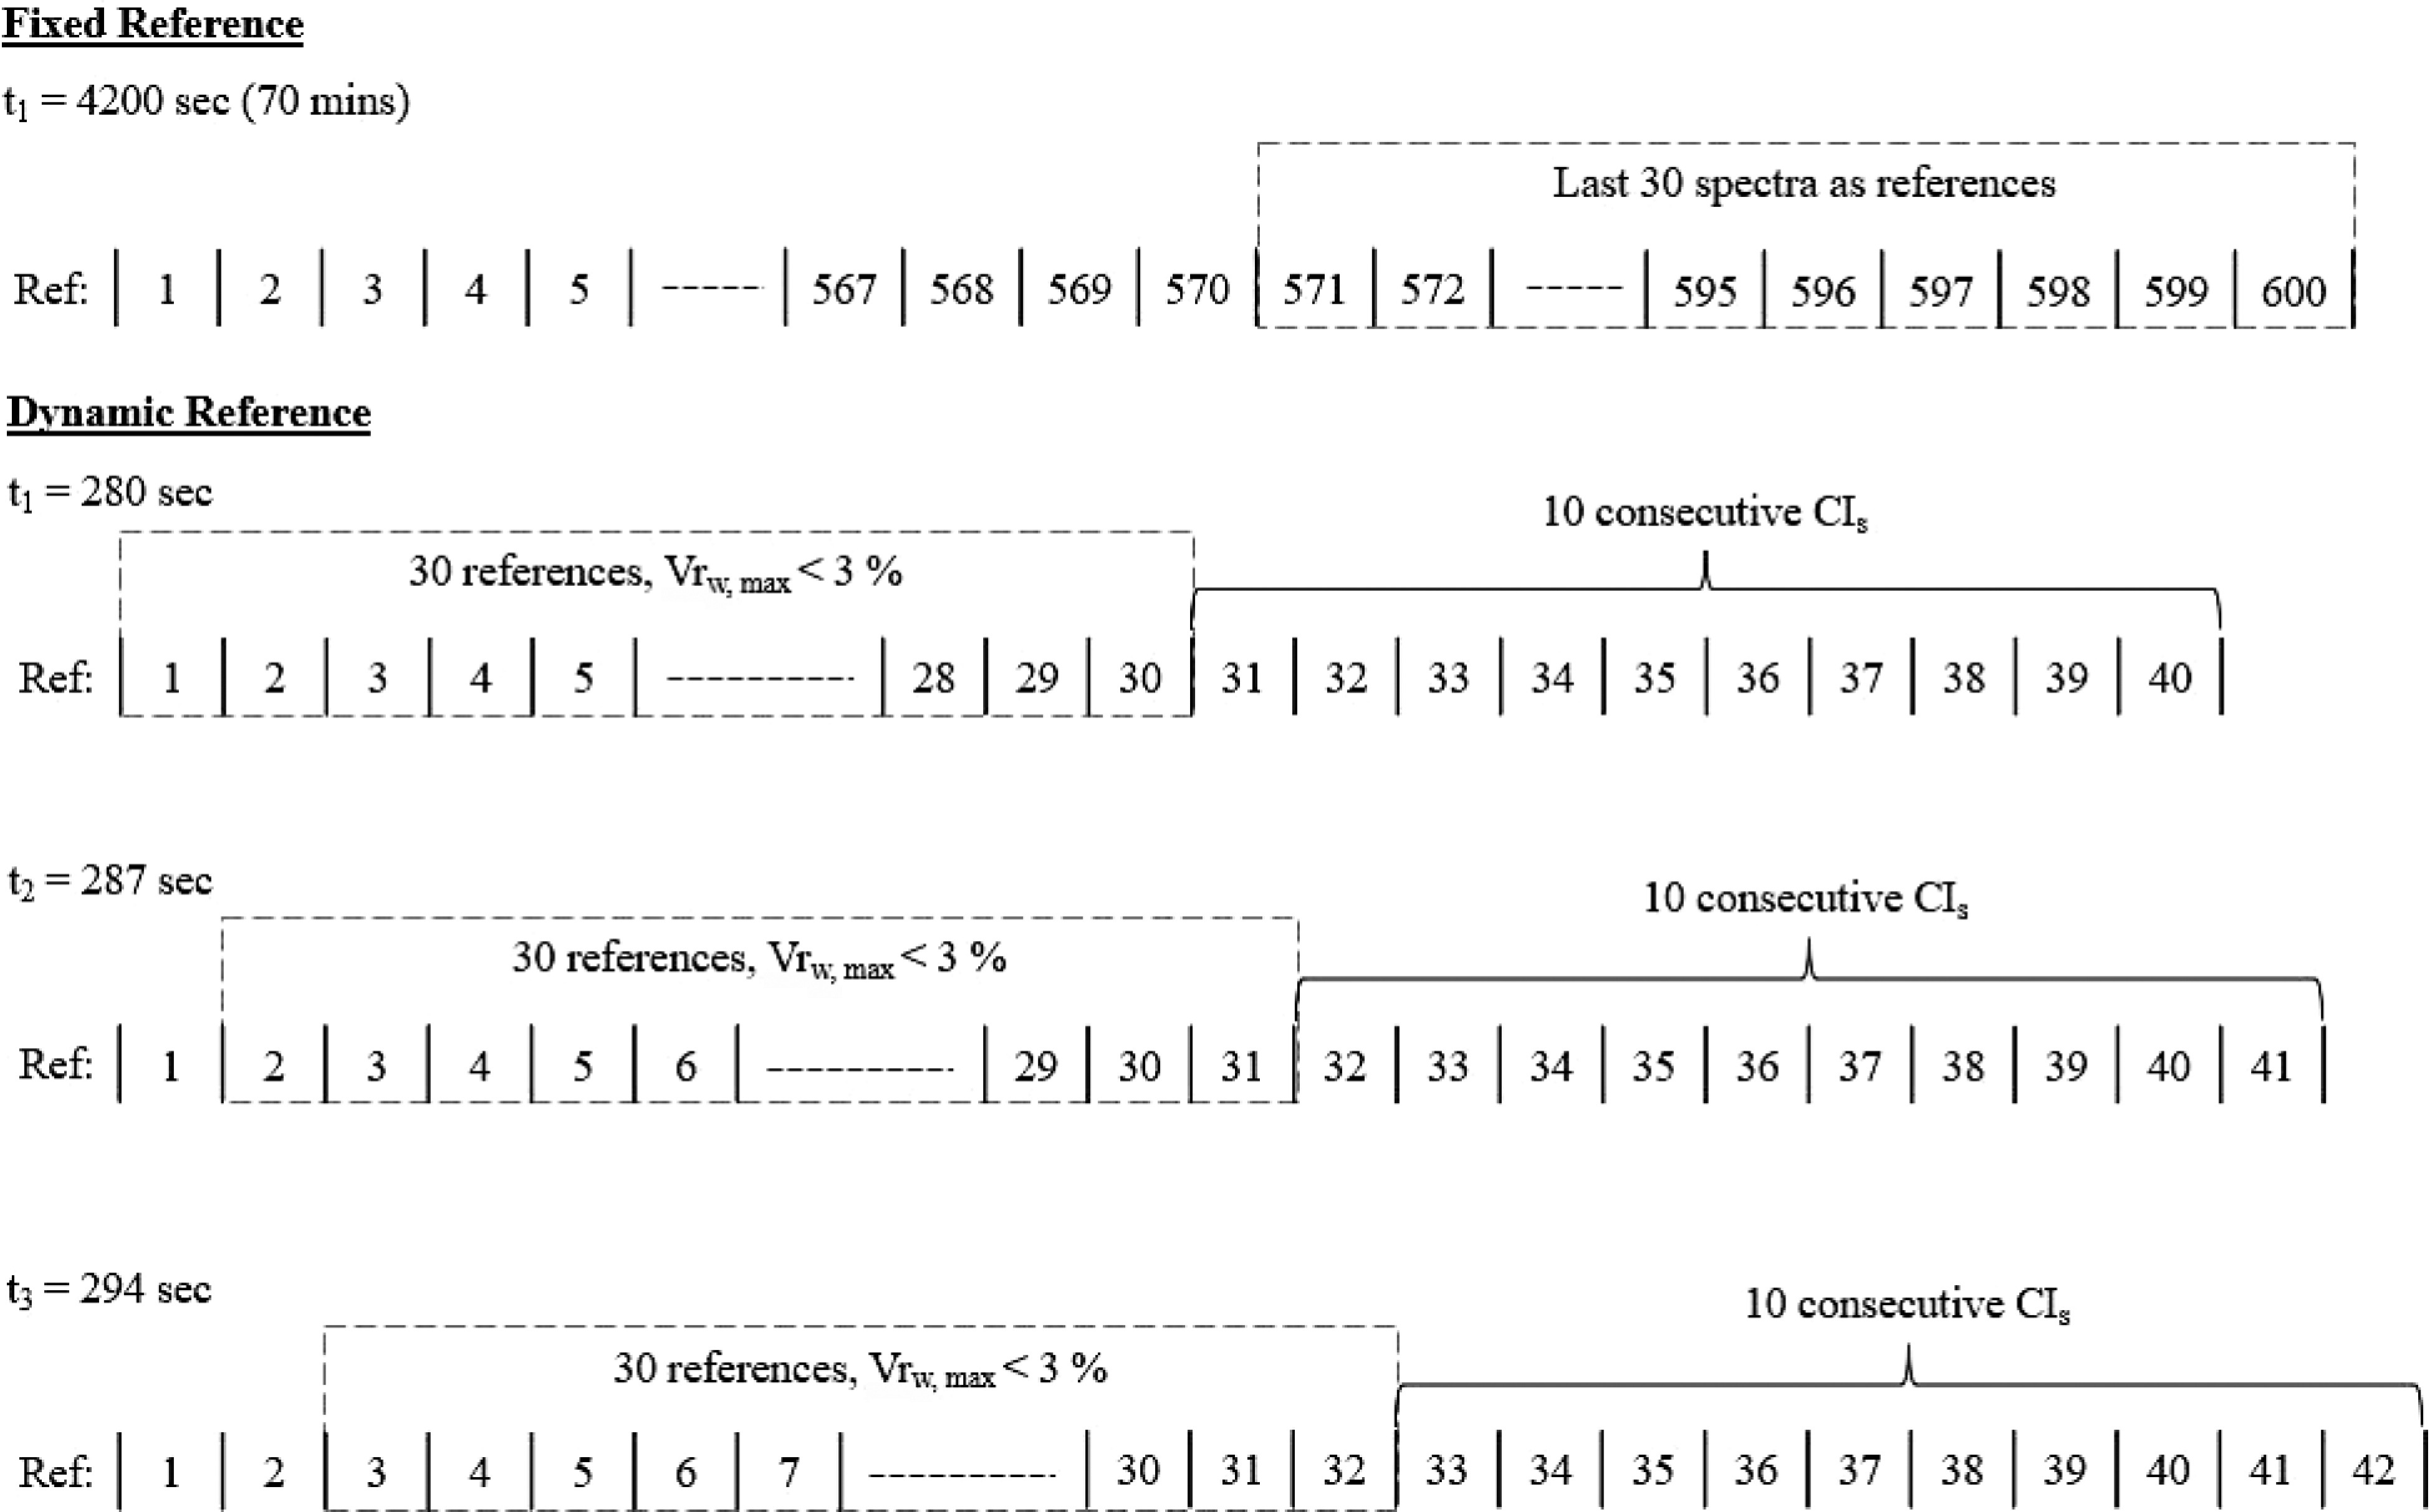
Figure 7.
Offline, fixed reference method vs. inline, dynamic reference method to determine uniformity end point.
For inline determination of the uniformity end point, a collection of 30 spectrum and CIs values are first defined as the reference points. The variability (Vrw, Eq. 3) within the reference spectrum is examined by calculating the ratio of the sum of the average absorbance of references points (ABSref,w) and the standard deviation among reference's spectrums at each wavelength, w (SDref,w).
$ V{r}_{w}=\frac{AB{S}_{ref,w}}{S{D}_{ref,w}} $ (3) If the maximum Vrw (Eq. 3) across all wavelengths (w) is less than 3%, it can be an indication of low variability within the 30 dynamic reference points.
Once maximum Vrw is less than 3%, uniformity is achieved if the next 10 consecutive CIs values after the 30 defined points are zero. If they are not zero, the reference points continue to move forward until the next 10 consecutive CIs values are zero. The inline determination of uniformity end point is illustrated in Fig. 7.
The dynamic reference algorithm was deployed and applied onto the SMF the blending process. The average uniformity end point predicted using the described method was determined to be 63.00 ± 5.25 min (Table 1). A single factor ANOVA was conducted for all tests listed in Table 1. At 95% confidence level, the ANOVA tests revealed no significant difference between the three methods (p-value = 0.066). In short, the end point obtained from dynamic reference algorithm is comparable to the end point from fixed reference frame and FTIR measurements.
Determination of detection limit of vitamin C
-
The PLSR model shown in Fig. 8 was constructed using the NIR spectrum collected at 0, 0.5%, 1.5% and 2% vitamin C levels. The PLSR model fits the data well (R2 = 0.9763). This model was also validated with the experimental data using 1% vitamin C concentration as described in the 4th sub-section of the method section. Using the NIR spectrum obtained from the experiment, the PLSR model predicted a concentration of 1.04% ± 0.18%. The predicted concentration only had a 4% error compared to the actual concentration of 1%. The validation data and the R2 (Fig. 8), demonstrated that the PLSR model performed satisfactorily, and is suitable to predict the vitamin C content in the SMF mixtures.
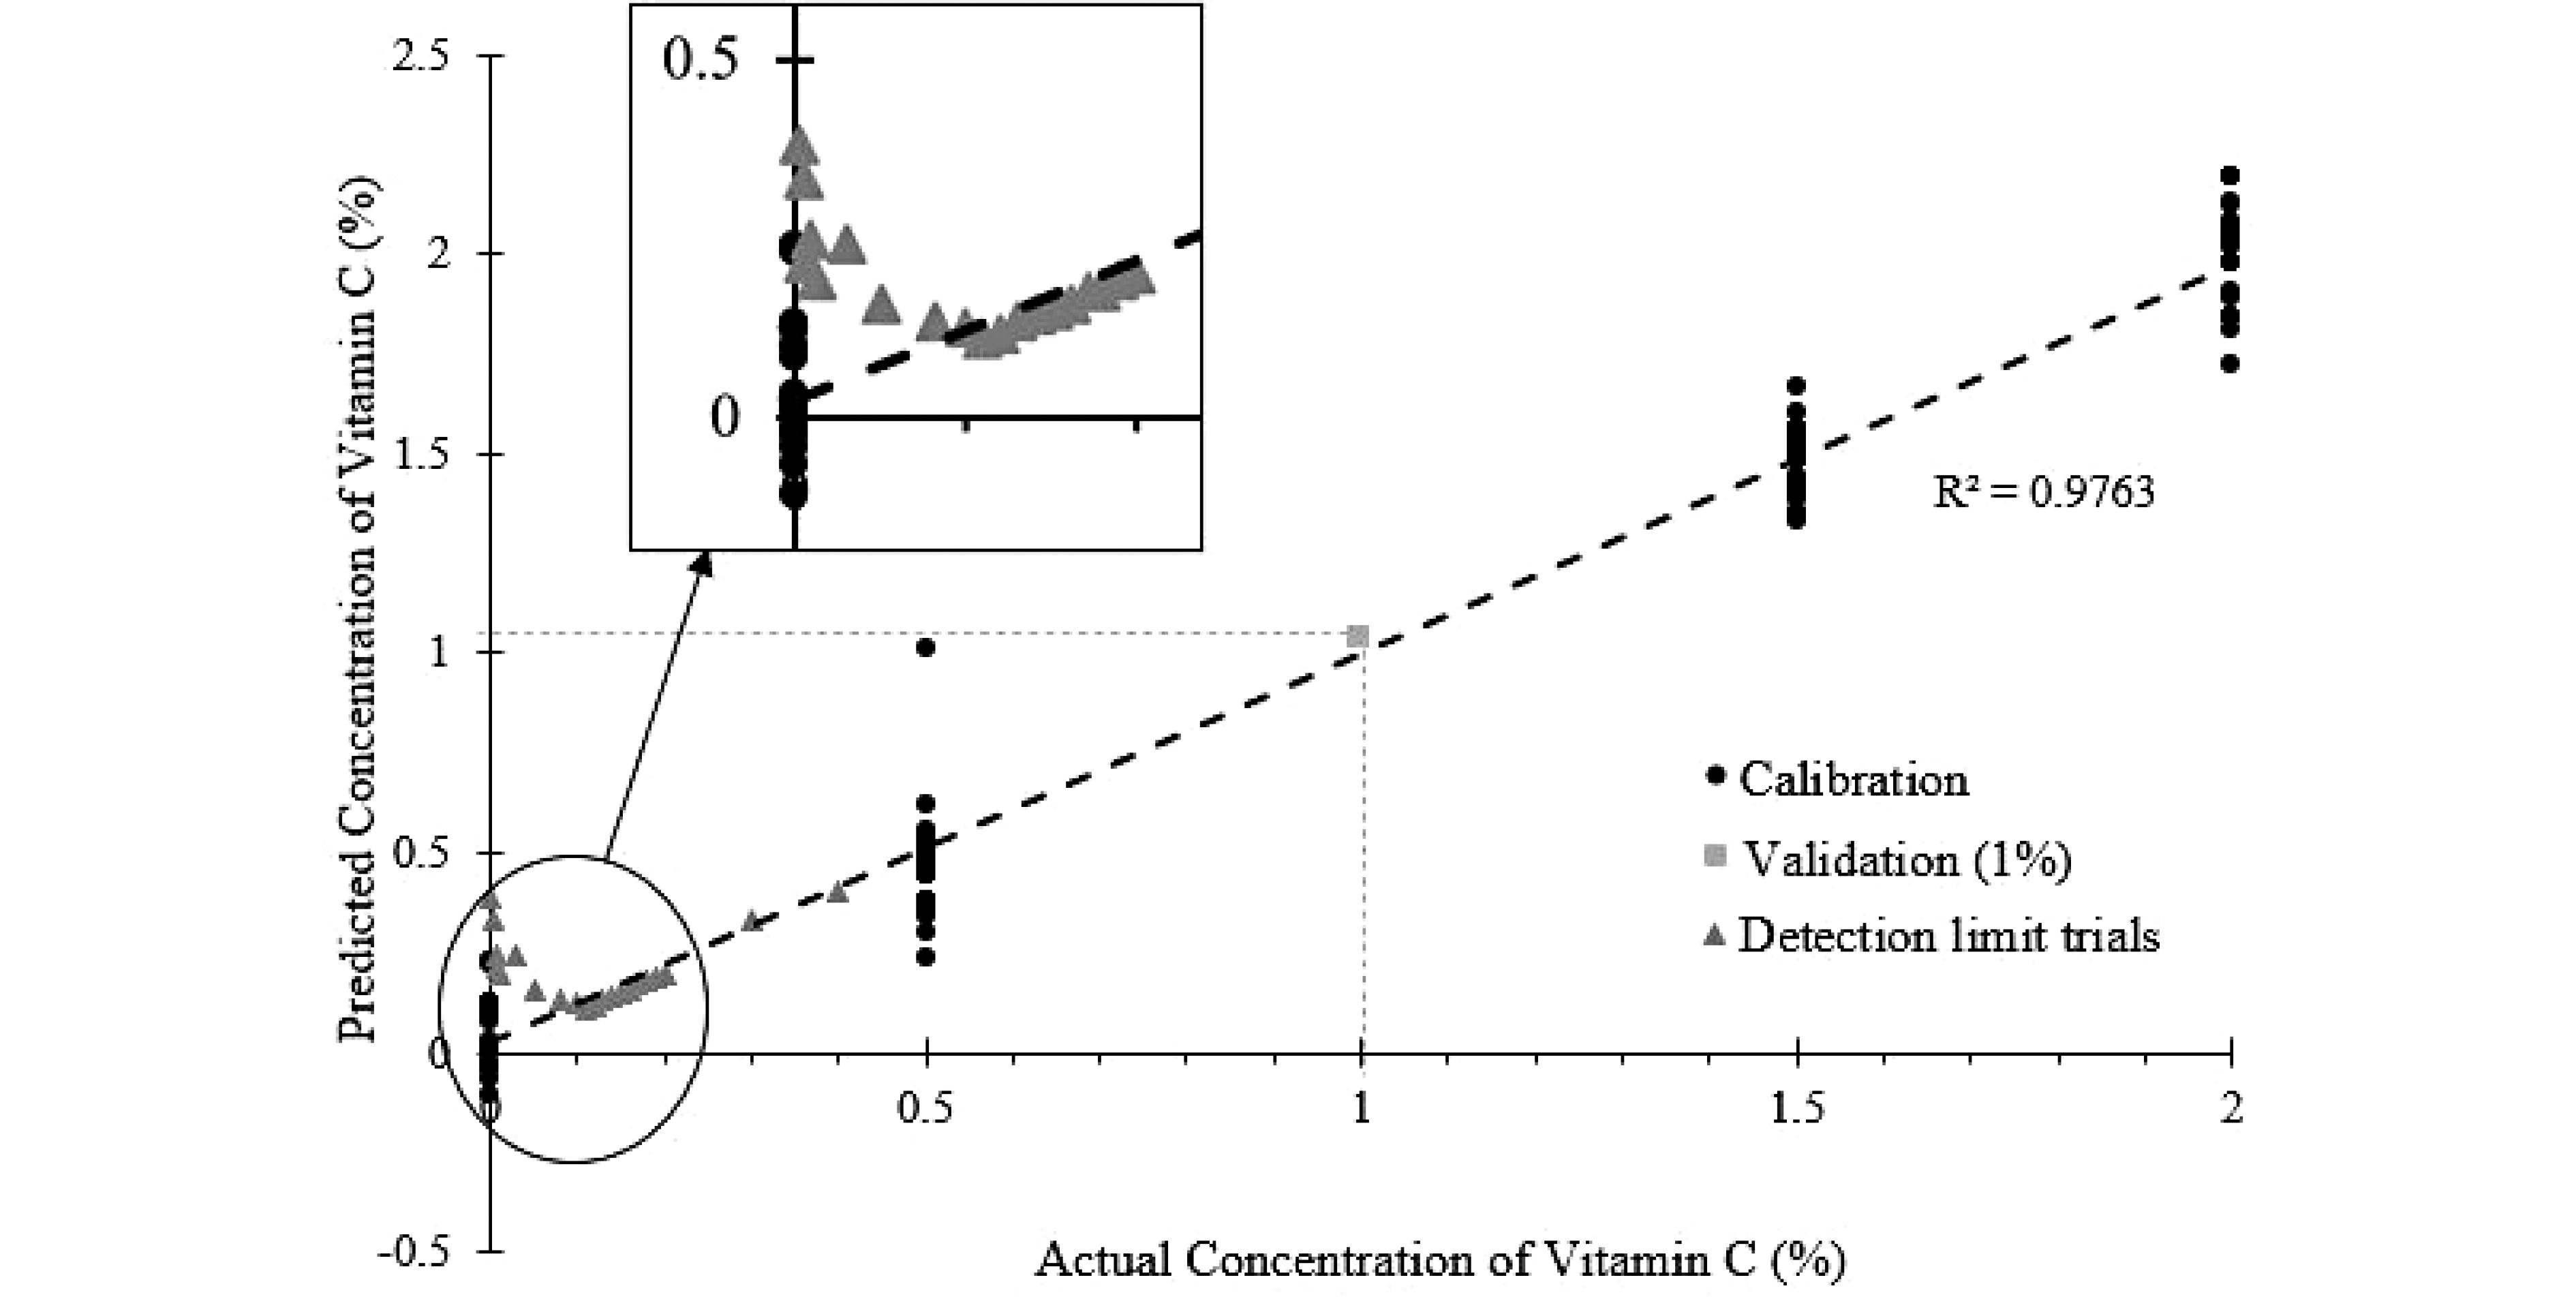
Figure 8.
PLSR model of predicted vitamin C concentration against the actual vitamin C concentration, with measurements at lower-level concentrations of vitamin C shown.
To establish the detection limit of the NIR probe, vitamin C was gradually dosed into the SMF, starting at a concentration of 0.001%. From Fig. 8, it is evident that the PLSR model failed to predict Vitamin C concentration level below 0.11%. At concentration level above 0.11%, the error between predicted and experimental value is generally below 2%. Below 0.11%, the error increases exponentially. This level is higher than the fortified vitamin C level in infant milk formula (approximately 0.035%)[21]. Therefore, offline trace analysis is still required for the quantification of vitamins.
-
NIR was shown to be a viable PAT that can be used to adequately predict the uniformity end point of milk powder blending process. The average predicted uniformity end point using the inline NIR fixed/dynamic reference conformity test and offline FTIR measurement were comparable. Using a series of known concentration of vitamin C, a PLSR model was constructed and validated. Overall, there is a good agreement between the predicted and actual concentration of vitamin C in the SMF. The detection limit of the NIR probe with respect to vitamin C was determined to be 0.11%, which is higher than the level in infant milk powder.
This work was financially supported by the Agency for Science, Technology and Research (A*STAR) under its AME Young Individual Research Grant Scheme (Project #A188c0021).
-
The authors declare that they have no conflict of interest.
- Copyright: © 2023 by the author(s). Published by Maximum Academic Press on behalf of Nanjing Agricultural University. This article is an open access article distributed under Creative Commons Attribution License (CC BY 4.0), visit https://creativecommons.org/licenses/by/4.0/.
-
About this article
Cite this article
Tristan G, Tay KH, Wong SY. 2023. Near-infrared probe as a quality control tool for milk powder blending processes. Food Materials Research 3:3 doi: 10.48130/FMR-2023-0003 

Near-infrared probe as a quality control tool for milk powder blending processes
- Received: 14 February 2023
- Accepted: 24 February 2023
- Published online: 17 March 2023
Abstract: This study aims to evaluate the suitability and reliability of Process Analytical Tools (PAT) in monitoring milk powder blending processes. The uniformity end point was predicted using a Near-Infrared (NIR) probe, and subsequently validated using offline Fourier Transform Infrared Spectroscopy (FTIR). A standard milk formulation (SMF) made up of 50% lactose, 40% skim milk powder, and 10% whey protein concentrate was used. Additionally, the detection limit of the NIR probe was investigated using vitamin C powder. The average predicted uniformity end point using the inline NIR fixed reference (63.89 ± 2.06 min), and dynamic reference conformity test (63.00 ± 5.25 min) were comparable with the offline FTIR measurement (56.6 ± 0.71 min). A three-component Partial Least Square Regression (PLSR) model was constructed and validated for vitamin C. The detection limit is 0.11%, which is higher than the vitamin C level commonly found in most infant milk formula (0.035%).