


-
As one of the three major drinks worldwide, tea is famous for its unique aroma, sweet taste and potential health benefits such as anti-oxidation, anti-aging and bacteriostasis and so on[1]. Scented tea is a unique reprocessed tea in China, with a history of more than 1,000 years. It mainly uses green tea, black tea or oolong tea as the tea matrix, and fragrant flowers as the raw materials. The manufacturing process of scented tea is complicated, which generally includes a series of processes such as preprocessing the tea matrix, treatment of fresh flowers, mixing the flowers with the base tea (scenting process), spreading out the mixture for heat dissipation, re-heaping up and scenting, separating the flowers from the tea, heating, and cooling[2]. Among them, the scenting process is the most important[3]. Generally, the process of mixing flowers with tea is repeated two to three times to ensure that the tea fully absorbs the aroma of the flowers. According to the different varieties of flowers, scented tea is mainly divided into jasmine tea, magnolia tea, osmanthus tea, gardenia tea (GET) and so on[4,5]. GET is a blend of green tea and gardenia (fragrant, elegant and long-lasting aroma), which has both the mellow taste of green tea and the fragrance of gardenia. However, to the best of our knowledge, the aroma profiles of GET have not been systematically investigated in detail.
Aroma is one of the important indicators to evaluate the quality of tea, although aroma components only account for 0.07% of the total chemical composition of tea. The aroma profile of GET is a comprehensive expression of different types and contents of volatile compounds. Traditional flavor quality evaluation mainly relies on artificial sensory evaluation, which has individual differences and is easily affected by environmental factors. As an important supplement to artificial sensory evaluation, intelligent sensory evaluation technology is playing an increasingly important role in the field of flavor[6]. As a novel electronic nose (E-Nose) technology, the gas chromatography E-Nose (GC-E-Nose) realizes the rapid separation of volatile compounds by using two chromatographic columns with different polarities. Currently, it has been successfully applied in analysis of geographical differences, variety identification and so on[7−9]. Gas chromatography-mass spectrometry (GC-MS) is the most commonly used and important instrumental technique in food flavor analysis. However, as the complexity of the subjects increases, traditional one-dimensional gas chromatographic analysis presents the defects of small peak volume and co-elution of impurities and target volatile compounds[10]. Comprehensive two-dimensional gas chromatography-time-of-flight mass spectrometry (GC × GC-TOFMS) which combines two columns with different polarities but independent of each other, shows great potential in food flavor analysis[1,11,12]. It has the advantages of high resolution and huge peak capacity, which greatly improves the separation capability and analysis speed. For example, Yang et al. identified 243 volatile compounds during the variable-temperature final firing of Congou black tea by using GC × GC-TOFMS[13]. Nevertheless, only a few volatile compounds are considered to contribute to the overall aroma. Gas chromatography-olfactory-mass spectrometry (GC-O-MS) and odor activity value (OAV) analyses are commonly used to uncover the key odor-active components and assess their contributions[14]. Chen et al. used GC × GC-TOFMS and OAV analysis to characterize the key components of different grades of Dianhong black tea, and seven key odorants with OAV ≥ 1 were screened out[11]. To date, the use of chemometrics to extract effective information from large amounts of data is an important strategy in the field of food flavor. Through the application of mathematics, statistics, and computer science, chemometrics can maximize the acquisition of target information from complex data. Commonly used principal component analysis (PCA), partial least squares discriminant analysis (PLS-DA), orthogonal PLS-DA (OPLS-DA), correlation analysis and other methods have been widely used in the screening of differential flavor substances in tea[15,16].
Therefore, the present study aimed to systematically investigate the volatile profiles and aroma wheel of GET using GC-E-Nose, GC-O-MS and GC × GC-TOFMS combined with chemometrics. The results not only enrich the theoretical research of the characteristic components of GET, but also provide a good reference for the development of other scented teas.
-
Twenty-mL headspace vials capped with 18 mm magnetic PTFE/silicone were purchased from Agilent Technologies Inc. (Palo Alto, CA, USA). Carboxen/polydimethylsiloxane (CAR/PDMS, 85 μm) fiber was purchased from Supelco (Bellefonte, PA, USA). Ethyl decanoate was purchased from Shanghai Aladdin Biochemical Technology Co., Ltd (Shanghai, China). Purified water was obtained from Hangzhou Wahaha Group Co., Ltd (Hangzhou, China). Gardenia (GE) and GET were purchased from tea market, and identified by senior tea experts from Tea Research Institute, Chinese Academy of Agricultural Sciences.
Sensory evaluation
-
Sensory evaluation on GET was carried out according to the method of Xu et al. with slight modification[17]. In short, the GET samples were evaluated by six panelists (three males and three females aged 25–40 years) recruited from Tea Research Institute, Chinese Academy of Agricultural Sciences. GET (3 g) were accurately weighted into a white cup, and then 150 mL of boiling water was added. The first brewing was 3 min, and the second brewing was 5 min. Panelists were required to focus on reviewing the aroma of GET and discuss the aroma properties of GET combined with the comprehensive evaluation results of two brewing. A total of six aroma attributes including 'fruity', 'floral', 'green', 'woody', 'roasted', and 'other' were adopted after discussion.
GC-E-Nose analysis
-
The samples of GE and GET were analyzed by GC-E-Nose (Alpha M.O.S., Toulouse, France). The method parameters were referred to our previous study with slight modification[18]. Firstly, samples (0.5 g) were weighed into a 20-mL sealed glass vial. Subsequently, the headspace glass vial was placed into the incubator incubated at 60 °C for 20 min. Then, 5,000 μL of headspace gas was injected into the injection port with a temperature of 200 °C. The volatile compounds were absorbed by an embedded odor concentrator (Tenax TA, USA) at 20 °C for 27 s. The temperature program was as follows: at 50 °C for 5 s in the initial stage, from 50 to 80 °C at 0.1 °C/s, and from 80 to 250 °C at 0.4 °C/s (holding for 100 s). The temperature of two flame ionization detectors (FID) was 260 °C.
Volatile compounds analyzed by GC × GC-TOFMS
-
The volatile compounds in GE and GET were extracted using headspace solid phase microextraction (HS-SPME). The specific parameters were as follows: the samples (0.5 g) were accurately weighted and placed into a 20-mL headspace vial, then 5 mL purified water and 2 μL internal standard (ethyl decanoate, 100 mg/L) were added and mixed. The headspace vial was screwed on and placed in the corresponding sample tray. Subsequently, the sample was incubated at 60 °C for 60 min with CAR/PDMS fiber. After extraction, the fiber was inserted into the injection port of GC × GC-TOFMS for thermal desorption (at 270 °C for 5 min).
The aroma components were analyzed by using Agilent 7890B GC coupled to LECO Pegasus 4D TOFMS (Leco Corporation, St. Joseph, MI, USA). The Rxi-5Sil (30 m × 0.25 mm × 0.25 μm, Restek, Bellefonte, PA, USA) and RXI-17 (1.69 m × 0.15 mm × 0.15 μm, Restek, Bellefonte, PA, USA) were used as the 1st D column and 2nd D column to separate the volatile compounds, respectively. Helium (99.999%) was used as carrier gas at a constant flow of 1 mL/min, and the splitless mode was used. The programmed temperature parameters of the 1st D column were as follows: initially at 50 °C for 2 min, then increased to 272 °C at a rate of 8 °C/min (holding for 5 min). And the programmed temperature parameters of the 2nd D column were increased by 5 °C on the basis of the 1st D column. In brief, the first stage was 55 °C (initial temperature) for 2 min, and the second stage was from 55 to 277 °C at 8 °C/min, holding for 5 min. The modulator period was set to 5.00 s. The ion source temperature was performed at 220 °C, and the mass spectrum range was 33~500 m/z. The electron ionization (EI) mode was at 70 eV, with a detector voltage of 1,450 V.
Gas chromatography-olfactory-mass spectrometry analysis
-
The analysis of volatile compounds was performed on an Agilent 8890/5977 Gas chromatography-mass spectrometry (Agilent Technologies, CA, USA) equipped with an olfactory detector port (ODP4, Gerstel, Germany). In brief, 1-g tea sample were introduced into 20-mL headspace vial, and then 5 mL pure water was added. Subsequently, the volatile compounds were extracted at 60 °C for 60 min with a DVB/CAR/PDMS fiber. After extraction, the fiber was inserted into the injection port for thermal desorption (about 5 min). The effluent was split 1:1 after HP-INNOWAX column (60 m × 250 μm × 0.25 μm) separation, and then eluted to the MS detector and sniffing port. And the heating program of GC was as follows: initial oven temperature was 50 °C for 5 min, raised to 180 °C at 3 °C/min (holding for 1 min), then raised to 230 °C at 10 °C/min (holding for 8 min). Helium (99.999%) was used as carrier gas at a constant flow of 1 mL/min. The MS was operated in electron impact ionization mode at 70 eV with a mass range of 30–500 m/z. The temperature of ion source was 230 °C.
The analyses were performed by six trained panelists (three females and three males aged between 25 and 40 years). For direct intensity analysis, the aroma intensities (AI) of the volatile compounds were requested to be recorded from 1.0 to 4.0, where '1.0' was weak, '2.0' was moderate, '3.0' was strong and '4.0' was extremely strong. In addition, panelists were required to describe the odor perceived during the sniffing process.
Qualitative and quantitative analysis of volatile components
-
The retention index (RI) was calculated according to the linear formula of n-alkanes C7-C40, by comparison with theoretical retention value in the literature (
https://webbook.nist.gov/chemistry/ andwww.flavornet.org/flavornet.html ). The volatile components were quantified using the following formula:Ci = (Cis × Ai)/Ais
Where, Ci is the concentration of a volatile components to be measured, μg/L; Ai is the peak area of a volatile component to be measured; Cis is the concentration of ethyl decanoate (internal standard), μg/L; Ais is the peak area of ethyl decanoate.
Odor activity value analysis
-
The odor activity value (OAV) is used to evaluate the contribution of volatile components to the overall aroma. Volatile compounds with OAV ≥ 1 were considered to contribute significantly to the overall aroma. The OAV of a volatile compound was calculated as the ratio of its concentration to the threshold in water. The calculation formula of OAV was as follows:
OAV = Ci/OTi
where, OTi represents the threshold value of a volatile compound in water; Ci represents the concentration of a volatile component.
Statistical analysis
-
All experiments were repeated three times. The PCA and PLS-DA were carried out using SIMCA-P 13.0 software (Umetrics, Umea, Sweden). The significance analysis was based on one way analysis of variance (ANOVA) using SPSS 20.0 software (SPSS Inc., Chicago, IL, USA). And the bar chart was drawn with Origin 2019 software (OriginLab Corporation, Northampton, MA, USA). The aroma wheel of key compounds was drawn by Excel 2019 software (Microsoft Corporation, USA). Heatmap was produced using Chiplot (
www.chiplot.online/#Heatmap ). -
As an important intelligent sensing technology, E-Nose can identify and judge different samples utilizing the rapid response characteristics of different types of sensors to specific volatile compounds. However, the sensor is prone to sample contamination, resulting in reduced sensor response. Compared with traditional E-Nose, the GC-E-Nose realizes the rapid separation of volatile compounds by combining MXT-1701 (medium polar) and MXT-5 (non-polar) columns, and qualitative characterization of volatile compounds by assembling the FID detectors.
In the study, the radar fingerprints of GE and GET were shown in Supplemental Fig. S1. Each peak represents a volatile compound, the peak area indicates the content of a volatile component, and the higher the peak area, the higher the content. It could be found that the number of peaks on two chromatographic columns in GE was more than that in GET. Moreover, there were more peaks on the MXT-5 column than on the MXT-1701 column. As an unsupervised statistical method, PCA is the most widely used data dimensionality reduction algorithm. In this study, PCA was adopted to analyze the volatile fingerprints of GE and GET. As shown in Supplemental Fig. S2, obvious spatial distribution characteristics was observed between GE and GET. The contribution rate of PC1 reached 77.31%, the contribution rate of PC2 reached 9.43%, and the cumulative contribution rate reached 86.74%. The above results showed that GC-E-Nose combined with PCA could realize the difference comparison and rapid differentiation between GE and GET.
Characterization of volatile compounds in GE and GET by GC × GC-TOFMS
Identification of volatile compounds in GE and GET
-
GC × GC-TOFMS, which combines the advantages of two-column amplification of peak capacity and high resolution of TOF-MS, is one of the most important analytical technologies in food flavor[19,20]. The total ion chromatograms of GE and GET were shown in Supplemental Fig. S3. Through the spectrum library search and retention index authentication, a total of 188 volatile compounds (including 25 alcohols, 21 aldehydes, 10 alkanes, 31 alkenes, 21 aromatic compounds, 57 esters, nine heterocyclic compounds, 11 ketones, and three acids) were identified in GE, while 202 volatile compounds (including 26 alcohols, 20 aldehydes, 10 alkanes, 32 alkenes, 21 aromatic compounds, 66 esters, 10 heterocyclic compounds, 15 ketones, and two acids) were identified in GET by GC × GC-TOFMS (Fig. 1a & Supplemental Table S1). Esters, alkenes and alcohols were the dominant categories in both samples, which accounted for 32.67%, 15.84% and 12.87% in GET, and 30.32%, 16.49% and 13.30% in GE, respectively (Fig. 1b). It is worth mentioning that 179 common volatile compounds were detected in both GE and GET (Fig. 1c).
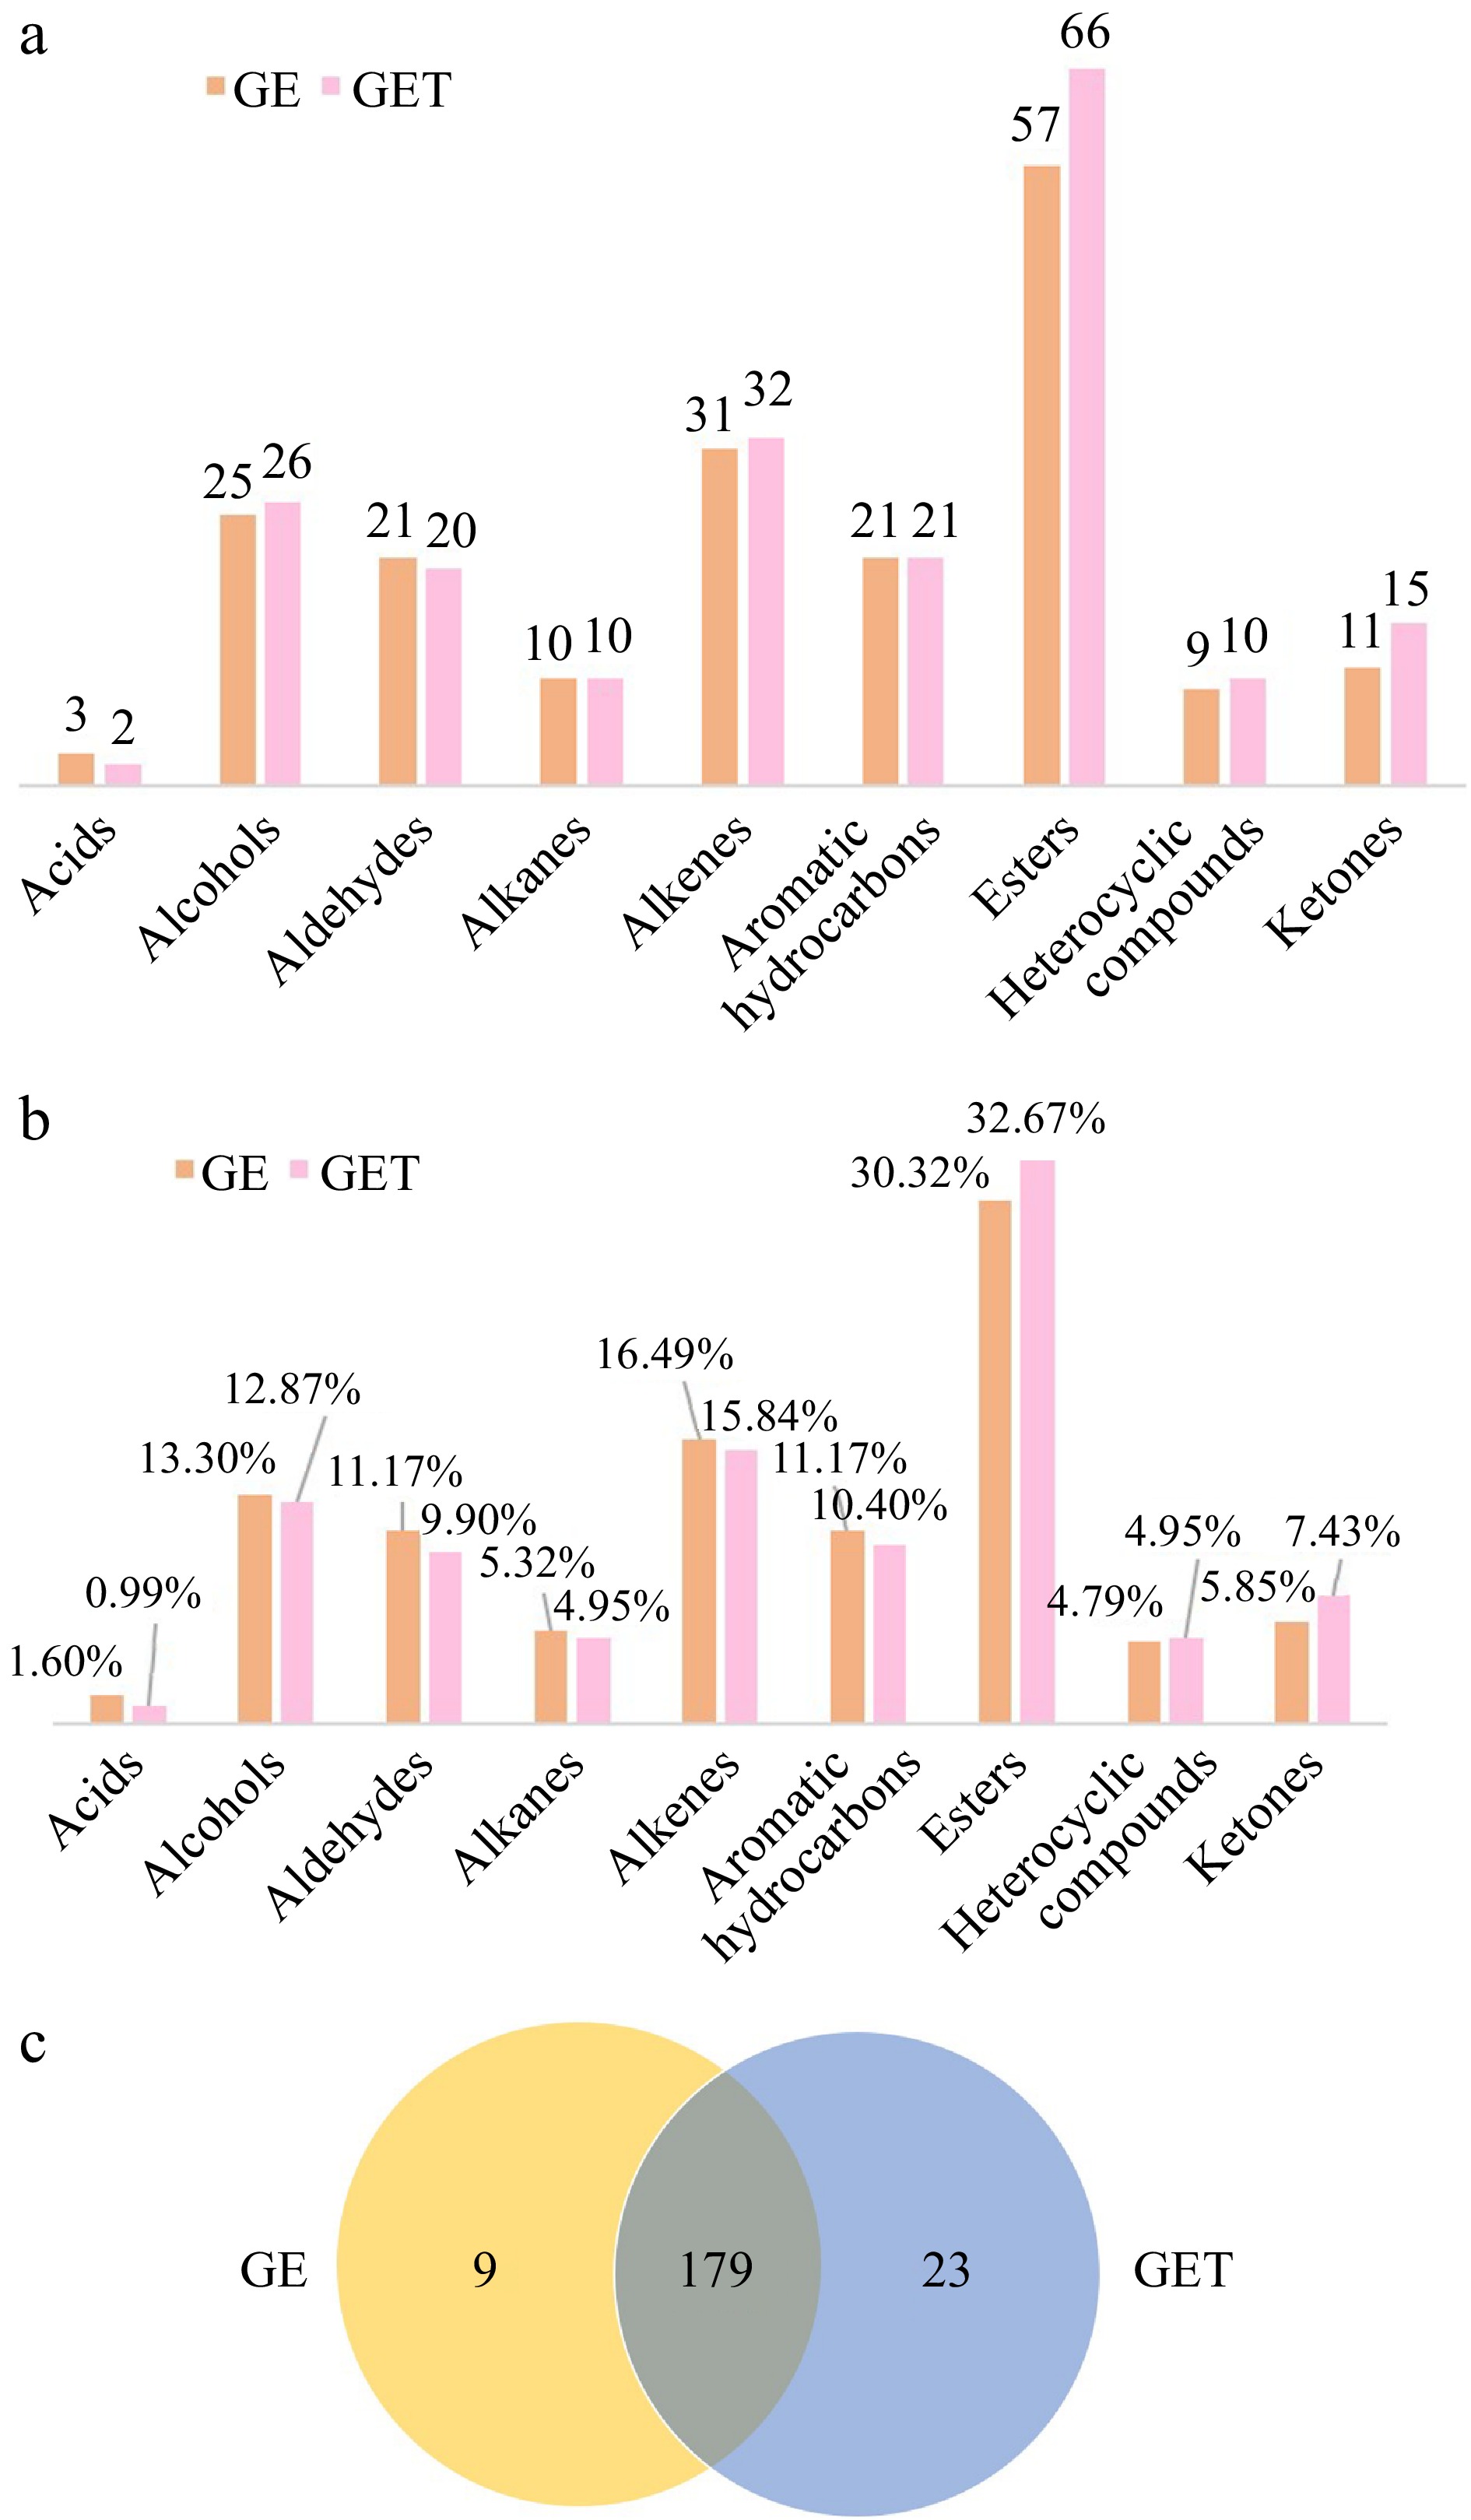
Figure 1.
Information of volatile compounds in GE and GET identified by GC × GC-TOFMS. (a) Specific number of volatile categories in GE and GET. (b) Proportion of volatile categories in GE and GET. (c) Venn diagram of volatile compounds in GE and GET.
Esters were the main volatile compounds, showing the highest contents in GE (13,138.64 μg/L) and GET (19,956.62 μg/L). Among them, hexyl tiglate was the most abundant compound in GE (3,422.36 μg/L) and GET (3,178.78 μg/L). Benzoic acid, methyl ester also presented a higher content in GE (3,195.76 μg/L) and GET (3,549.00 μg/L). Moreover, a total of 37 important esters showed significant differences (p < 0.05) in GE and GET. For example, octanoic acid, methyl ester, 5-hexyldihydro-2(3H)-furanone and decanoic acid, methyl ester presented higher contents in GE than those in GET, while methyl tiglate, ethyl tiglate, (Z)-3-hexen-1-ol, propanoate and (E)-butanoic acid, 3-hexenyl ester showed the opposite trend.
Alkenes were the second largest category after esters. As shown in Fig. 2, the content of alkenes in GE (7,690.78 μg/L) was significantly higher than that in GET (3,143.27 μg/L) (p < 0.05). Among them, the content of theaspiran in GE (2,542.11 μg/L) and GET (1,684.29 μg/L) was the highest. A majority of alkenes such as (E,E)-1,3,5-heptatrien, α-phellandrene, α-terpinene, α-myrcene, α-farnesene and cis-calamenene were found higher in GE than those in GET. On the contrary, some alkenes such as styrene and (E,Z)-2,6-dimethyl-2,4,6-octatriene showed higher contents in GET than in GE.
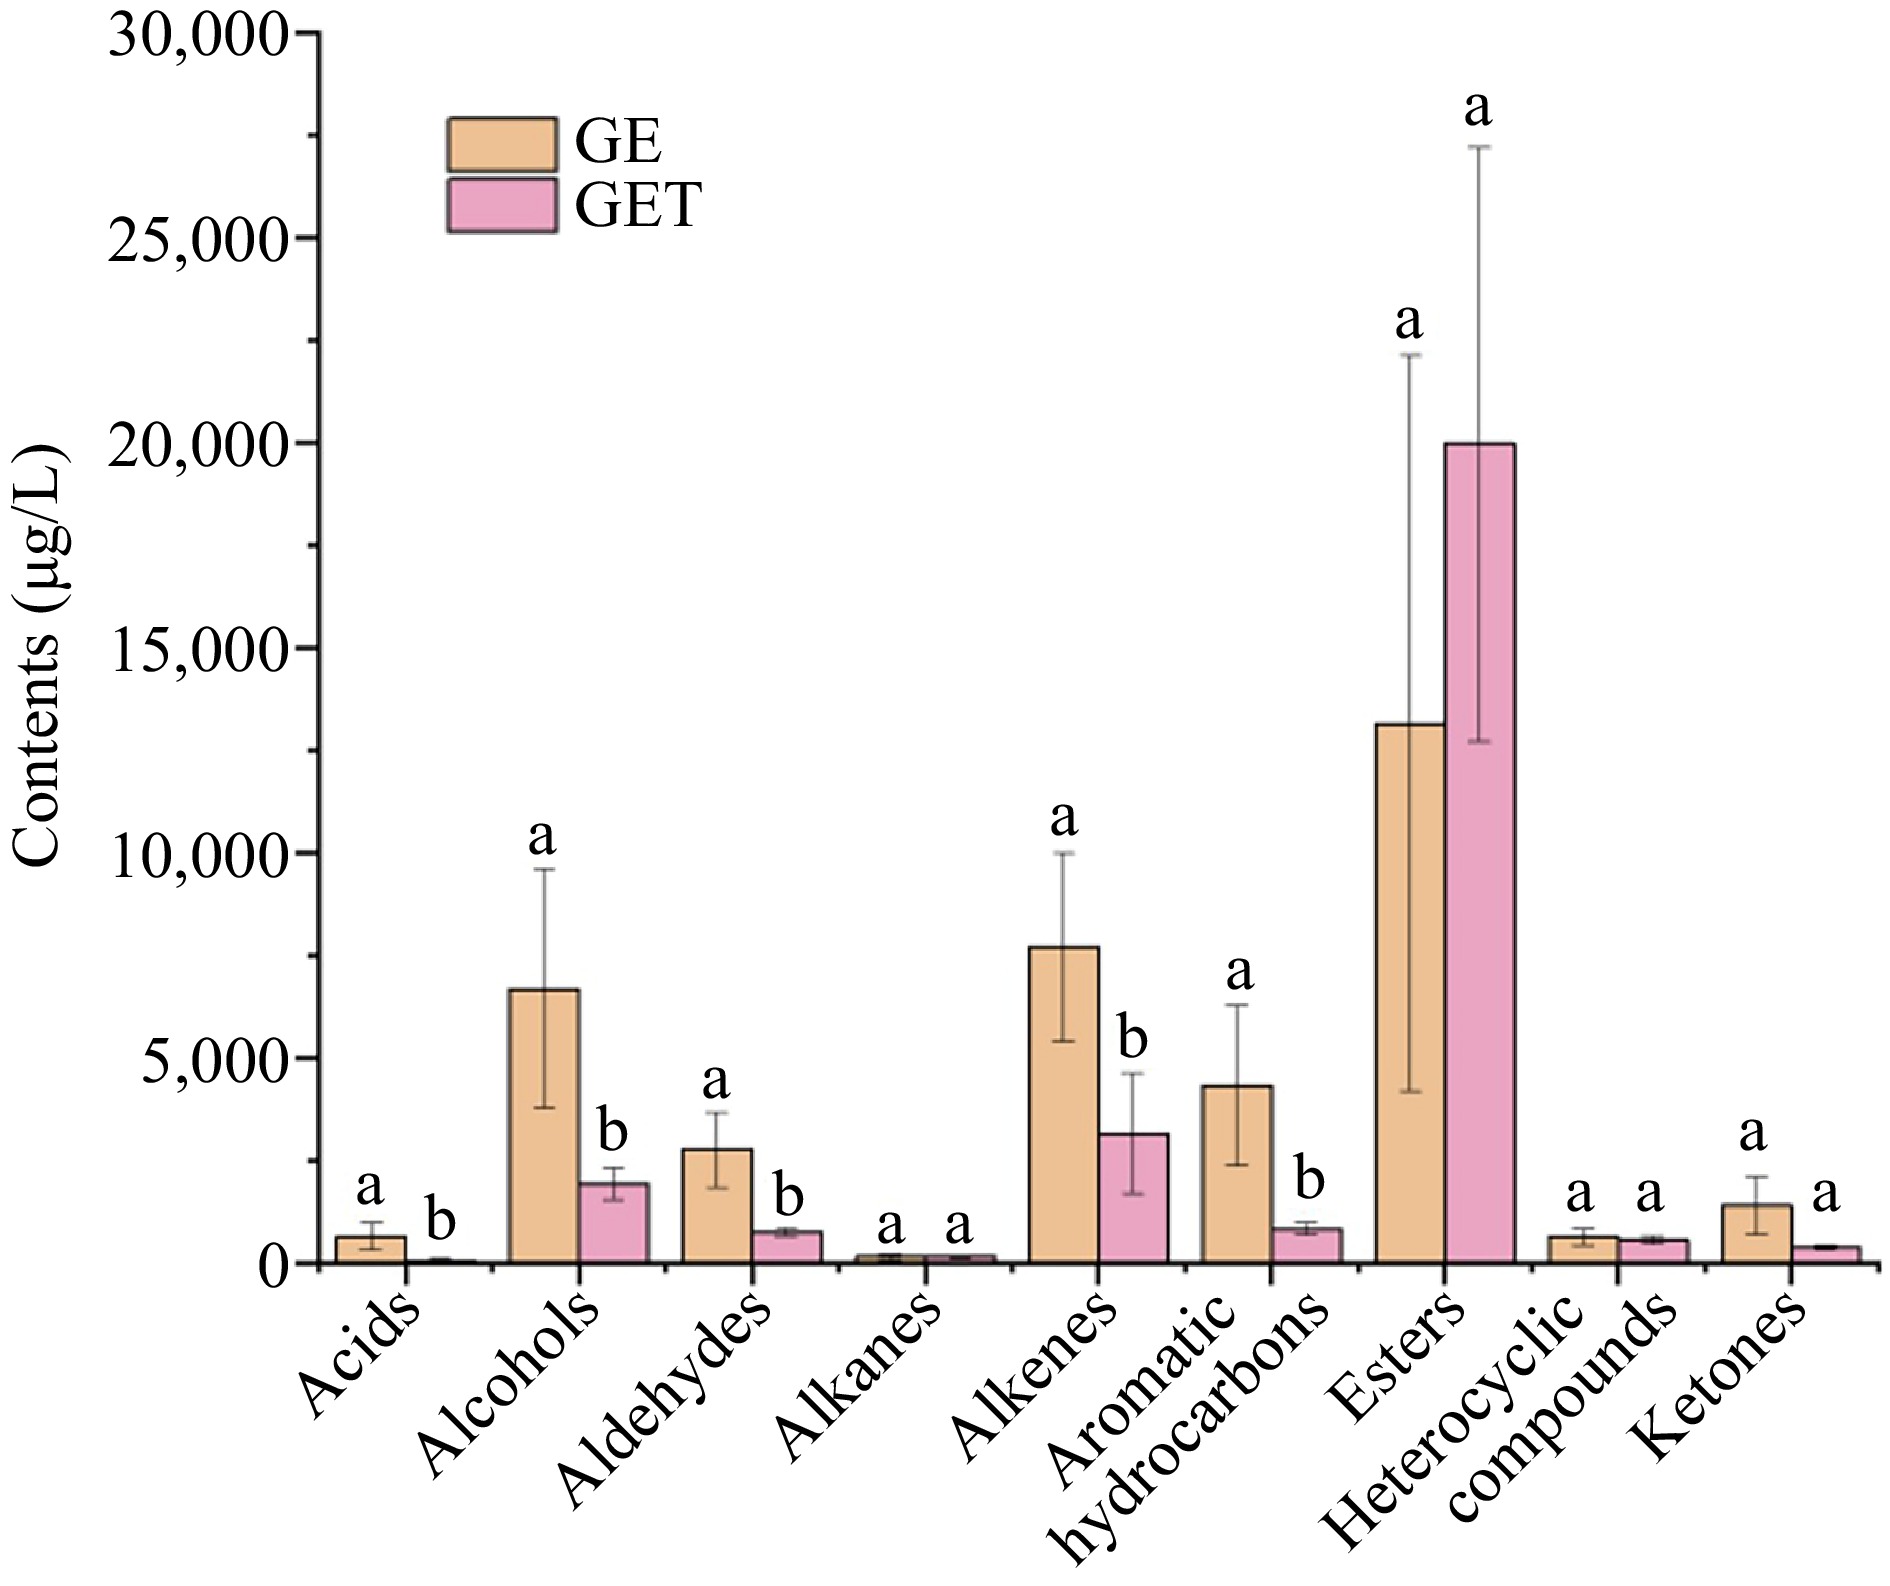
Figure 2.
Content comparisons of volatile categories in GE and GET. Different lowercase letters indicate significant difference at p < 0.05
Alcohols play an important contribution to the sweet, floral, and grass odors of tea[21,22]. In the study, the content of alcohols in GE (6,685.48 μg/L) was significantly higher than that in GET (1,918.66 μg/L) (p < 0.05). Among them, 3-hexen-1-ol, benzyl alcohol, and linalool were the dominant alcohols in GE and GET. Benzyl alcohol was reported as an important volatile component in black tea and oolong tea, with rose-like and fruity aromas[23]. As an important monoterpene alcohol[24], linalool was associated with citrus-like and floral aromas[25]. In addition, phenylethyl alcohol presented a higher content in GE (1,906.91 μg/L) than that in GET (126.05 μg/L), which was mainly derived from the hydrolysis reaction of β-glucoside or β-primrose glycoside[26].
Ketones are known as important volatile components in tea flavor. In this study, the content of ketones in GE and GET was 1,405.45 and 378.38 μg/L, respectively. Geranylacetone, with magnolia and green odors, was reported to be a vital odorant in black, green and oolong tea[27]. In this study, it was found that geranylacetone was the most abundant ketone in GE (1,162.16 μg/L) while (E,E)-3,5-octadien-2-one was the highest ketone in GET (90.74 μg/L).
Aldehydes play an important role in the aroma quality of GE and GET. The content of aldehydes in GE (2,758.81 μg/L) was significantly higher than that in GET (756.61 μg/L) (p < 0.05). Aldehydes such as 2-methyl-butanal, pentanal, hexanal, benzaldehyde and benzeneacetaldehyde were detected in both GE and GET. Pentanal and hexanal were reported as importance contributors to tea aroma, presenting grassy and green odors. They were formed mainly through lipid degradation[27]. Benzeneacetaldehyde showed a higher content in GE (611.44 μg/L) than GET (95.47 μg/L) (p < 0.05), which was mainly generated by the Maillard reaction[26]. In addition, 2-methyl-pentanal and α-cyclocitral were detected only in GET, while (E)-2-hexenal, (Z)-2-heptenal and (E,Z)-2, 6-nonadienal were detected only in GE.
Pyrazine, pyrrole, furan and their derivatives are important heterocyclic compounds, presenting roasted and caramel-like aromas[28]. In this study, the furans and corresponding derivatives were the main heterocyclic compounds, and their contents in GE and GET were 631.55 and 559.65 μg/L, respectively.
In addition, the content of aromatic hydrocarbons in GE (4,333.28 μg/L) was significantly higher than that in GET (829.70 μg/L) (p < 0.05). Some aromatic hydrocarbons such as butylated hydroxytoluene, naphthalene, o-cymene, p-xylene, and toluene presented high amounts in both GE and GET.
Multivariate statistical analysis
-
To characterize the differences between GE and GET, PLS-DA model was constructed. A data matrix of 211 (volatile compounds) × 6 (samples) was obtained. As shown in Fig. 3a, a clear discrimination between GE and GET was obtained. The parameters of the model (R2Y = 0.991, Q2 = 0.977) demonstrated its good explanatory and predictive ability. To verify the robustness of the model, 200 permutation tests were carried out. The result showed that R2 and Q2 were (0, 0.838) and (0, −0.295) respectively, indicating that the model was robust and there was no overfitting (Fig. 3b). To further assess the specific volatile components that explain the difference, the corresponding loading plot was performed (Fig. 3c). The distance between the individual variable and the main cluster is positively correlated with its effect on classification. It could be found that dihydro-5-pentyl-2(3H)-furanone (164), heptanal (171), and nonanoic acid, methyl ester (59) were closer to GE than GET. On the contrary, acetic acid, pentyl ester (34), hexanoic acid, ethyl ester (40), butanoic acid, 2-methylbutyl ester (44), ethyl tiglate (38), 4-methyl-3-penten-2-one (140), 2,2,6-trimethyl-cyclohexanone (144) and isophorone (145) were closer to GET than GE.
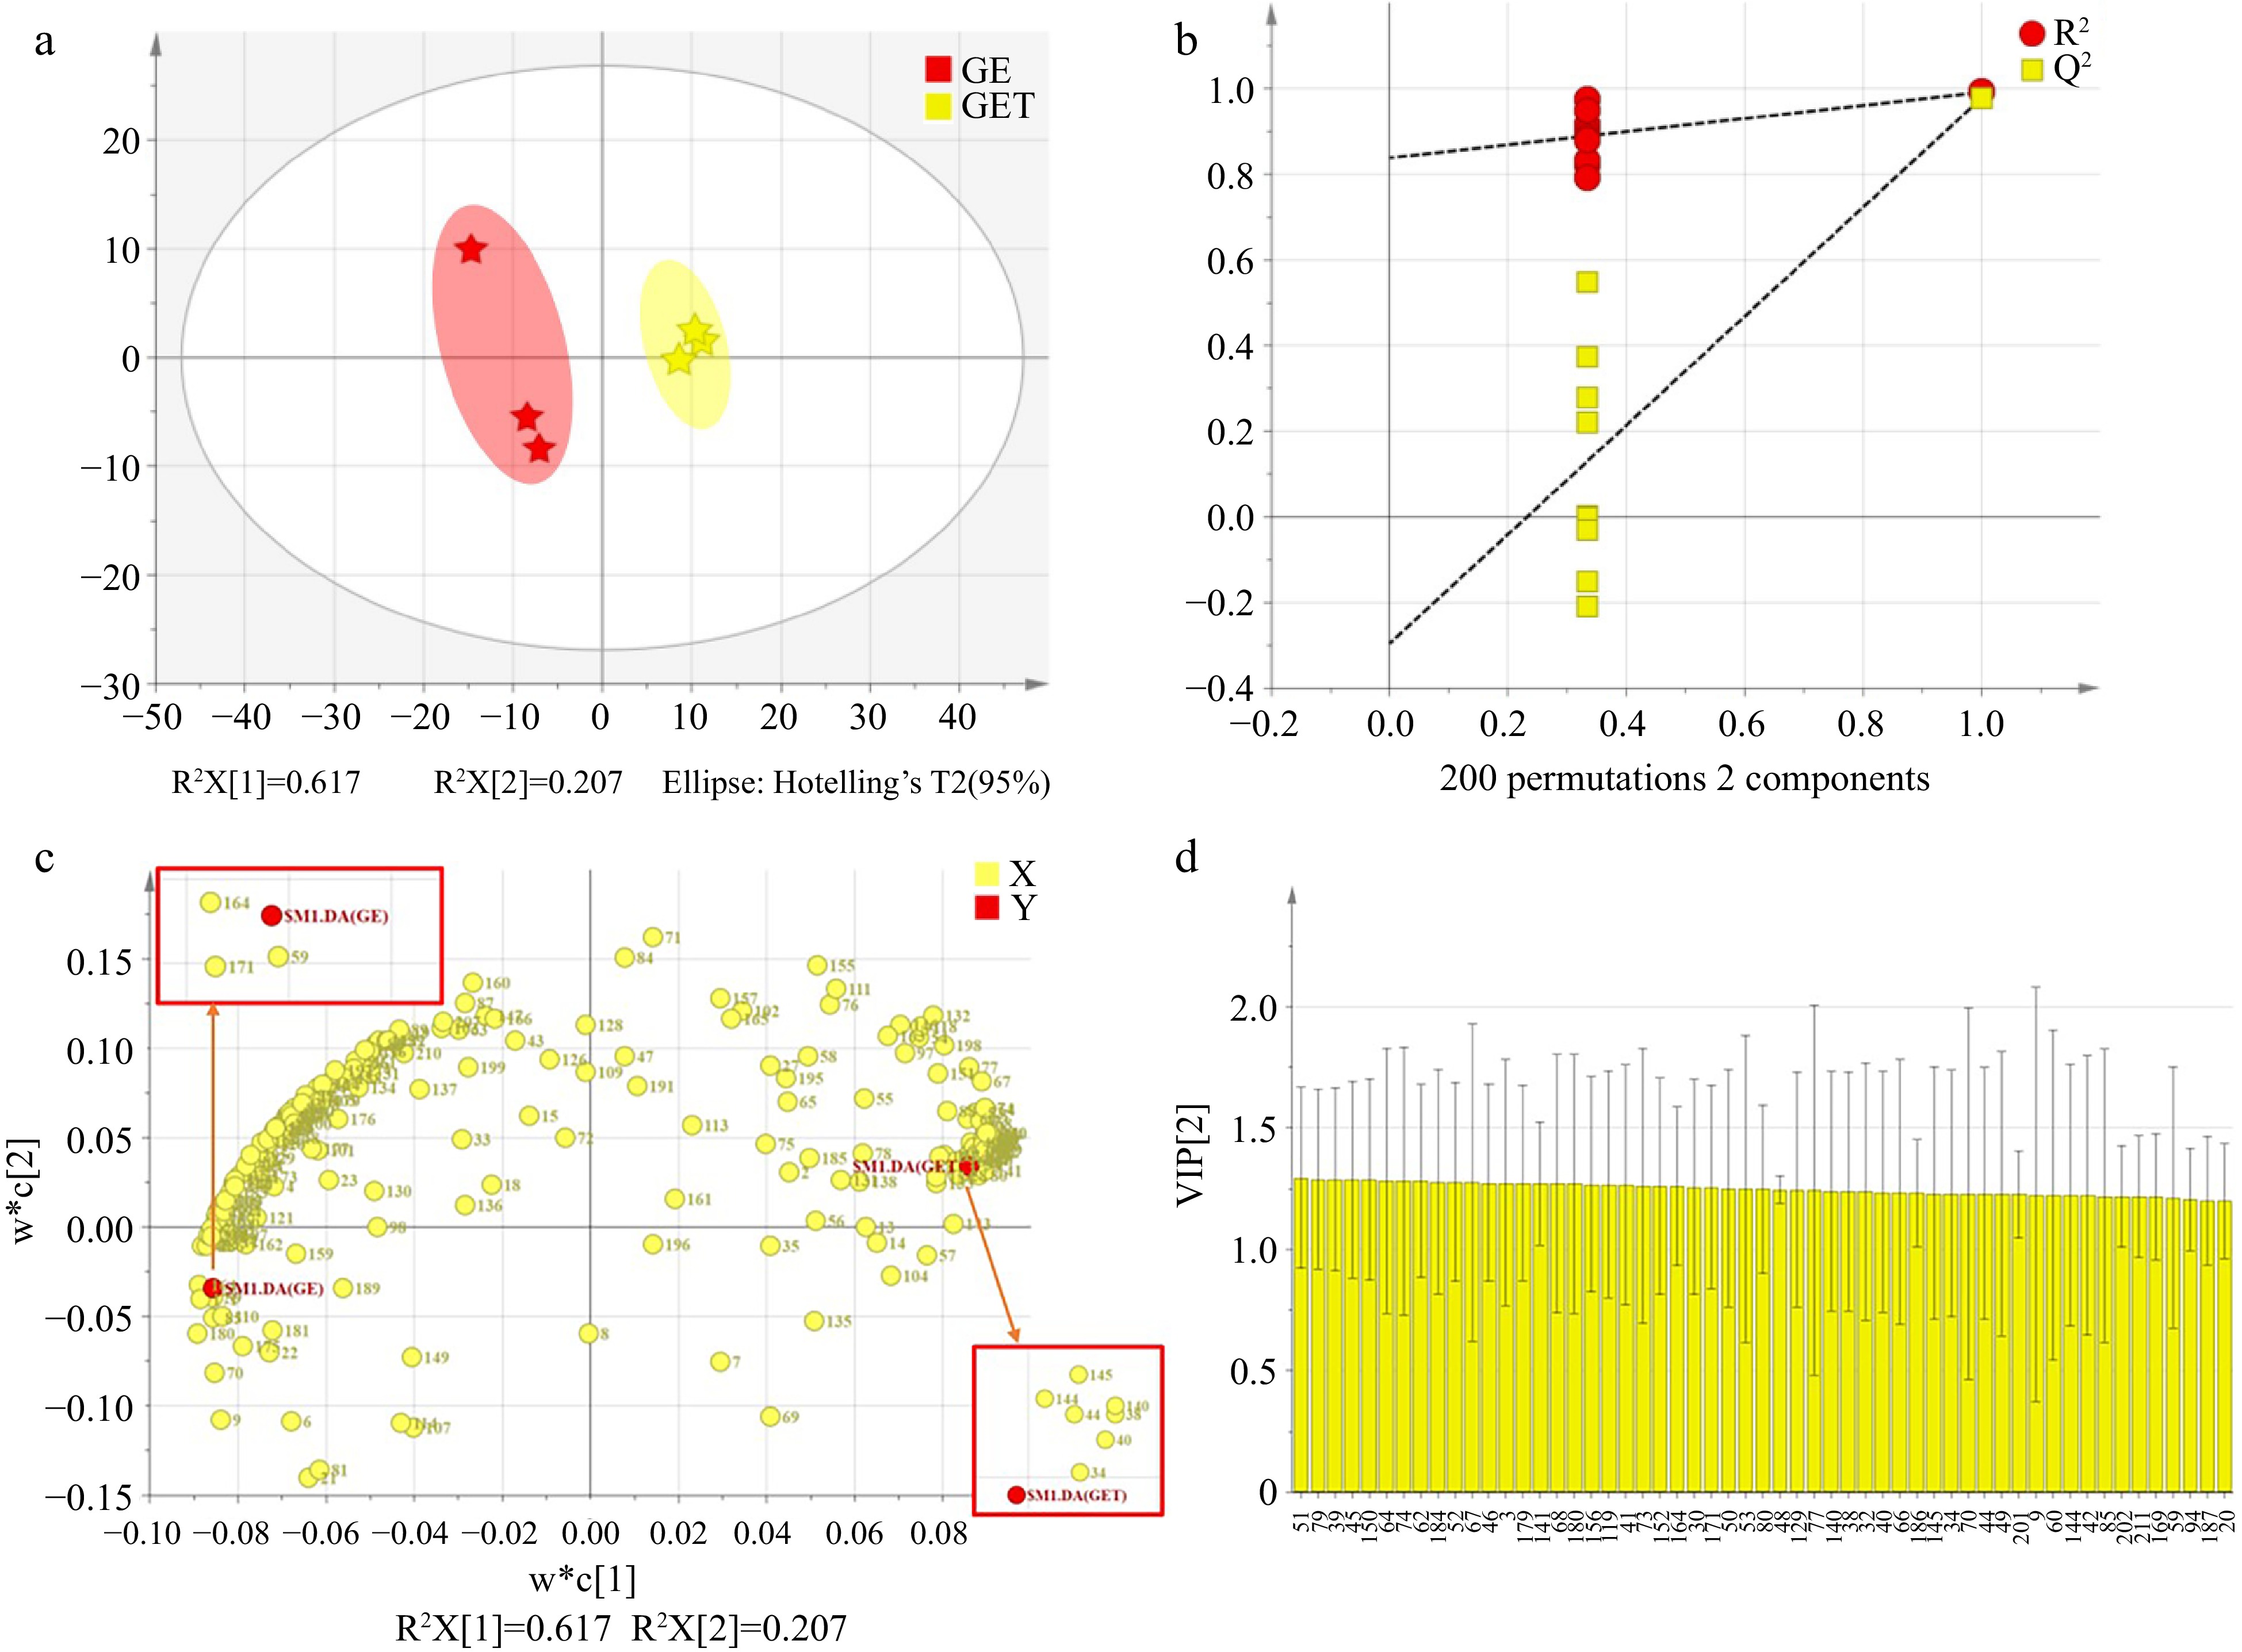
Figure 3.
PLS-DA results of GE and GET using GC × GC-TOFMS. (a) Score plot of PLS-DA (R2Y = 0.991, Q2 = 0.977). (b) Plot of 200 permutation test (R2Y = 0.838, Q2 = −0.295). (c) Loading plot. (d) Fifty five key variables with VIP > 1.2. The numbers of volatile components correspond to Supplemental Table S1.
In order to further understand the crucial volatile compounds to distinguish GE and GET, the variable importance in the projection (VIP) was investigated. In general, when the VIP value is greater than 1, it can be judged that the variable plays an important role in group classification. In this study, a total of 55 volatile components with VIP > 1.2 were screened out (Fig. 3d). To visualize the differences, heat map analysis was carried out. Notably, the red color of the square indicates a higher concentration, while the yellow color indicates a lower concentration. As shown in Fig. 4, some volatile compounds such as (Z)-2-penten-1-ol, methyl tiglate, hexanoic acid, ethyl ester, (Z)-3-hexen-1-ol, acetate, humulene, α-cyclocitral, β-cyclocitral, 2-heptanone, and α-ionone showed higher concentrations in GET than those in GE. In contrast, some typical compounds such as 1-heptanol, terpinen-4-ol, decanoic acid, methyl ester, hexanal, heptanal, citral, nonanoic acid showed higher concentrations in GE than those in GET.
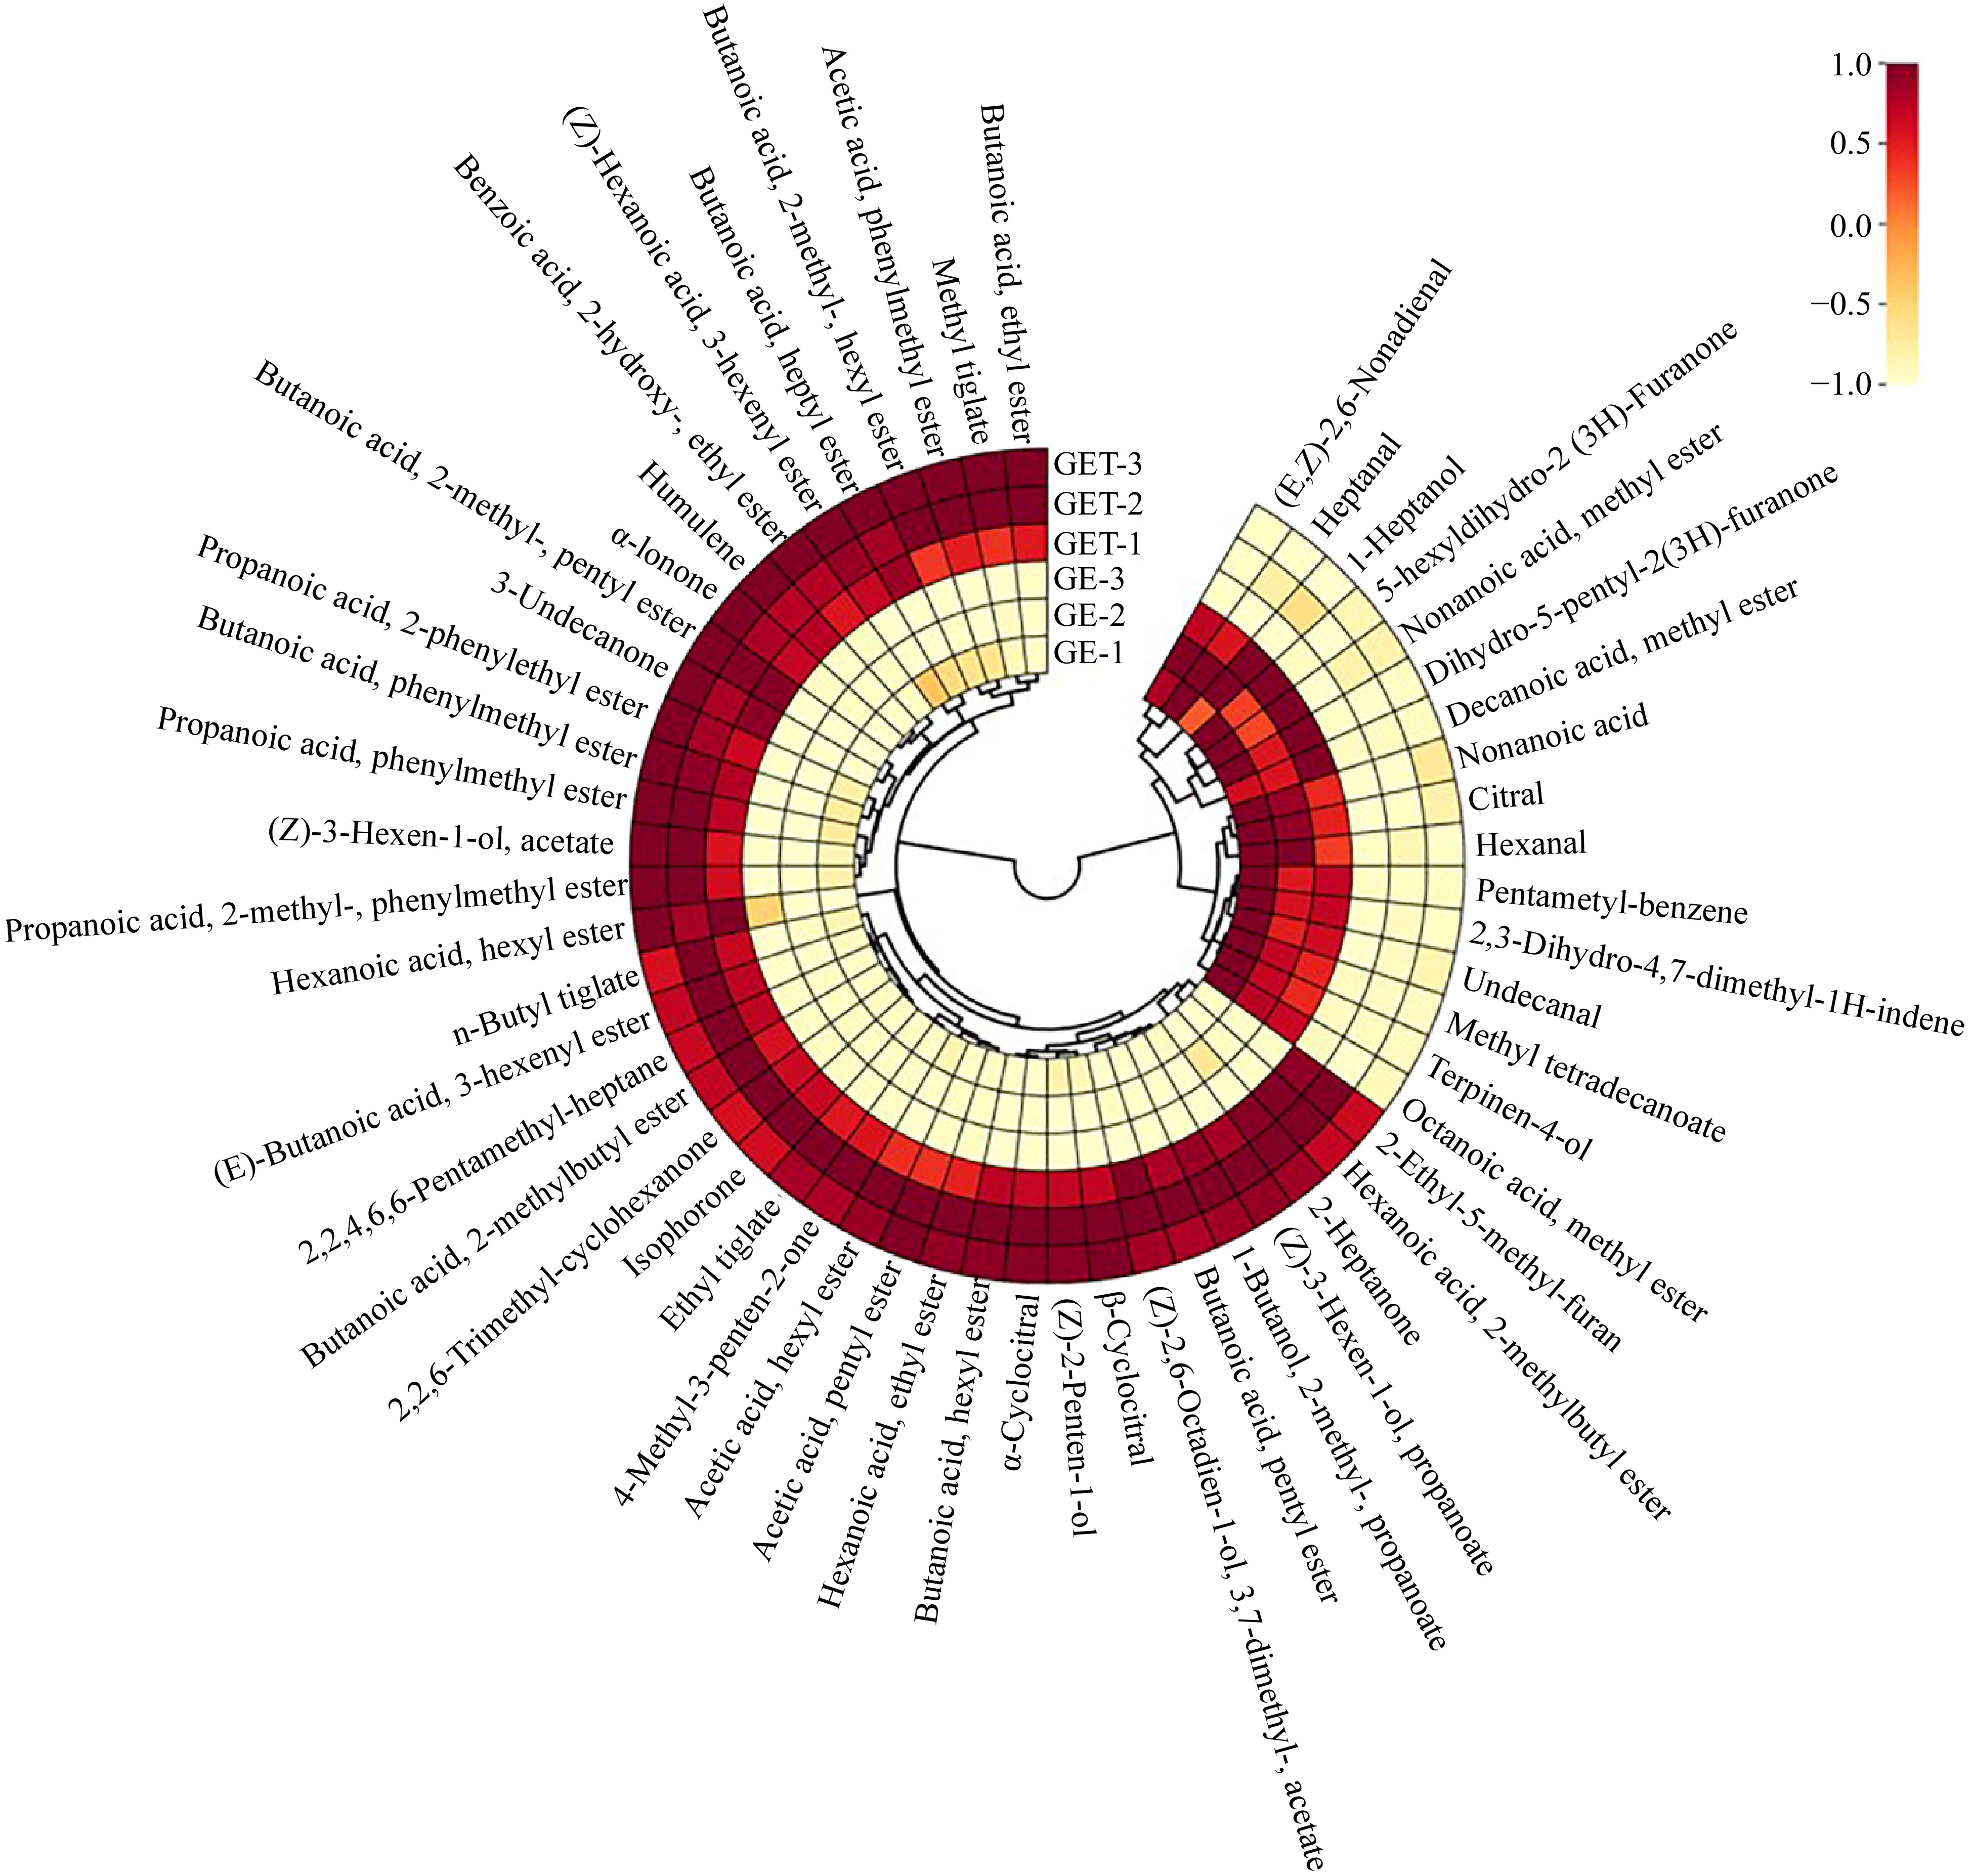
Figure 4.
Heatmap constructed with 55 key differential volatiles with VIP > 1.2 in GE and GET.
OAV analysis of volatile compounds in GE and GET
-
OAV was an important indicator to evaluate the contribution of volatile compounds to the overall aroma. In general, volatiles with OAV ≥ 1 are considered as important contributors responsible for the entire aroma profile. In this study, a total of 57 volatile components with OAV greater than 1 were screened in GE and GET, among which 37 common volatile compounds were found in both GE and GET (Supplemental Fig. S4 & Supplemental Table S2). Among them, propanoic acid, 2-methyl-, ethyl ester (No. = 28, OAV = 1102.36), methyl tiglate (No. = 32, OAV = 2.76), hexanoic acid, ethyl ester (No. = 40, OAV = 11.08), butanoic acid, 2-methylbutyl ester (No. = 44, OAV = 1.87), butanoic acid, hexyl ester (No. = 52, OAV = 2.34), 1-butanol, 3-methyl-, benzoate (No. = 84, OAV = 1.04,), styrene (No. = 97, OAV = 1.13), cis-jasmone (No. = 151, OAV = 2.89), 2-methyl-pentanal (No. = 167, OAV = 3.26), β-cyclocitral (No. = 184, OAV = 5.98) showed OAVs greater than 1 only in GET, while hexanoic acid, methyl ester (No. = 36, OAV = 1.12), α-terpinene (No. = 106, OAV = 4.46), terpinolene (No. = 108, OAV = 3.66), α-farnesene (No. = 122, OAV = 4.84), 6-methyl-5-hepten-2-one (No. = 142, OAV = 1.19), (E)-2-hexenal (No. = 170, OAV = 14.93), (Z)-2-heptenal (No. = 172, OAV = 2.63), (E, Z)-2,6-nonadienal (No. = 180, OAV = 13,325.75), p-xylene (No. = 190, OAV = 1.15), nonanoic acid (No. = 211, OAV = 3.86) showed OAVs greater than 1 only in GE. It is worth mentioning that linalool (No. = 15, OAVGE = 805.97, OAVGET = 712.35), phenylethyl alcohol (No. = 17, OAVGE = 5,448.33, OAVGET = 360.15), α-myrcene (No. = 103, OAVGE = 73.78, OAVGET = 50.80), (E,E)-3,5-octadien-2-one (No. = 146, OAVGE = 89.56, OAVGET = 181.49), benzeneacetaldehyde (No. = 175, OAVGE = 509.53, OAVGET = 79.56) showed higher OAV values in both samples, indicating that these substances may be the characteristic components of GE and GET.
Aroma wheel construction of GET
-
Through the evaluation by panelists, six odor attributes of GET were determined after discussion, which were 'fruity', 'green', 'floral', 'other', 'woody', and 'roasted', respectively. In order to explore which key volatile compounds contributed to the aroma profile of GET, GC-O-MS sniffing was conducted. A total of 41 volatile components, including 21 esters, nine alcohols, four aldehydes, four ketones, two alkenes and one heterocyclic compound, were selected as aroma-active components, and their aroma descriptions are described in Supplemental Table S3. Most odorants were recorded as fruity, floral, green, and sweet odors, with an aroma intensity (AI) between 1.0 and 4.0. Notably, linalool and cis-jasmonone have AI values as high as 4.0, indicating that they were the most important contributors to the aroma profile of GET.
To further identify the key odorants that contributed significantly to GET aroma characteristics, 24 key odorants were screened based on GC-O-MS sniffing and OAV ≥ 1 (as listed in Table 1). And aroma wheel was constructed to visualize their contributions to GET. As shown in Fig. 5, 24 volatile compounds were mainly divided into six odor attributes by combining with the results of sensory evaluation.
Table 1. A total of 24 key odorants in GET based on OAV ≥ 1 and GC-O-MS results.
Compounds RT (min)a Aroma descriptionsb Aroma intensitiesc Aroma attributesd Propanoic acid, 2-methyl-, ethyl ester 8.58 Fruity, banana-like 3.2 Fruity Butanoic acid, 2-methyl-, methyl ester 9.96 Fruity, apple, green pear 2.0 Fruity Hexanoic acid, ethyl ester 19.25 Fruity, sweet 2.2 Fruity Butanoic acid, hexyl ester 27.79 Green, fruity 3.0 Fruity (E,E)-3,5-Octadien-2-one 34.20 Fruity, green grassy 2.0 Fruity Benzoic acid, methyl ester 36.51 Fruity 3.0 Fruity Benzyl alcohol 45.31 Fruity, rose-like 3.0 Fruity Nerolidol 50.96 Fresh, floral, fruity 2.0 Fruity Pentanal 9.08 Fermented bready 1.7 Green Acetic acid, hexyl ester 21.11 Fruity, green 3.0 Green (Z)-3-Hexen-1-ol, acetate 23.22 Green, sweet, fruity 2.0 Green 3-Hexen-1-ol 26.13 Green, leafy, grassy 2.2 Green Geranylacetone 44.74 Magnolia, green 3.2 Green Linalool 33.08 Citrus, floral, sweet 4.0 Floral α-Ionone 44.70 Floral, violet 2.0 Floral Phenylethyl alcohol 47.05 Rose, honey 3.2 Floral cis-Jasmone 47.88 Jasmine-like, herbal, floral, woody 4.0 Floral Indole 59.77 Floral, animal-like 2.0 Floral Methyl tiglate 17.88 Ethereal 3.2 Other 1-Octanol 34.17 Matallic 2.3 Other Methyl salicylate 42.33 Mint-like 3.2 Other 2-Methyl-butanal 9.00 Musty, chocolate, nutty 2.5 Roasted Benzaldehyde 32.33 Bitter, almond-like 2.3 Roasted Safranal 37.36 Woody, spicy, phenolic 2.2 Woody a RT: The retention time of compounds identified by GC-O-MS. b Aroma descriptions obtained from GC-O-MS. c Aroma intensity perceived by panelists. d Aroma attributes referred to the results of sensory evaluation. 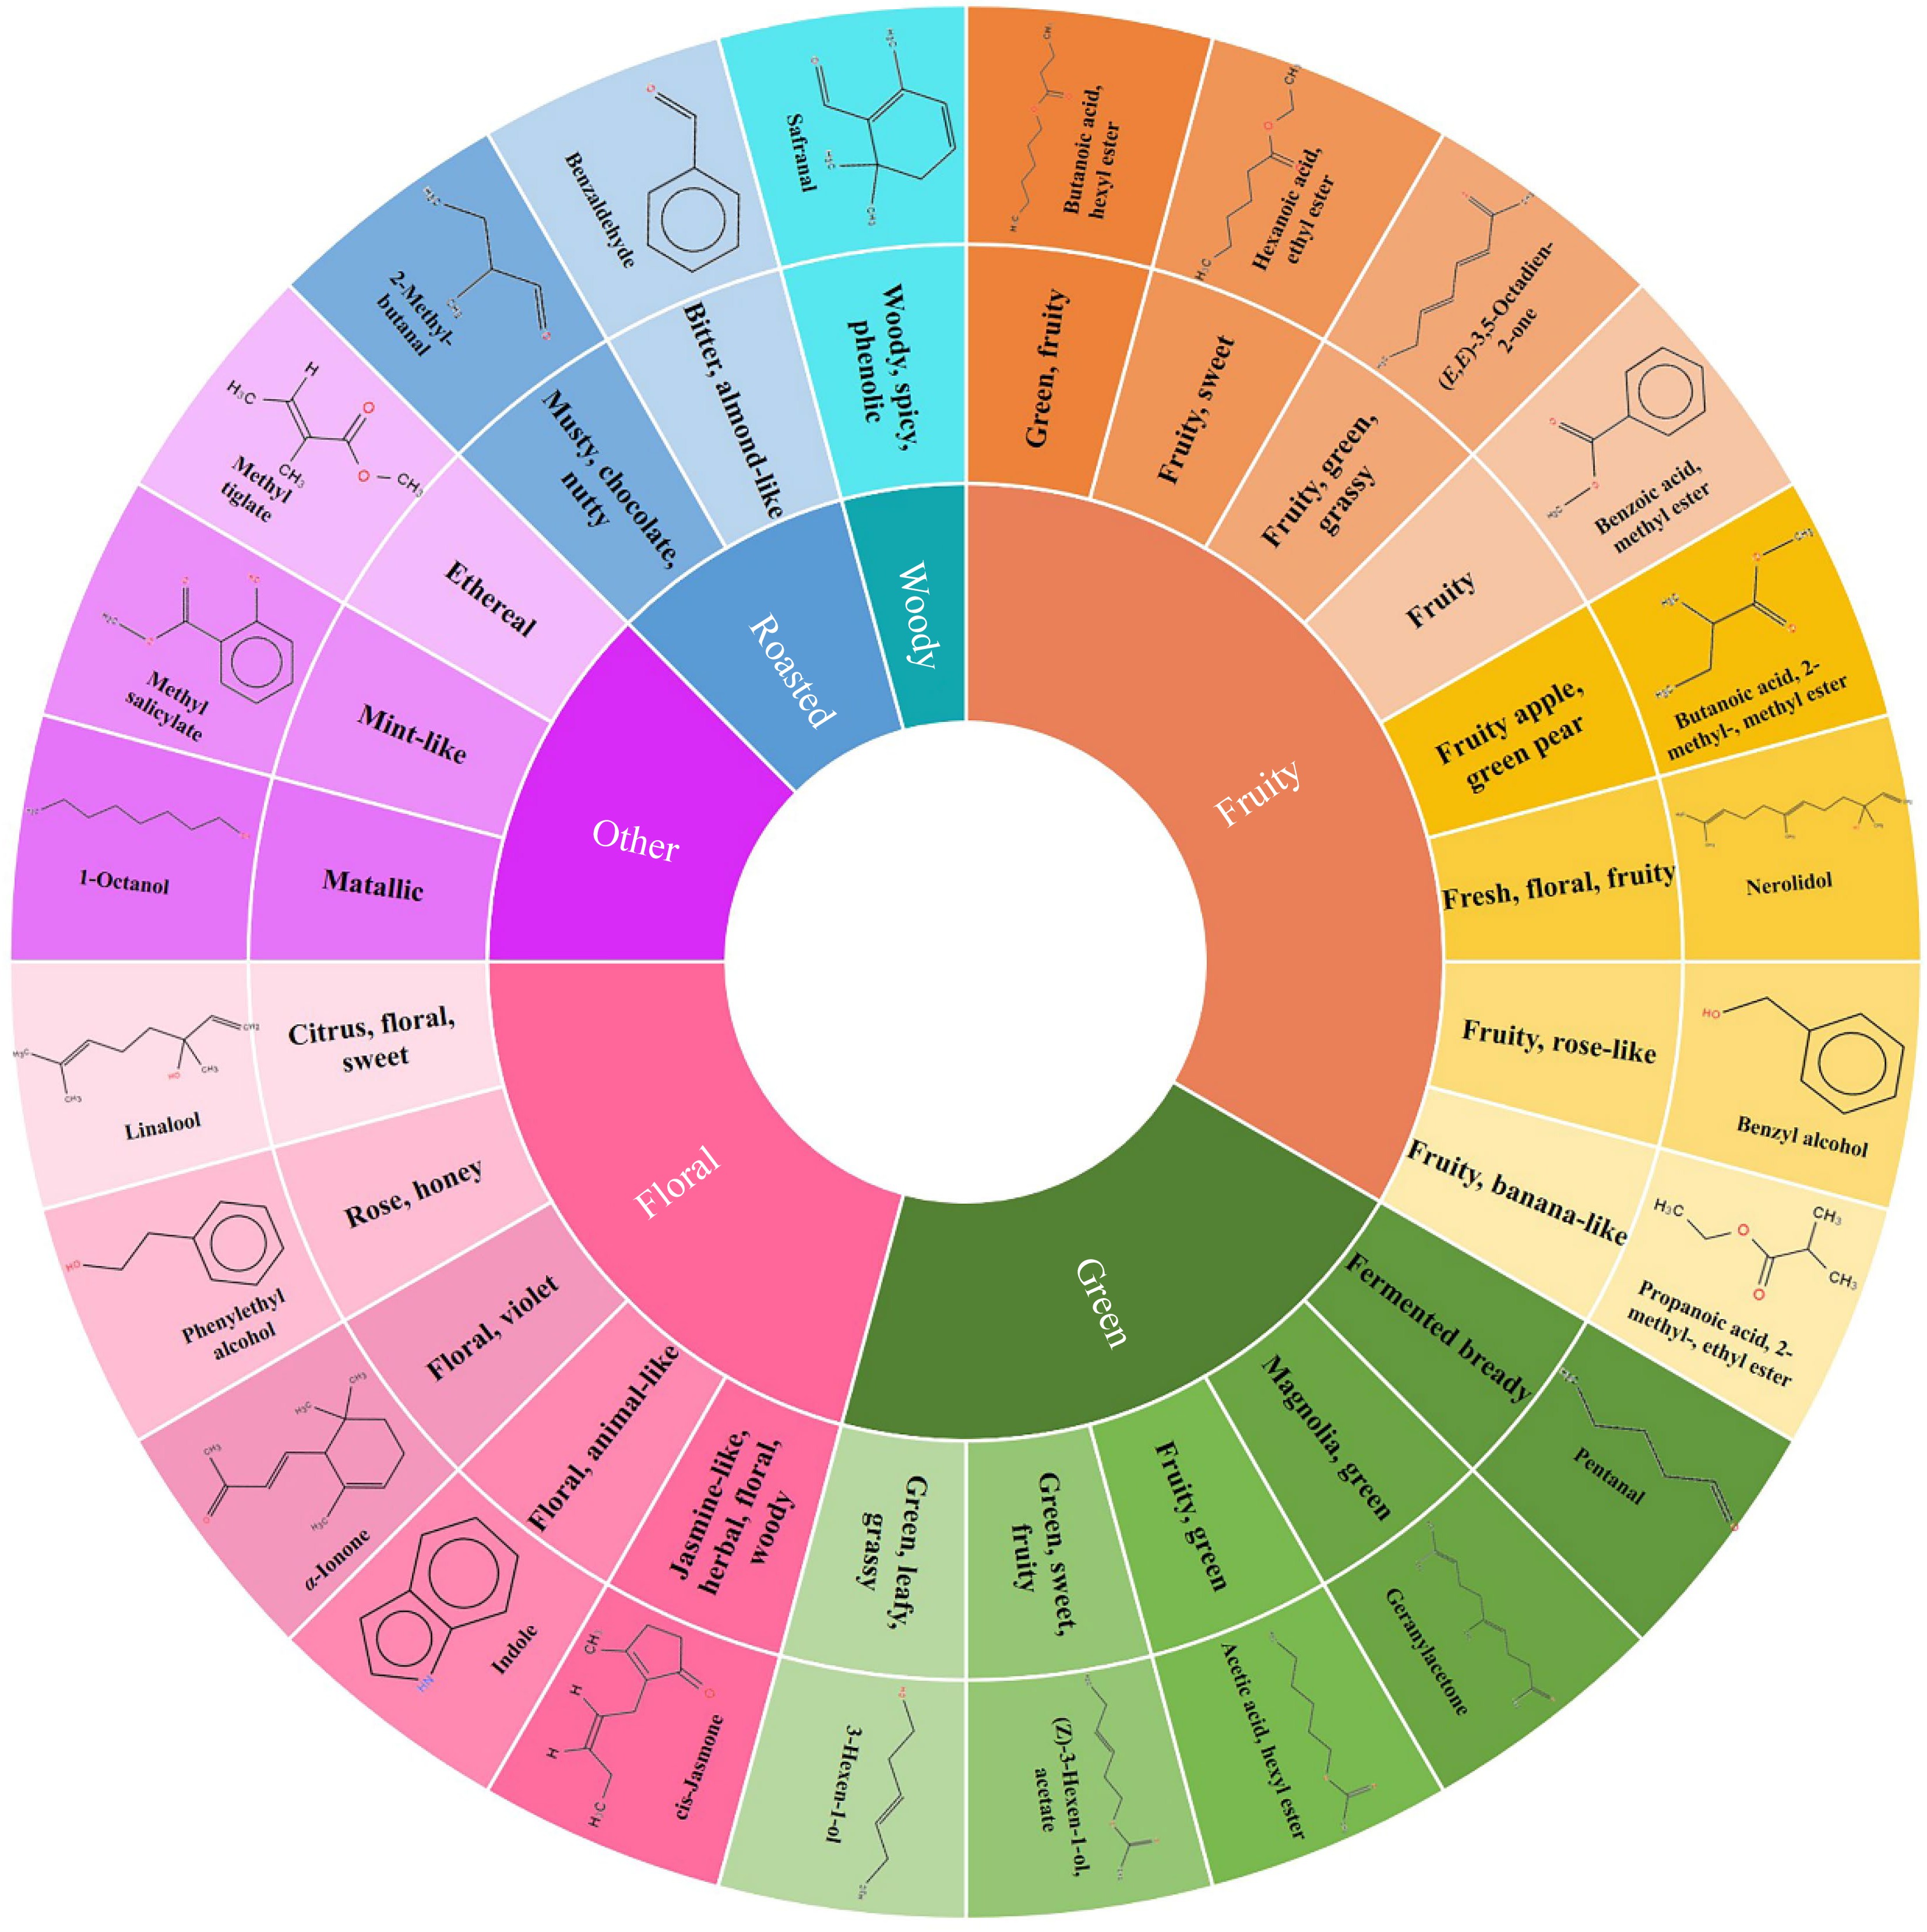
Figure 5.
Aroma wheel constructed with 24 key odorants in GET.
The 'fruity' attribute of the aroma wheel was composed of eight volatile compounds, including two alcohols, five esters, and one ketone. Among them, esters such as benzoic acid, methyl ester, hexanoic acid, ethyl ester, propanoic acid, 2-methyl-, ethyl ester, butanoic acid, 2-methyl-, methyl ester and butanoic acid, hexyl ester were important contributors to the 'fruity' attribute. For alcohols, benzyl alcohol (fruity and rose-like aroma) and nerolidol (fruity, fresh and floral aroma) were reported to be important odorants for the fruity and floral aroma of black tea[29]. (E,E)-3,5-Octadien-2-one with a low threshold in water (0.5 μg/L), was also a significant contributor to the 'fruity' attribute.
The 'green' attribute of the aroma wheel mainly included one aldehyde (pentanal), one ketone (geranylacetone), one alcohol (3-hexen-1-ol) and two esters (acetic acid, hexyl ester and (Z)-3-hexen-1-ol, acetate) with carbon atomic number of 5 to 12, presenting green and grassy aromas. Among them, pentanal was the main contributor to the green and grassy flavor in tea[30]. As an important alcohol, 3-hexen-1-ol had an important contribution to the green odor of tea infusion. These compounds were mainly derived from the oxidative degradation of unsaturated fatty acids such as linoleic acid and linolenic acid[31].
Five volatile compounds including linalool, phenylethyl alcohol, α-ionone, indole and cis-jasmone were important volatile components responsible for the 'floral' attribute in aroma wheel. As a crucial odorant, linalool was widely distributed in a variety of plants, with citrus-like, floral and sweet aromas[32]. α-Ionone with violet-like aroma was reported to play an importance role in corn-like aroma of green tea[33]. Phenylethyl alcohol with floral and rose aromas, was mainly derived from phenylalanine degradation[31]. It is worth noting that linalool and cis-jasmone had strong aroma intensity and long duration during the sniffing process.
Benzaldehyde and 2-methyl-butanal were the main contributors to the 'roasted' attribute. Benzaldehyde was considered to present an almond-like aroma. 2-Methyl-butanal presenting a nutty aroma, was reported to play an important role in Darjeeling black tea[25].
As an important aroma attribute of GET, the 'woody' attribute was composed of safranal, which was mainly derived from the degradation of carotenoids. The 'other' attribute was mainly composed of methyl salicylate (mint-like), 1-octanol (metallic), and methyl tiglate (ethereal). Among them, methyl salicylate was reported to be an important volatile compound for the unique floral aroma in 'Oriental Beauty' oolong tea[34].
-
In this study, the volatile profiles of GET were analyzed by GC-E-Nose, GC-O-MS and GC × GC-TOFMS combined with multivariate statistical analysis, with GE as the contrast. A total of 211 volatile compounds including 179 common components were identified in GE and GET. Esters, alkenes and alcohols were the main volatile categories in both samples. In addition, 55 volatile compounds with VIP > 1.2 were selected as the key differential variable that caused the differences between GE and GET. Moreover, 47 volatile compounds were screened out in GET with OAV greater than 1. Besides, 41 aroma-active components were identified in GET through GC-O-MS. By combining the OAV and GC-O-MS results, 24 key odorants were constructed to characterize GET aroma wheel, including six main aroma attributes: 'fruity', 'green', 'floral', 'other', 'woody', and 'roasted'. In short, GC-E-Nose, GC-O-MS, and GC × GC-TOFMS combined with chemometric successfully characterized the aroma profile of GET. The results not only enrich the flavor theory of GET, but also provide a good reference for the characterization of aroma wheels of other scented teas. In the future, the synergistic mechanism among the key odorants will be studied in depth, and the interaction relationship network will be constructed to provide theoretical support for the quality control of scented tea.
-
The authors confirm contribution to the paper as follows: study conception and design: Xie J, Yang Y; data collection: Xie J, Wang Q, Cui H, Deng Y; analysis and interpretation of results: Xie J, Wang Q, Wang L, Yuan H, Zhu J, Yang Y; draft manuscript preparation: Xie J, Yang Y, Jiang Y. All authors reviewed the results and approved the final version of the manuscript.
-
All data generated or analyzed during this study are included in this published article and its supplementary information files.
This work was supported by the Science and Technology Innovation Project of the Chinese Academy of Agricultural Sciences (CAAS-ASTIP-TRICAAS).
-
The authors declare that they have no conflict of interest.
- Supplemental Table S1 The information of volatile compounds in GE and GET.
- Supplemental Table S2 The OAVs of volatile compounds in GE and GET.
- Supplemental Table S3 Aroma-active compounds in GET characterized by GC-O-MS.
- Supplemental Fig. S1 The radar plots of GE and GET analyzed by GC-E-Nose.
- Supplemental Fig. S2 The score plots of PCA.
- Supplemental Fig. S3 The total ion chromatograms of GE and GET obtained from GC × GC-TOFMS.
- Supplemental Fig. S4 The Venn diagram of volatile components in GE and GET with OAV > 1.
- Copyright: © 2024 by the author(s). Published by Maximum Academic Press, Fayetteville, GA. This article is an open access article distributed under Creative Commons Attribution License (CC BY 4.0), visit https://creativecommons.org/licenses/by/4.0/.
-
About this article
Cite this article
Xie J, Wang Q, Cui H, Wang L, Deng Y, et al. 2024. Characterization of Gardenia tea based on aroma profiles using GC-E-Nose, GC-O-MS and GC × GC-TOFMS combined with chemometrics. Beverage Plant Research 4: e001 doi: 10.48130/bpr-0023-0034 

Characterization of Gardenia tea based on aroma profiles using GC-E-Nose, GC-O-MS and GC × GC-TOFMS combined with chemometrics
- Received: 23 August 2023
- Revised: 10 October 2023
- Accepted: 24 October 2023
- Published online: 02 January 2024
Abstract: Gardenia tea (GET) is one of the typical representatives of Chinese scented tea and is loved by consumers for its pleasant aroma. In the present study, the volatile profiles of GET were characterized by gas chromatography electronic nose (GC-E-Nose), comprehensive two-dimensional gas chromatography-time-of-flight mass spectrometry (GC × GC-TOFMS) and gas chromatography-olfactory-mass spectrometry (GC-O-MS) combined with chemometrics. Satisfactory discrimination was obtained by GC-E-Nose combined with principal component analysis, with the cumulative contribution rate reaching 86.74%. A total of 202 volatile compounds were identified in GET by GC × GC-TOFMS, among which esters, alkenes and alcohols were the dominant volatile components. Moreover, 24 key odorants were screened out from GET based on odor activity value ≥ 1 and GC-O-MS results. The aroma wheel of GET with six attributes of 'fruity', 'green', 'floral', 'other', 'woody', and 'roasted' was constructed to visualize the contributions of those key volatile compounds. The results provide a new strategy to elucidate the volatile profiles and aroma wheel of scented tea.
-
Key words:
- GC-E-Nose /
- GC × GC-TOFMS /
- GC-O-MS /
- Gardenia tea /
- Aroma wheel