


-
Coffee (Coffea arabica) considered an important tropical crop, is one of the most traded agricultural products in the world. Under suboptimal growing conditions, shade trees, which could reduce the stress on coffee by ameliorating adverse climatic conditions, have been recommended[1,2]. Yunnan province, located in Southwest China, is the most suitable region for coffee production in China[3]. Although the mountainous landscape and mild climate in this region are well-suited to coffee production, many areas are suboptimal for coffee cultivation[3,4]. Thus, agroforestry systems have been recommended for these areas, especially at altitudes below 1,000 m[4].
Since leaves are specialized organs that are responsible for interception of light and uptake of CO2 through the stomata for photosynthesis[5], light and CO2 availability in the mesophyll of plant leaves largely determin the net carbon assimilation rate (A) of leaves[1]. To analyze the response of photosynthesis to irradiance, the light response curves (LRCs) were used to describe the relationship between photosynthesis and light intensity[6]. It is an important method to elucidate the response mechanism of photosynthesis and evaluate photosynthetic efficiency by fitting of light-response model[5]. Often, LRCs are mathematically described using empirical models. The light response curves (LRCs) can be used to derive key photosynthetic parameters including the maximum net photosynthetic capacity (Pmax), initial and apparent quantum yields (IQY and AQY), light compensation point (LCP) and light saturation point (LSP), as well as the dark respiration rate (RD). Furthermore, the mechanistic Farquhar-von Caemmerer-Berry (FvCB) biochemical model, described by Farquhar et al.[7], has been widely used by numerous researchers to estimate key biochemical parameters of carbon assimilation through fitting A/Ci curves[7−9]. This model has been widely used to simulate CO2 assimilation and applied for decades[7,10]. It clearly explains the physiological properties of photosynthesis of intact leaves[5], and the parameters reflecting the biochemical properties of leaves as being easier to estimate from this model with gas exchange measurements[8].
The structural organization of plant leaves can either facilitate or constrain the photochemical reactions underlying photosynthesis[11,12]. Therefore, the leaf structural changes may affect photosynthetic efficiency[6,13]. However, although a variety of ecological studies have revealed a correlation between leaf structural parameters and photosynthetic performance[14−16], there were contradictory differences between foliage structural and functional variables in the previous work[17]. Therefore, in order to understand the effect of leaf structure on each of the photosynthetic performance parameters, it is necessary to analyze the relationship between leaf structure and leaf photosynthesis and to comprehensively evaluate the importance of each component in leaf photosynthesis. Furthermore, evaluation of the relationship between leaf structure and leaf photosynthesis could provide ecophysiological evidence for understanding the structural properties of leaves and how they affect photosynthetic performance. Even though a number of studies analyze the effects of leaf structure on photosynthetic performance[11,14], there has been limited synthetic analysis of the correlations between leaf structural parameters and photosynthetic performance[12]. In particular, few studies have been conducted on coffee. Therefore, this study aimed to explore the relationship between leaf structural parameters and photosynthetic performance, and to clarify the importance of these correlations through a comprehensive evaluation. Obtaining these results may provide useful information for future coffee breeding and plantation management.
-
The experiment was conducted in a shade coffee plantation of the Dehong Tropical Agriculture Research Institute of Yunnan (DTARI), Ruili, southwest China.
The study was conducted from 2019 to 2021. The experimental site was situated at latitude 24.025 south and longitude 97.855 west at an altitude of 890 meters above sea level with an average temperature of 22.2 °C and precipitation of 1,260 mm. The soil type in the plantation is acidic lateritic red soil.
The cultivars used for this study was ‘Catimor’ which is an interspecies hybrid derived from the cross between Caturra (C. arabica L.) and Timor (C. arabica × C. canephora Pierre ex Froehner). The coffee trees were approximately five years old and spaced 1 m × 2 m. Shade trees (Dimocarpus longan Lour.) were planted in East to West row orientation at 12 m × 4 m dimension.
Fourteen plants with consistent growth were selected in the coffee plantation. Three leaves were taken from 14 cohort plants in different directions for measurement of leaf gas exchange parameters. Measurements were taken from the third or fourth completely expanded leaf pair at the apex of the plagiotropic (lateral) branches, located in the upper third of the plant.
Gas exchange measurements
-
The leaf gas exchange parameters (net CO2 assimilation rate (A), stomatal conductance to water vapor (gs), transpiration rate (E), internal CO2 concentration (Ci), vapor pressure deficit (VPD), and leaf water use efficiency (WUE = A·E−1) and environmental indicators (leaf temperature (TL), relative humidity (RH) and ambient temperature (TA)) were determined simultaneously by using a portable photosynthesis system CIRAS 3 (PP Systems, USA). Leaf water use efficiency (WUE), representing the units assimilated for CO2 per unit of water lost through transpiration, was determined via the user manual version 1.06. All measurements were taken on sunny days from 09:00 to 11:30 and 15:00 to 18:00. The referenced CO2 concentration was set at 390 ppm using a buffer bottle, the temperature at 27 °C, flow rate at 300 µmol·s−1, relative humidity at 50% ± 10%, and irradiance at 800 µmol·m−2·s−1. The leaf photosynthetic (LRCs) and internal CO2 response (A/Ci) curves were constructed by using leaf gas exchange measurement. To collect data for building LRCs, net photosynthesis was measured at 0, 50, 100, 150, 200, 250, 300, 350, 400, 500, 600, 700, 800, 1,000, and 1,200 µmol·m−2·s−1 (PAR) with a cuvette environment that maintained leaf temperature at 27 °C, reference CO2 concentration at 400 ppm. The gas exchange rate usually stabilizes within approximately 3−4 min after the leaf tissue is clamped in the leaf chamber. Data for the construction of the A/Ci curves were collected immediately following the LRC measurements from the same sampled leaf. Pn was measured at CO2 concentrations of 400, 300, 200, 100, 150, 250, 350, 450, 550, 650, 750, 850, 950, 1,050, 1,250, 1,450 and 1,650 μmol·m−2·s−1 at photosynthesis saturating irradiance 800 µmol·m−2·s−1,which light intensity is sufficiently high to saturate the photosynthetic machinery without causing photoinhibition. A total of 41 LRC and 42 A/Ci curves were generated.
Measurement of leaf anatomical traits
-
Following the gas exchange measurement, five samples from leaves of each plant were harvested, sealed in polyethylene bags, and immediately brought back to the laboratory. Two segments (3 mm × 5 mm) were cut from each leaf halfway between the leaf apex and base. The segments were dehydrated in sucrose solutions, followed by the inclusion with Gum Arabic aqueous solution. Transverse sections (7–10 μm) thickness was cut using a rotary microtome (Leica CM3050S, Germany) and stained with toluidine blue. Surface impressions were made manually and stained with 0.1% safranine aqueous solution. For each leaf, five transversal and surface sections were selected systematically to measure the leaf thickness (LT), upper cuticle thickness (UCT), upper epidermal thickness (UET), palisade tissue thickness (PT), spongy tissue thickness (ST), lower epidermal thickness (LET), lower cuticle thickness (LCT), stomatal density (d), and guard cell length (l) and width (w) using a binocular microscope binocular with 10× and 40× objectives (Leica DM5000 B). Subsequently, five micrographs per section were captured with a photomicroscope equipped with a Leica DFC500 camera (Leica Microsystems, Rijswijk, The Netherlands). Images were analyzed using Leica Leica LAS X software. Total stomach pore area (TSP) was calculated as d × 1/4π × l × w, assuming pore was an ellipse[15,18,19]. Here d is the stomatal frequency calculated by dividing the stomatal count by t field area, l is the guard cell length, and w is the guard cell width.
Calculations and statistical analysis
-
LRCs were fitted by applying a modified rectangular hyperbola model using Photosynthetic Calculation Software 4.1.1[20−22]. The modified rectangular hyperbola model is described by Eqn (1).
$ {P}_{\rm n}\left(I\right)=\mathrm{\alpha }\dfrac{1-\mathrm{\beta }I}{1+\mathrm{\gamma }I}I-{R}_{\rm d} $ (1) where Pn is the net photosynthetic rate (μmol·CO2·m−2·s−1), I is the photosynthetic photon flux density (μmol·m−2·s−1), Ic is compensation irradiance, β and γ are the coefficients which are independent of I, and α is the absolute value of slope between I = 0 and I = Ic.
For I = 0, the quantum yield at this point is defined as intrinsic quantum yield (IQY), which is given by Eqn (2).
$ \mathrm{I}\mathrm{Q}\mathrm{Y}=\mathrm{\alpha }{(1+(\mathrm{\gamma }+\mathrm{\beta })I}_{\mathrm{c}}) $ (2) The apparent quantum yield (AQY) ignored the Kok effect is obtained by Eqn (3).
$ \mathrm{A}\mathrm{Q}\mathrm{Y}=\mathrm{\alpha }\dfrac{1+(\mathrm{\gamma }-\mathrm{\beta }){I}_{\mathrm{c}}-\mathrm{\gamma }\mathrm{\beta }{I}_{\mathrm{c}}^{2}}{{(1+\mathrm{\gamma }{I}_{\mathrm{c}})}^{2}} $ (3) For I = 0, the rate of dark respiration (Rd) is Eqn (4).
$ {R}_{\mathrm{d}}=-{P}_{\mathrm{n}}\left({I}_{0}\right)=-\mathrm{\alpha }{I}_{\mathrm{c}} $ (4) The saturation irradiance Isat is obtained by Eqn (5).
$ {I}_{\mathrm{s}\mathrm{a}\mathrm{t}}=\dfrac{\sqrt{\left(\mathrm{\beta }+\mathrm{\gamma }\right)/\mathrm{\beta }}-1}{\mathrm{\gamma }} $ (5) The maximum photosynthetic rate Pnmax is given by Eqn (6).
$ {P}_{\rm{nmax}}=\alpha {\left(\dfrac{\sqrt{\beta +\gamma }-\sqrt{\beta }}{\gamma }\right)}^{2}-{R}_{\rm d} $ (6) A/Ci curves were fit by uploading the datasets to the website (
http://Leafweb.ornl.gov ) to estimate the parameters (Rd, Vcmax, Jmax, TPU, Γ*, gi). In this study, the A/Ci curves were taken at the saturation light level. Thus, the rate of electron transport (J) was to assume the maximum rate of electron transport (Jmax).The relationship between photosynthetic capacity and leaf anatomical traits was analyzed by calculating the Pearson correlation coefficient. The correlation coefficients were partitioned into direct and indirect effects using path analysis. The path diagram in Fig. 1 was utilized to examine the causal pathways between nine selected leaf anatomical traits and each photosynthetic parameter. In Fig. 1, the direct effects of leaf anatomical traits on photosynthetic parameters are represented by single-headed arrows, while coefficients of intercorrelations between leaf anatomical traits are represented by double-headed arrows.
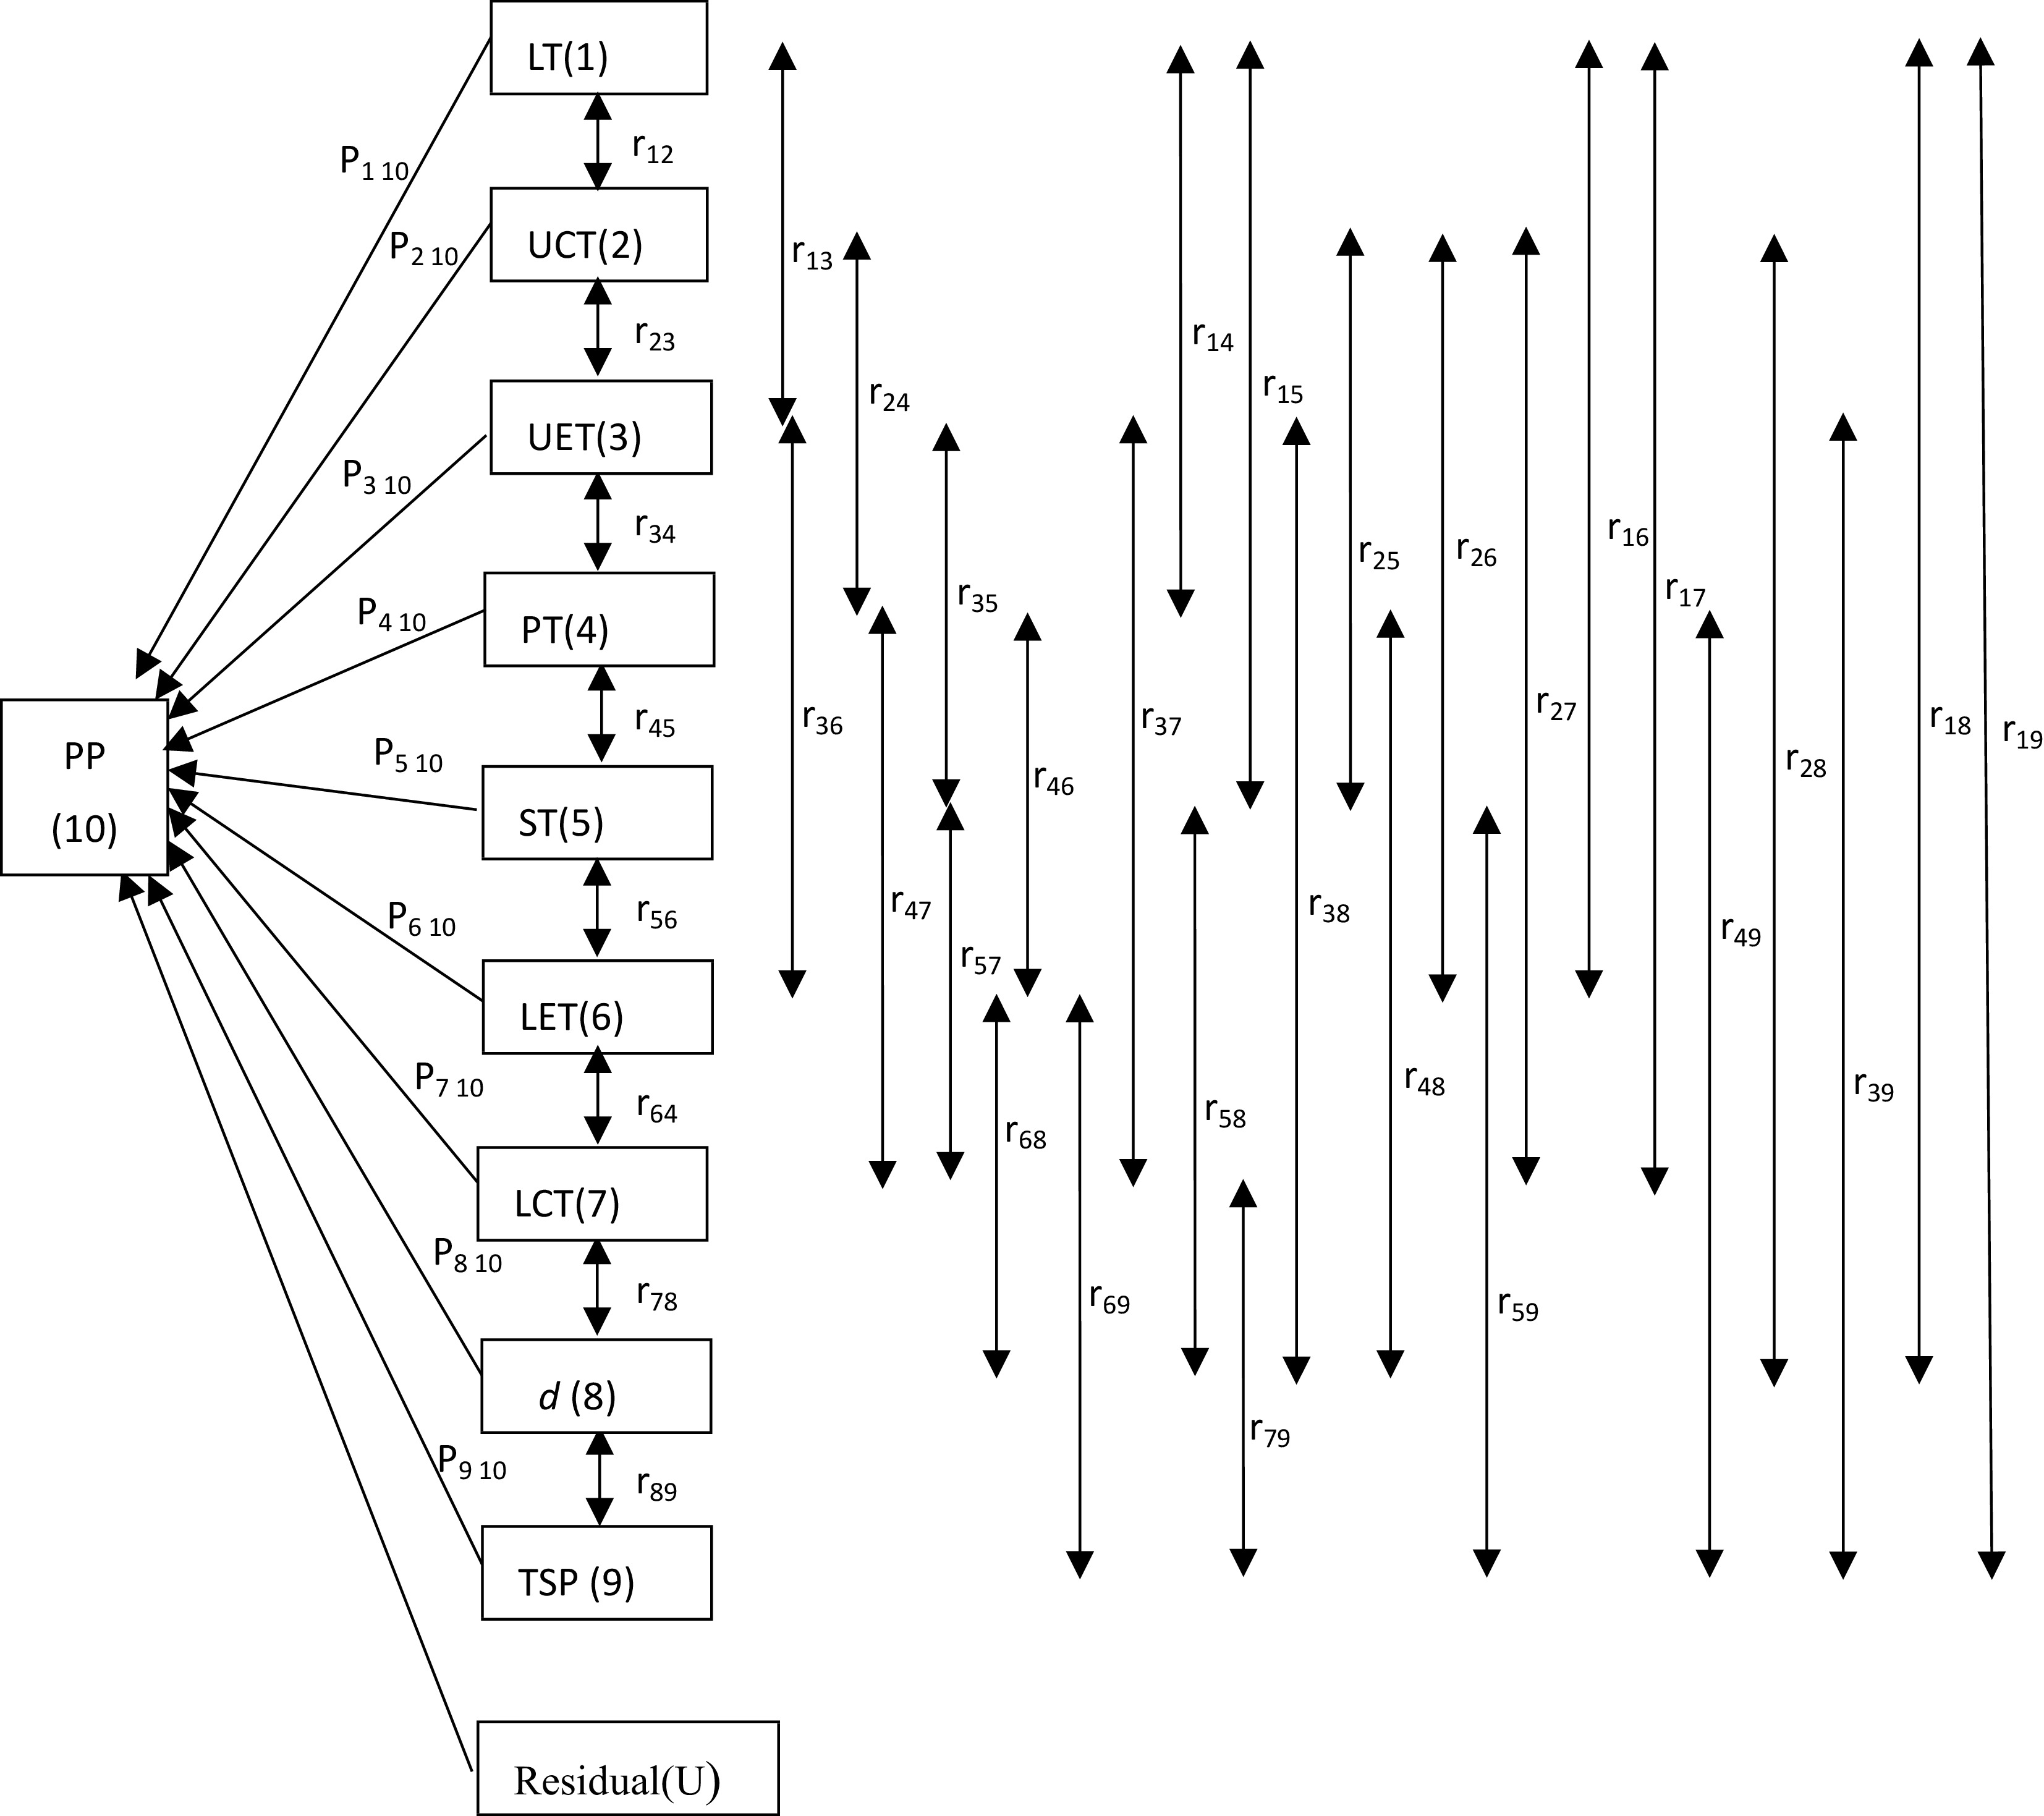
Figure 1.
Path diagram for the relationship between leaf anatomical traits and photosynthetic parameters. The direct effects (Pij) of leaf anatomical traits on the photosynthetic parameter (PP) are represented by single-headed arrows, while the indirect effects (rijPij) of leaf anatomical traits are shown by double-headed arrows. Subscript designations for leaf anatomical traits and photosynthetic parameters are identified numerically as follows: (1) LT = leaf thickness; (2) UCT = upper cuticle thickness; (3) UET = upper epidermal thickness; (4) PT = palisade tissue thickness; (5) ST = spongy tissue thickness; (6) LET = lower epidermal thickness; (7) LCT = lower cuticle thickness; (9) d = stomatal density; (10) TSP = total stomach pore area; and (10) PP = photosynthetic parameters. The photosynthetic parameters (PP) are IQY, AQY, α, Pmax, Isat, Ic, RD, Rd, Vcmax, Jmax, TPU, Γ*, gi, Ci, gs, VPD, A, E, WUE.
Path coefficient analysis was calculated as the method described by Dewey & Lu[23].
$\rm r_{ij} = p_{ij }+\textstyle\sum r_{ik} p_{kj}$ (7) where rij represents the simple correlation coefficient between the independent character (i) and dependent character (j) as measured by the correlation coefficient, Pij is the component of direct effects of the independent character (i) and dependent character (j) as measured by the path coefficient and,
$\textstyle\sum $ $\rm U= \sqrt{1-{\mathrm{R}}^{2}} $ (8) where R2 is the coefficient of determination, R2 =
$\textstyle\sum $ The multiple criteria decision analysis (MCDA) was used to evaluate comprehensive evaluation of the relationship between leaf anatomical traits and photosynthetic parameters. The objective weight of each photosynthetic parameter (Wj) is derived by using the Criteria Importance Though Intercrieria Correlation (CRITIC) method, which reflects the relative importance by applying the comparative and conflict information among the indicators[24]. Two calculation steps are used to evaluate the weights of each criterion using the CRITIC method.
Step 1 is to normalize the decision matrix using Eqn (9).
$ {\overline{\mathrm{x}}}_{\mathrm{i}\mathrm{j}}=\dfrac{{\mathrm{x}}_{\mathrm{i}\mathrm{j}}-{\mathrm{x}}_{\mathrm{j}}^{\mathrm{m}\mathrm{i}\mathrm{n}}}{{\mathrm{x}}_{\mathrm{j}}^{\mathrm{m}\mathrm{a}\mathrm{x}}-{\mathrm{x}}_{\mathrm{j}}^{\mathrm{m}\mathrm{i}\mathrm{n}}} $ (9) Step 2 is to calculate the weights for each criterion
$\rm C_{j}= {\mathrm{\sigma }}_{\mathrm{j}}\mathop\sum\nolimits _{\mathrm{j}=1}^{\mathrm{n}}\left(1-{\mathrm{R}}_{\mathrm{i}\mathrm{j}}\right) $ (10) $\rm W_j=C_j/\mathop\sum\nolimits^{m}_{j=1} C_j $ (11) where, σj was the standard deviation of each criterion j, and Rij is the linear correlation coefficient between the vectors Xi and Xj. The comprehensive evaluation value of the effects of leaf anatomical traits on photosynthetic parameters were estimated from Eqn (12).
$ {\mathrm{Q}}_{\mathrm{i}}=\mathop\sum\nolimits _{\mathrm{j}=1}^{\mathrm{n}}\left({\mathrm{w}}_{\mathrm{j}}\times {\mathrm{D}}_{\mathrm{i}\mathrm{j}}\right) $ (12) where Dij was the correlation (direct effects, indirect effects, and Pearson's correlation, respectively) between leaf anatomical trait i and photosynthetic parameter j. All statistical analyses were conducted with IBM SPSS Statistics 24.
-
The photosynthetic light-response curve (Fig. 2) was well fitted by the modified rectangular hyperbola model (R2 = 0.945 ± 0.006) described by Ye[22]. The Pn increased with I below the Isat. As I rise above the Isat, Pn decreases as I increase, implying a photoinhibition phenomenon. The calculated AQY would be 0.028 ± 0.003 if the Kok effect was ignored. This value was lower than α (0.031 ± 0.003) and the IQY (0.033 ± 0.003). The maximum Pn values calculated by the modified rectangular hyperbola model at the Isat of 621.762 ± 37.358 μmol (photon) m–2·s–1 was 5.131 ± 0.478 μmol (CO2) m–2·s–1 for coffee leaf. The values of Ic and RD were 60.238 ± 11.332 μmol (photon) m–2·s–1 and 0.930 ± 0.098 μmol (CO2) m–2·s–1, respectively.
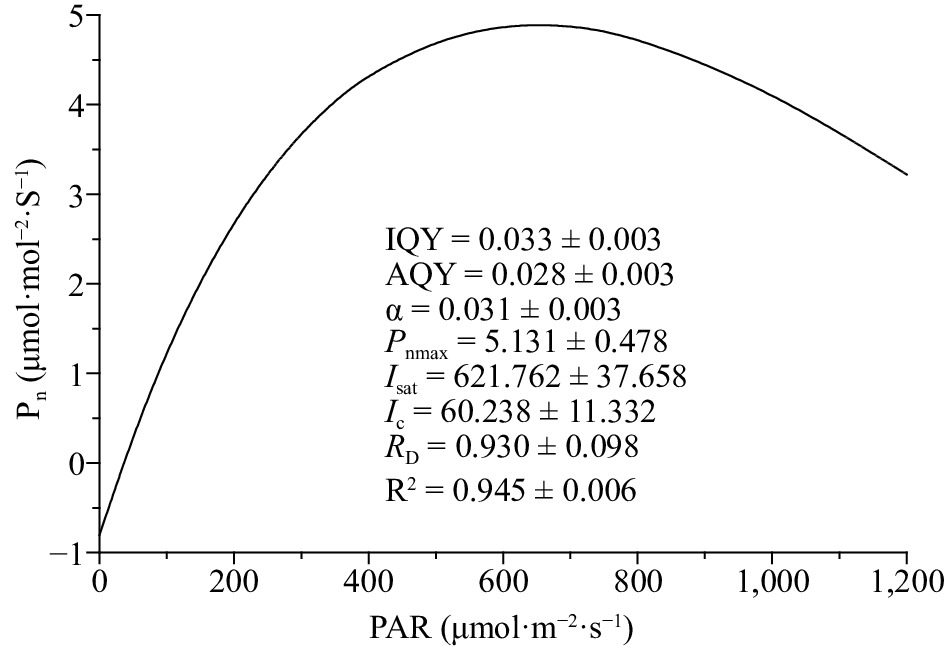
Figure 2.
Photosynthetic light-response curve of coffee plants. Data shown in the figure indicate mean ± standard error. IQY – intrinsic quantum yield; AQY – apparent quantum yield; α – the absolute value of slope between I = 0 and I = Ic; Pnmax – maximum photosynthetic rate [µmol (CO2) m–2·s–1]; Isat – light saturation point [µmol (photon) m–2·s–1]; Ic – light compensation point [µmol (photon) m–2·s–1]; RD – dark respiration [µmol (CO2) m–2·s–1].
The A/Ci curve was fitted with the interactive website (
www.leafweb.ornl.gov ) based on the FvCB model structure[25]. Figure 3 shows the response of A (net photosynthesis) to Ci for coffee leaves. The fitted parameter values for Vcmax, Jmax, Tp, Rd, Γ *, gi, and Kco were 61.749 ± 5.394, 63.165 ± 3.859, 5.316 ± 0.576, 3.225 ± 0.441, 3.309 ± 0.333, 1.101 ± 0.287, 103.096 ± 11.721, respectively. The transition between the Rubisco and RuBP regeneration-limited states (Ci_CJ) occurs around 20 Pa of intercellular CO2 (Fig. 3).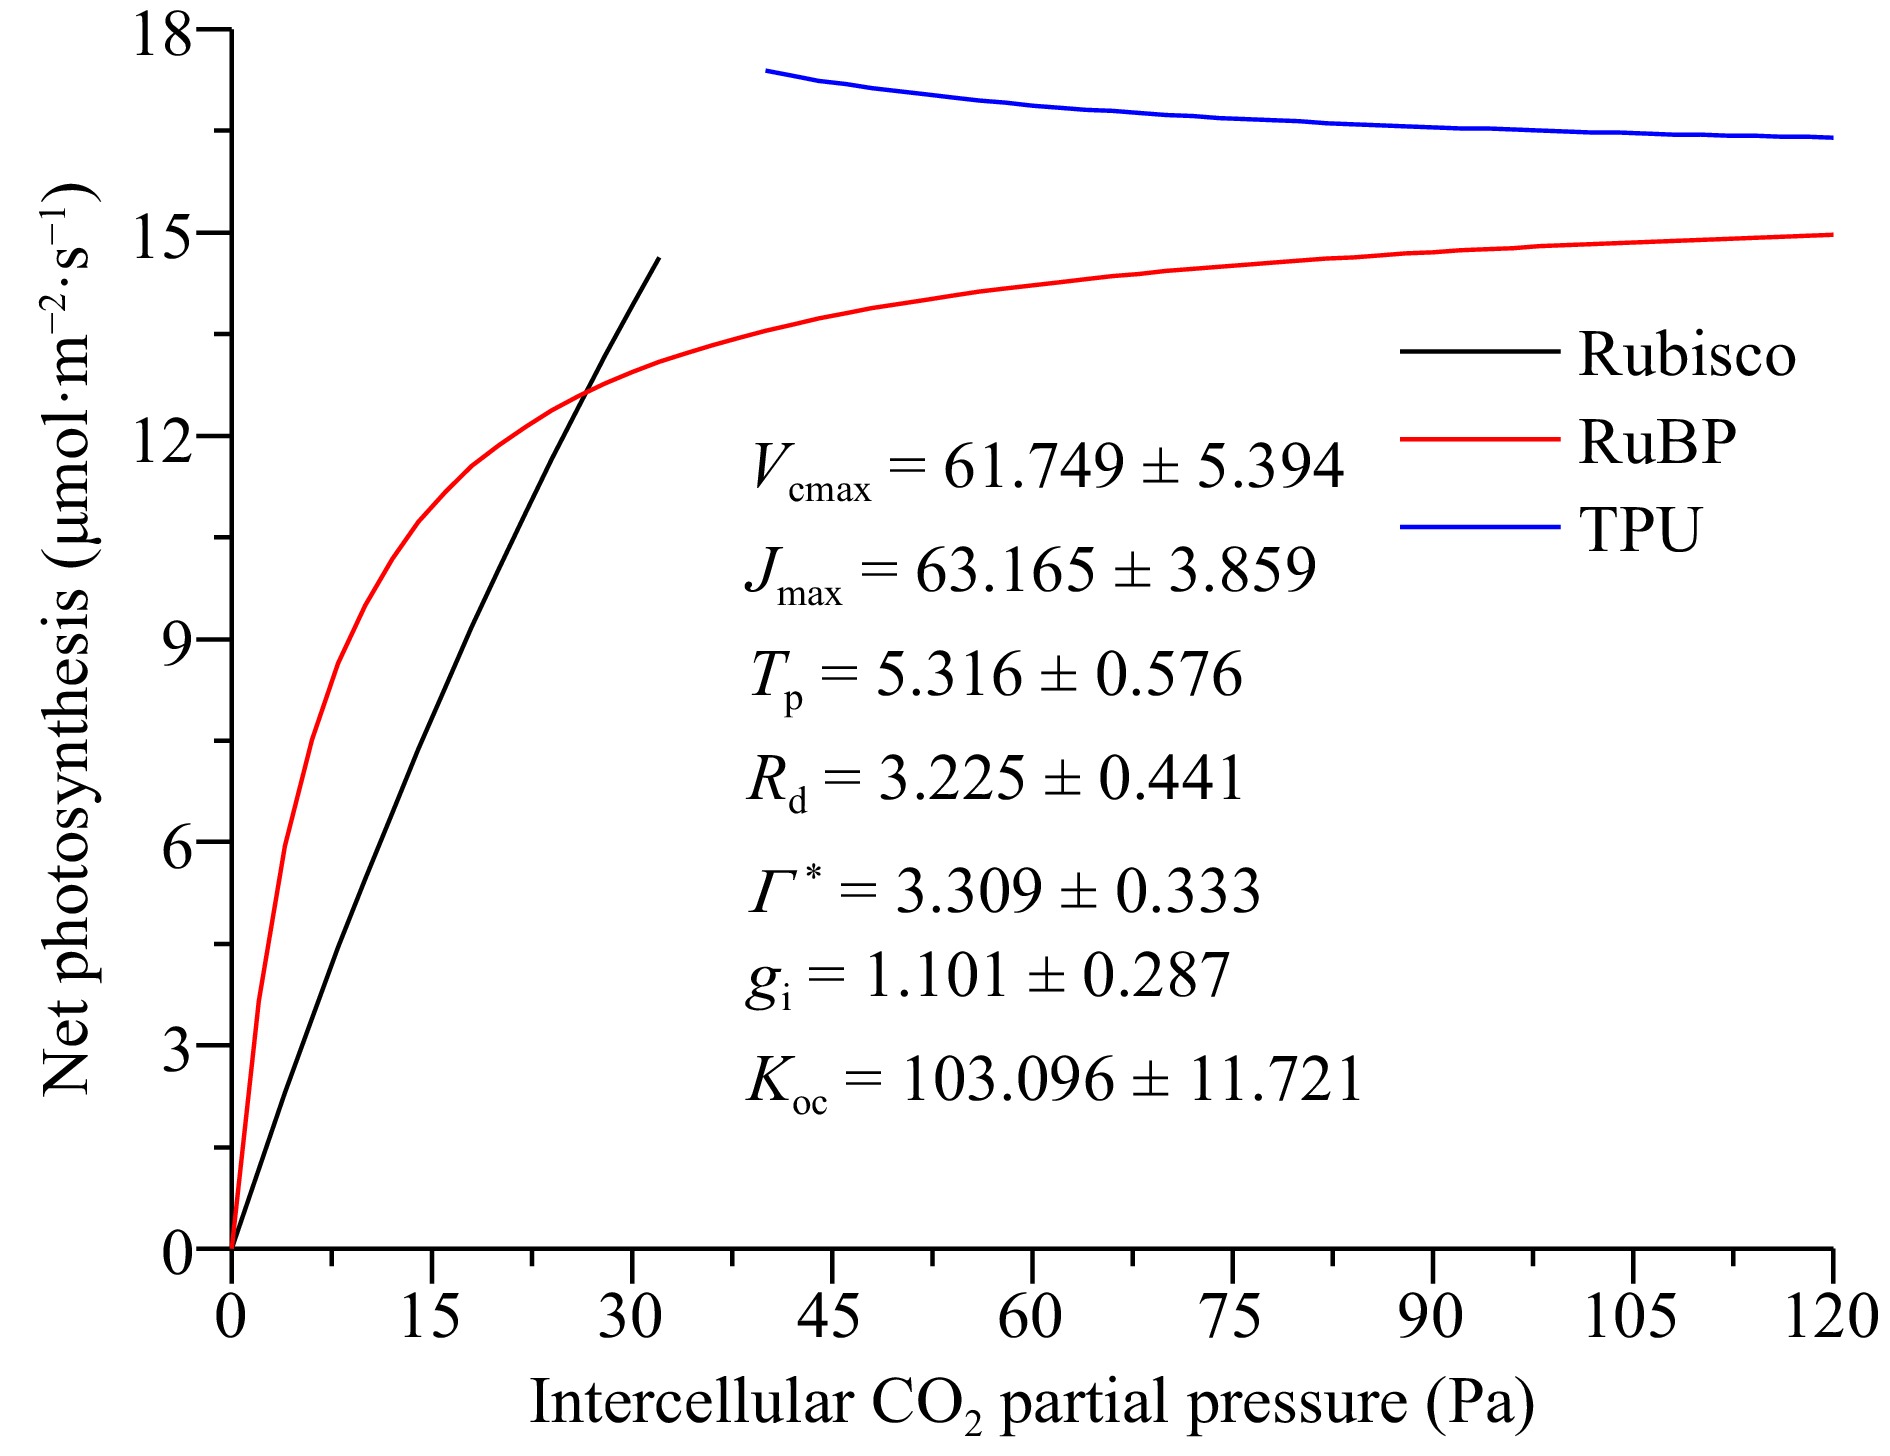
Figure 3.
The A/Ci curves for the coffee plants. Data shown in the figure indicate mean ± stand error. Ci – Intercellular CO2 concentration (µmol·mol–1); Vcmax – Maximal Rubisco carboxylation rate (µmol·m–2·s–1); Jmax – Maximal electron transport rate (µmol·m–2·s–1); Tp – Rate of triose phosphate export from the chloroplast (µmol·m–2·s–1); Rd – Day respiration (µmol·m–2·s–1); Γ* – CO2 compensation point in the absence of dark respiration (Pa); gi – Internal (mesophyll) conductance to CO2 transport (µmol·m–2·s–1·Pa−1); $ {K}_{oc} $ – A composite parameter (Pa): $ {K}_{\rm{oc}}={K}_{\mathrm{c}}(1+O/K_{\rm o}) $.
Cross-sections observed under a light microscope revealed that the coffee leaves were bifacial, with a typical well-differentiated single layer of elongated palisade mesophyll cells on the adaxial side and large spongy mesophyll cells on the abaxial side. The large spongy mesophyll cells at the abaxial side comprised almost 60% of the total blade thickness (Table 1). Of all the tissues, the palisade tissue thickness (PT) showed the highest variation in dimensions (CV = 13.243%). The stomatal density (d) and total stomatal pore area (TSP) were 152.028 and 0.439, respectively (Table 1).
Table 1. The components of anatomical tissues in Arabica coffee leaf.
Leaf anatomy Mean SE CV (%) Proportion of leaf thickness (%) Tissue components (µm) LT 255.627 1.832 4.645 100.000 UCT 5.497 0.042 4.962 2.154 UET 23.681 0.291 7.957 9.279 PT 51.014 1.042 13.243 19.913 ST 153.285 1.245 5.264 59.969 LET 17.908 0.195 7.056 7.023 LCT 4.243 0.040 6.121 1.662 Stomatal characteristics W (µm) 8.252 0.048 3.733 L (µm) 27.874 0.208 4.839 d (No./mm2) 152.028 1.942 8.277 TSP 0.439 0.006 8.886 LT – leaf thickness, UCT – upper cuticle thickness, UET – upper epidermal thickness, PT – palisade tissue thickness, ST – spongy tissue thickness, LET – lower epidermal thickness, LCT – lower cuticle thickness, w – guard cell width, l – guard cell length, d – stomatal density, TSP – total stomach pore area. Pearson's correlation analysis established correlations between 19 physiological indexes and leaf anatomical traits (Table 2). The UCT showed negative correlation with the indexes of IQY, AQY, α, Isat, and gi (p < 0.05). The UET was positively related to AQY, α, and Pmax (p < 0.05) and negatively related to Ic, Rd, Ci, and VPD (p < 0.05) (Table 2). The relationship between PT and IQY, AQY, and α was significantly negative (p < 0.05). A significant negative correlation was between LET and Ic (p < 0.05). The Pearson correlation coefficient between LCT and Isat was significantly negative (p < 0.05). The guard cell width (w) significantly affected Ic and Rd (p < 0.05). The guard cell length (l) was negatively correlated with IQY, AQY, α, and Isat, and positively correlated to Jmax (p < 0.05). A strong positive (p < 0.01) correlation was found between stomatal density (d) and Jmax. However, the LT and ST did not significantly affect photosynthetic efficiency according to the Pearson correlation study.
Table 2. The correlation between leaf anatomical traits and photosynthetic parameters.
Parameters LT UCT UET PT ST LET LCT w l d TSP IQY −0.044 ns −0.336* 0.296 ns −0.343* −0.010 ns 0.000 ns −0.232 ns 0.175 ns −0.315* 0.232 ns 0.103 ns AQY −0.024 ns −0.322* 0.386* −0.394* 0.012 ns 0.039 ns −0.224 ns 0.197 ns −0.358* 0.206 ns 0.068 ns α −0.033 ns −0.332* 0.351* −0.375* 0.005 ns 0.022 ns −0.230 ns 0.189 ns −0.342* 0.217 ns 0.082 ns Pmax 0.178 ns −0.108 ns 0.324* −0.036 ns 0.103 ns 0.100 ns −0.065 ns −0.037 ns −0.233 ns 0.143 ns −0.003 ns Isat −0.057 ns −0.359* 0.157 ns −0.278 ns 0.189 ns −0.202 ns −0.377* −0.227 ns −0.460** 0.031 ns −0.313* Ic −0.064 ns −0.143 ns −0.324* 0.164 ns −0.008 ns −0.336* −0.174 ns −0.323* −0.071 0.017 ns −0.150 ns RD 0.025 ns −0.234 ns −0.195 ns 0.204 ns 0.057 ns −0.190 ns −0.150 ns −0.243 ns −0.005 ns 0.156 ns 0.036 ns Rd 0.097 ns 0.161 ns −0.477** 0.101 ns 0.003 ns −0.129 ns 0.071 ns −0.354* 0.133 ns −0.043 ns −0.114 ns Vcmax −0.021 ns −0.097 ns 0.009 ns 0.106 ns 0.188 ns 0.019 ns −0.161 ns 0.172 ns −0.003 ns 0.139 ns 0.200 ns Jmax −0.086 ns −0.169 ns −0.104 ns −0.047 ns −0.035 ns −0.188 ns −0.183 ns −0.003 ns −0.212 ns 0.403** 0.246 ns TPU −0.033 ns −0.145 ns −0.209 ns 0.012 ns 0.045 ns −0.008 ns 0.015 ns −0.162 ns 0.045 ns 0.245 ns 0.183 ns Γ* −0.210 ns 0.181 ns −0.086 ns −0.159 ns −0.239 ns 0.228 ns 0.119 ns −0.163 ns 0.104 ns −0.285 ns −0.276 ns gi 0.207 ns −0.433* 0.311 ns −0.092 ns 0.371 ns −0.071 ns −0.420* −0.006 ns −0.301 ns −0.149 ns −0.301 ns Ci −0.066 ns 0.108 ns −0.396** 0.257 ns −0.125 ns −0.164 ns 0.187 ns −0.053 ns 0.311* −0.080 ns 0.077 ns gs 0.140 ns −0.111 ns 0.278 ns 0.073 ns 0.044 ns 0.146 ns 0.053 ns 0.005 ns −0.085 ns 0.174 ns 0.116 ns VPD −0.023 ns 0.071 ns −0.372* 0.281 ns −0.143 ns −0.230 ns 0.106 ns −0.063 ns 0.221 ns 0.052 ns 0.148 ns A 0.157 ns −0.079 ns 0.346* 0.007 ns 0.049 ns 0.203 ns 0.047 ns 0.048 ns −0.117 ns 0.149 ns 0.094 ns E 0.196 ns −0.057 ns 0.224 ns 0.191 ns 0.031 ns 0.068 ns 0.106 ns 0.002 ns 0.003 ns 0.164 ns 0.158 ns WUE 0.049 ns −0.115 ns 0.350* -0.230 ns 0.184 ns 0.226 ns -0.142 ns 0.041 ns -0.216 ns 0.074 ns -0.038 ns LT – leaf thickness, UCT – upper cuticle thickness, UET – upper epidermal thickness, PT – palisade tissue thickness, ST – spongy tissue thickness, LET – lower epidermal thickness, LCT – lower cuticle thickness, w – guard cell width, l – guard cell length, d – stomatal density, TSP – total stomach pore area. Ns = non-significant. *, ** represent significant; highly significant differences at 5% and 1% probability levels, respectively. Path analysis was performed to reveal the direct and indirect effects of leaf anatomy traits on photosynthetic capacity. The results indicating the effect are shown in Fig. 4 & Supplemental Table S1. Although correlation analysis suggested no significant correlations between LT and photosynthetic capacity variables (p > 0.05), LT had relatively high direct positive effects on gi (0.545), IQY (0.467), Rd (0.476), and α (0.420) and a high negative direct effect on Isat (−0.415) (Fig. 4a). The path coefficient analysis revealed that UCT had a high magnitude negative direct effect on IQY (−0.686), α (−0.676), AQY (−0.652), gs (−0.685), and TPU (−0.517). The UET had highly negative direct effects on Rd (−0.859) and TPU (−0.632) s,but moderate positive direct effects on E (0.479), Pmax (0.437), and A (0.423). The PT exhibited an impressive negative direct effect on TPU (−0.474), AQY(−0.514), α (−0.506), and IQY (−0.487), while a high positive direct effect was shown between PT and E (0.445). The ST had a high positive direct effect on Isat (0.630) and WUE (0.583), and a similar high negative direct effect on VPD (−0.579). LET had high positive direct effects on WUE (0.482), gi (0.416), TPU (0.462), and Vcmax (0.398), a relatively high negative direct effect LET and Ic (−0.314) and VPD (−0.311). The LCT showed a negative direct effects Vcmax (−0.539), Ic (−0.370), RD (−0.411), Jmax (−0.378), gi (−0.340) and VPD (−0.328), but a moderate positive direct effect on Γ* (0.359). The stomatal density (d) exhibited large positive direct effects on Pmax (0.672) Isat (0.893), WUE (0.673), and Jmax (0.482), and high negative direct effects on Ci (−0.772) and VPD (−0.576) were found. The negative direct effect of TSP on Isat (−1.05) was very high, followed by Pmax (−0.519) and WUE (−0.496). In addition, TSP showed high positive direct effects on gi (0.613) and VPD (0.579).
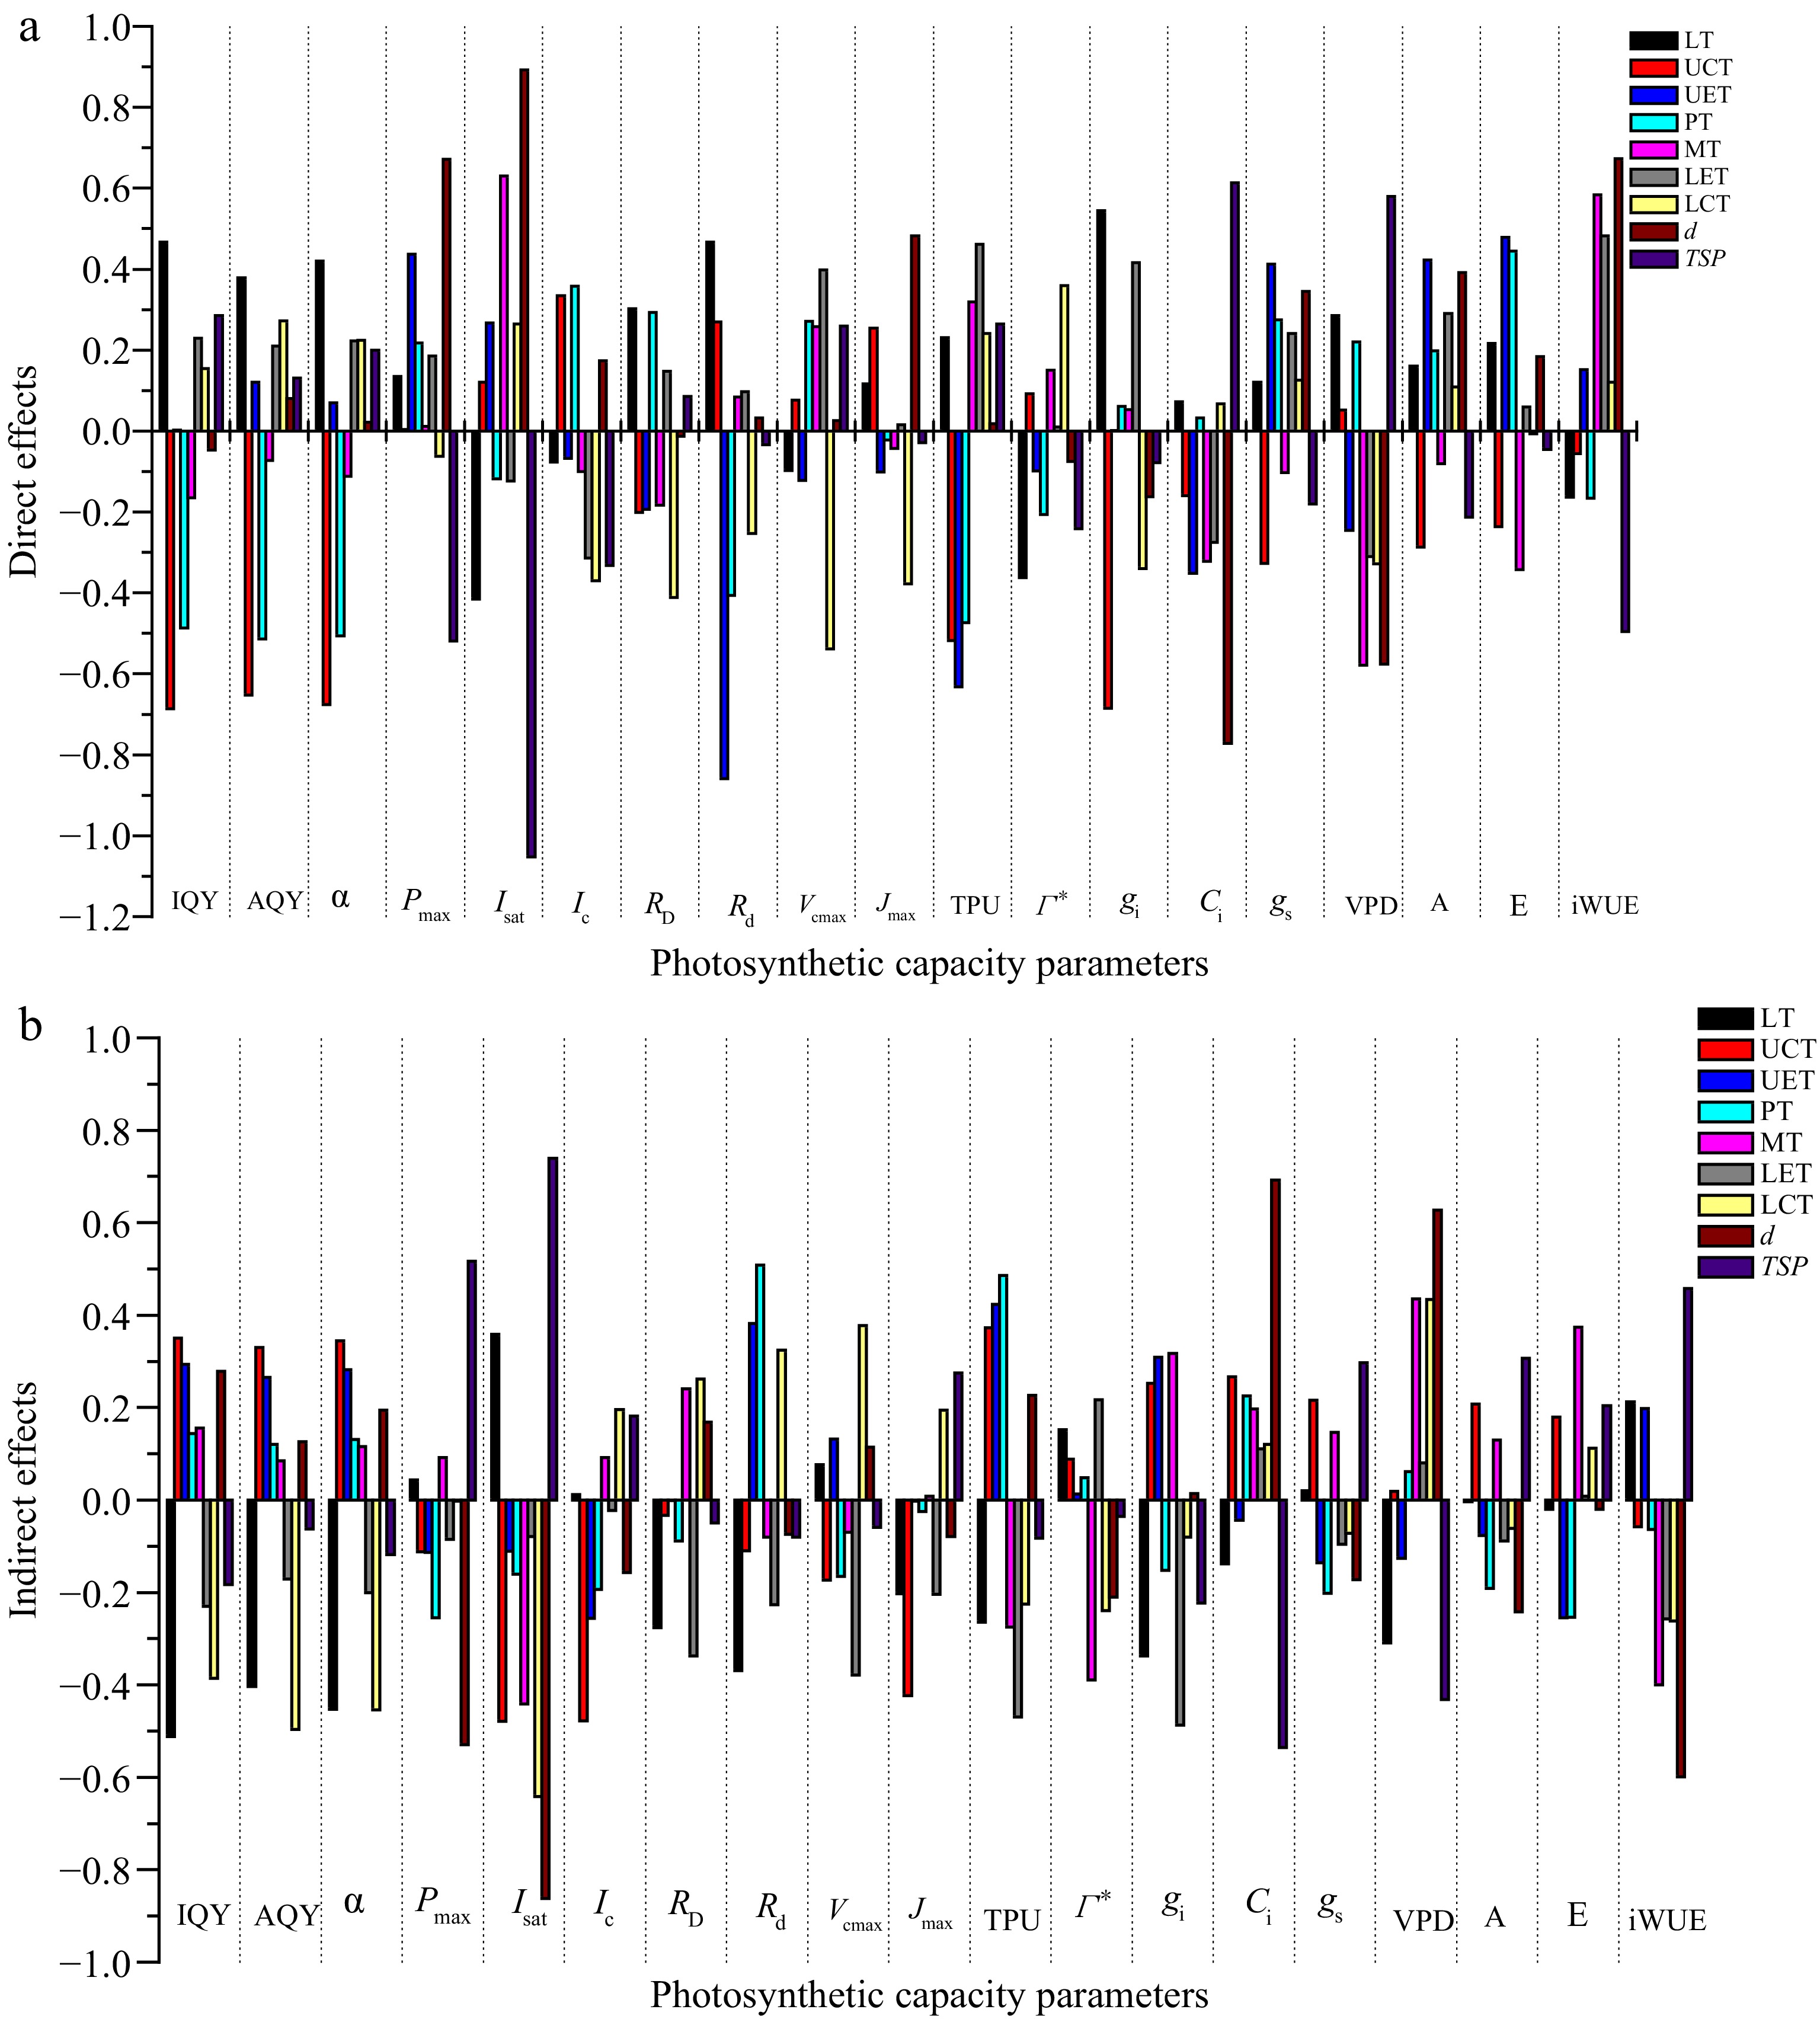
Figure 4.
(a) Direct and (b) indirect effects of each leaf anatomical traits through other traits on photosynthetic parameters. LT – leaf thickness, UCT – upper cuticle thickness, UET – upper epidermal thickness, PT – palisade tissue thickness, ST – spongy tissue thickness, LET – lower epidermal thickness, LCT – lower cuticle thickness, w – guard cell width, l – guard cell length, d – stomatal density, TSP – total stomach pore area. The residual effect of IQY, AQY, α, Pmax, Isat, Ic, RD, Rd, Vcmax, Jmax, TPU, Γ*, gi, Ci, gs, VPD, A, E, and WUE was 0.799, 0.760, 0.775, 0.849, 0.737, 0.859, 0.908, 0.755, 0.883, 0.887, 0.860, 0.877, 0.644, 0.817, 0.858, 0.821, 0.840, 0.858, and 0.801, respectively.
The estimates of the indirect effect of leaf anatomical trait on photosynthetic capacity via other leaf anatomical traits were presented in Fig. 4b and Supplemental Table S2. According to this figure, the LT had highly negative indirect effects on IQY (−0.511), α (−0.453), AQY (−0.403), Rd (−0.369), and gi (−0.338). but a high positive indirect effect on Isat (0.358). The UCThad high indirect effect on Isat (−0.479), Ic (−0.477), Jmax (−0.423), TPU (0.372), IQY (0.350), AQY (0.330), and α (0.344). The UET indirectly exerted relatively high positive effects on TPU (0.424) and Rd (0.382). Similarly, the PT exhibited relatively high positive indirect effects on Rd (0.508) and TPU (0.486). The ST had high negative on Isat (−0.441), Γ* (−0.389), and WUE (−0.399), but relatively high positive indirect effects on gi (0.318) and E (0.374). The LET revealed a positive indirect effect on RD (−0.338), Vcmax (−0.379), TPU (−0.469), gi (−0.487) through other anatomical traits. The LCT had negative indirect effects on IQY (−0.386), AQY (−0.497), α (−0.454), and Isat (−0.642), but a highly positive indirect effects LCT on VPD (0.433) and Vcmax (0.377). Stomatal characteristics (d) play a key role in determining photosynthesis. In this study, the stomatal density (d) indirectly influenced Pmax, Isat, and WUE with a relatively high negative magnitudes (−0.529, −0.862, and −0.599), but had a relatively high positive indirect effect of stomatal density (d) on Ci (0.692), and VPD (0.628). The TSP presented a relatively high negative indirect effect on Ci (−0.536) and VPD (−0.432), but highly positive indirect effect of TSP on Isat (0.739), Pmax (0.516), and WUE 0.458).
To identify the combined effect of leaf anatomical traits on photosynthetic parameters, a comprehensive evaluation analysis was conducted. Based on the evaluation values (Qi), the ranking of the comprehensive scores of relationships between photosynthetic capacity and leaf anatomical traits was shown in Table 3. For the direct effect, the LT had the highest comprehensive score, followed by LET, d, ST, PT, UET, TSP LCT, and UCT. For the comprehensive score of indirect effect of leaf anatomical traits on photosynthetic capacity, the UET held the highest comprehensive score, and UCT was the second, followed by ST, TSP, PT, d, LCT, LT, and LET. Similar results from the Pearson correlation analyses of comprehensive assessments revealed that the first comprehensive assessment score was d and that the second assessment score was also ST. Then, the ranking order after the third was UET, LT, TSP, PT, LET, LCT, and UCT.
Table 3. Comprehensive ordering of the effects of leaf anatomical traits on photosynthetic capacity using the CRITIC method.
Anatomical traits Direct effects Indirect effects Pearson's correlation Comprehensive score Ranking Comprehensive score Ranking Comprehensive score Ranking LT 0.160 1 −0.127 8 0.033 4 UCT −0.175 9 0.055 2 −0.121 9 UET −0.025 6 0.063 1 0.038 3 PT −0.010 5 −0.003 5 −0.013 6 ST −0.009 4 0.052 3 0.043 2 LET 0.132 2 −0.151 9 −0.020 7 LCT −0.048 8 −0.029 7 −0.077 8 d 0.095 3 −0.024 6 0.072 1 TSP −0.043 7 0.041 4 −0.002 5 LT – leaf thickness, UCT – upper cuticle thickness, UET – upper epidermal thickness, PT – palisade tissue thickness, ST – spongy tissue thickness, LET – lower epidermal thickness, LCT – lower cuticle thickness, w – guard cell width, l – guard cell length, d – stomatal density, TSP – total stomach pore area. -
Several studies involving gas exchange measurements of coffee leaves have been performed. These studies indicate that the photosynthetic capacity of coffee leaves varies with varying environmental conditions[26−29]. For single coffee leaves, the saturating irradiance is between 300 and 700 µmol·m−2·s−1, with shade leaves showing a lower value than lower sun leaves[27]. This study found that the saturating irradiance of sun leaves was about 620 µmol photons m−2·s−1, which was consistent with the result of the above mention. Quantum yields revealed the relationship between a given light-dependent product and the number of absorbed photons[30]. Quantum yield is 0 when none of the light energy is used in photosynthesis. Quantum yield is 1 when all the absorbed light is used. Based on the results of Ye, the quantum yield decreased with I increasing[22]. Thus, the IQY was higher than AQY. In the past, there were several pertinent points about the maximal photosynthetic rates of coffee leaves. For example, Kumar & Tieszen and Cannell have pointed out that the maximal photosynthetic rates of sun leaves of coffee are around 7 µmol CO2 m−2·s−1 and 8.8 µmol CO2 m−2·s−1, respectively[26,31]. However, Bote et al. reported that the maximal photosynthetic rates of sun leaves of coffee were lower than 7 µmol CO2 m−2·s−1 with a larger N supply[32]. In this study, the maximal photosynthetic rates were lower than the observations of Kumar & Tieszen and Cannell and consistent with the results of Bote et al[26, 31, 32]. For coffee leaves, light saturation would lead to an excess of electron transport capacity[33]. Therefore, a higher Jmax was observed under light saturation. In addition, the values of Vcmax and Jmax were larger than the results reported by Martins et al[33].
The correlation analysis is a great utility method for understanding the relationships between variables. In this study, significant correlations between photosynthetic capacity and leaf anatomical traits were observed, indicating that leaf anatomical traits could affect photosynthetic capacity. Despite the correlation coefficients could provide a good way to understand the relationships between variables, the cause and effect relationships between variables could not be estimated[34]. Path analysis, a method that investigates the causal relationship, gives detailed understanding of positive and negative correlations between traits[34]. The result of the path analysis is shown in Fig. 3, indicating that there were high-level direct and indirect effects of leaf anatomical traits on photosynthetic capacity. This may explain the importance of leaf structure in photosynthesis. However, the estimated residual effect in this study was high (0.661-0.908), indicating that additional characters which affect photosynthetic capacity are not included in the investigation. For leaf photosynthesis, the overall photosynthetic limitation can be partitioned into different components, such as stomatal, mesophyll, and biochemical limitations[35]. The stomatal and mesophyll limitations in coffee leaves accounted for 0.30 and 0.38, respectively[33]. This is consistent with the results, where about 30% of the variability in photosynthetic capacity was contributed by the characters studied in the path analysis in this study. In order to quantitatively evaluate the effect of each structure of the leaf on photosynthesis, the comprehensive evaluation values calculated by using Equation (13) introduced in the methods. The ordering Pearson's correlation of comprehensive score showed that stomatal density (d) and spongy tissue thickness (ST) were the most important leaf anatomical traits for coffee leaf photosynthesis. For Arabica coffee, leaf photosynthesis is greatly limited by CO2 diffusion[36]. The CO2 diffusion from the air to the leaf mesophyll is mainly modulated by the stomatal conductance (gs), which is associated with stomatal density (d)[5,37]. According to the comprehensive score of indirect effect, the stomatal density (d) also had the highest comprehensive score. This indicates that stomatal density (d) is essential for coffee leaf photosynthesis. In fact, higher stomatal density will increase gs by increasing the same total pore area[37] and allow more CO2 diffusion. This may partly explain why the total stomatal pore area (TSP) had higher comprehensive evaluation values in the effect of coffee leaf photosynthesis. Therefore, the result of a comprehensive evaluation revealed that Arabica coffee leaf of stomatal characteristics, such as guard cell width and length, stomatal density, and stomatal pore surface, plays a significant role in leaf photosynthetic capacity. This finding was also consistent with previous work, indicating that stomatal characteristics of the leaf are closely associated with photosynthesis by controlling the water loss and CO2 uptake[38,39].
The leaf thickness was strongly positively correlated with the fraction of intercellular air space in the leaves[17]. The result obtained in this study showed that leaf thickness (LT) affects photosynthesis mainly through direct and indirect effects, given that the CO2 diffusion in the gaseous phase is about three orders of magnitude larger than in the liquid[11]. Thus, the diffusive resistance should not necessarily increase considerably with increasing leaf thickness[40]. The result of direct effects of leaf thickness (LT) on photosynthetic capacity confirmed that increasing leaf thickness may increase gi. Moreover, due to the chloroplasts adhering to the inner surface of exposed mesophyll cell walls, thicker leaves provide space for more chloroplasts per unit leaf area[5] and possess more chloroplast surface area, which results in a substantial increase in carbon dioxide absorption because of a larger surface area for diffusion[40]. The direct effects of the path analysis indicate that greater leaf thickness would facilitate CO2 diffusion in the mesophyll (gi). Furthermore, thicker leaves may have higher total contents of Rubisco and leaf N per unit area[41], so it advantageous to realize high photosynthetic rates in highlight environments[42]. In this study, leaf thickness (LT) affects photosynthetic indexes that were IQY, α, AQY, Rd, gi, and Isat, and, consequently, photosynthesis rate. Therefore, the result of a comprehensive evaluation revealed that leaf thickness (LT) was the most important role in the direct effect on leaf photosynthetic capacity.
The structure of the leaf cuticle consists of epicuticular wax, birefringent wax embedded in cutin, cutin matrix, and pectic substance[43]. The epicuticular wax can decrease light by scattering[32]. Similar results have been found in this study where an increase in upper cuticle thickness (UCT) could result in a decrease in IQY, AQY, and α, which were related to light absorption in photosynthesis. The most cutin matrix in the cuticle is heterogeneous, and the areas of embedded waxes exhibit birefringence in polarized light[43]. This heterogeneous structure of the leaf cuticle may affect epidermal focusing, allowing actinic light to penetrate deeper into the mesophyll[32]. These findings most likely explained the significant relationship between cuticle thickness and quantum yield of photosynthesis, such as IQY, AQY, and α. In addition, the cuticle thickness would increase resistance to CO2 diffusion[44], and the negative relationships between UCT and LCT and photosynthetic parameters were also observed in this study.
The epidermal cell usually has a large transparent central vacuole and lacks mature chloroplasts, thus the light can directly pass from these cells into the mesophyll[32]. However, these epidermal cells have various shapes, such as plano-convex, spherical, conical, or some other convex shape[45]. The curved outermost epidermal cell wall can affect the focal point within the leaf[46]. However, the result of Brodersen & Vogelmann showed that there was no relation between the convexity of epidermal cells and the absorptance of diffuse light[47]. Although two contradictory hypotheses have been proposed concerning the impacts of epidermal cells on photosynthesis, the significant relationship between UET and photosynthetic capacity parameters in this study examined epidermal lens effects on many photosynthetic parameters and elucidated epidermal cells property plays an important role in photosynthetic capacity.
The columnar palisade tissue minimizes light scattering when the incident light collimated with the columnar palisade[48]. As a result, palisade tissue allows large amounts of light to penetrate the chloroplasts within the leaf[48]. The present study has revealed a remarkable relation between quantum yields and PT. However, the results of this study indicated that PT increase would directly decrease the IQY, AQY, and Jmax. This circumstance is very difficult to comprehend. Generally, palisade tissue has much more chloroplasts compared with other leaf tissue[49]. Thus, the photosynthetic activity of the palisade tissue would be higher. Indeed, the shape of cells in the leaves is strongly associated with photosynthetic performance by affecting the movement and distribution of chloroplasts[50]. There was a great variety of dimensions of the palisade tissue thickness (PT) in this study. Coordinated regulation of leaf cell shape and chloroplast motion according to light conditions is essential for efficient leaf photosynthesis[50]. This work could partially explain the result of a negative direct effect of PT on photosynthetic parameters.
The concentration of CO2 in the mesophyll is affected by air temperature, and each degree rise in temperature above 24 °C results in a 20 ppm rise in CO2 concentration[51]. However, Khairi & Hall's studies of citrus photosynthesis revealed that mesophyll conductance to CO2 decreased as temperature increased from 22 °C to around 40 °C[52]. In the analysis of the effects of leaf anatomical traits on photosynthetic capacity, the spongy tissue thickness (ST) had larger indirect effects and Pearson’s correlation comprehensive score, suggesting that spongy tissue thickness (ST) plays an important role in the photosynthetic process. Furthermore, Martins et al. demonstrated that mesophyll thickness is related to water flux and gas exchange per leaf area[33], which is consistent with the findings of this study. The spongy tissue thickness (ST) had direct effects on WUE and VPD. On the other hand, the irregularly shaped spongy cells alternating with air spaces increase light absorption due to the increased optical path length through a leaf[11], and this absorbed light will be advanced for photosynthesis[31,47]. Therefore, the high direct spongy tissue thickness (ST) effects upon Isat were also observed in this study. In fact, the increase in spongy tissue thickness (ST) would increase the surface area of chloroplasts exposed to intercellular airspace, which was associated with CO2 transfer conductance[53]. Although there was little relationship between spongy tissue thickness (ST) and photosynthetic parameters, high direct spongy tissue thickness (ST) effects upon Isat, WUE, and VPD were observed.
Stomatal density (SD) is a factor associated with the photosynthetic rates of the leaf[54]. The CO2 diffusion conductance is influenced by the density and arrangement of the stomata[11]. For the coffee leaf, the net carbon assimilation rate (A) is greatly governed by the diffusive conductance of CO2, thus the photosynthesis of the coffee leaf was largely limited by a diffusive factor[55]. Stomata have traditionally been thought to play an important role in controlling CO2 diffusion[55] and were a key parameter in C. arabica photosynthesis[29]. Among the various stomatal characters, stomatal density plays a major role in gas exchange and photosynthesis[56]. In this study, it is shown that stomatal density had the highest comprehensive scores compared with other anatomical traits on indirect effects and Pearson’s correlation comprehensive evaluation. In addition, structural modification of the stomata is one of the key factors affecting stomatal conductance[30]. The result of this study also showed that the guard cell length (l) significantly correlated positively with Ci.
For light absorption, although the result of Martins et al. showed that the guard cell length did not change in response to light treatments[33], there was a significant correlation with IQY and AQY. The coordination between increased initiation of stomata cells and expansion of epidermal cells was observed in coffee leaves, implying that there was an optimization of the trade-off between transpiration costs and CO2 assimilation[33]. In addition, the size and density of the stomata largely affect the diffusive conductance of the leaves to CO2, and the balance between the amount of CO2 required for photosynthesis and the level of water availability is also determined by the stomatal traits[37]. Thus, lower epidermal stomatal density had a significant correlation with photosynthetic parameters or direct effects and indirect effects on photosynthetic parameters. Moreover, these traits also had larger comprehensive scores in a comprehensive evaluation, which means that stomatal density was a key parameter in the regulation of photosynthesis of C. arabica.
-
Many leaf anatomical traits significantly affect photosynthetic parameters. This result provided holistic relationships between leaf anatomical traits and photosynthetic parameters in coffee. It is tempting to suggest that these relationships might, to some extent, explain the photosynthetic behavior of coffee (C. arabica L.). The relationships between leaf anatomical traits and photosynthetic parameters emphasize the importance of leaf anatomy in determining photosynthesis at the tissue level. Moreover, these correlations between leaf anatomical traits and photosynthetic parameters were useful to explore the impact of different anatomical features on photosynthetic efficiency and accordingly provide some information to design leaf anatomy for enhanced photosynthetic efficiency. To a certain extent, path analysis and comprehensive evaluation could indicate an interrelationship between photosynthetic capacity and leaf anatomical traits. However, the causal interrelationship between photosynthetic parameters and leaf anatomical traits is less clear. In addition, this study only analyzed the effect of anatomical structure on photosynthesis for one Catimor type of Arabica coffee. Effects on photosynthesis are typically genotype dependent, with some varieties being more tolerant to partial shading than others. Future studies should compare different Arabica coffee varieties for their anatomical traits and photosynthetic response to suitability in agroforestry-based production systems. Despite this, the result of the study also suggests that thinner leaves and higher stomatal densities might support a higher photosynthetic capacity. This result may be useful information for coffee breeding programs and plantation management.
-
The authors confirm contribution to the paper as follows: conceptualization and research design: Xiao Z, Ma G; project administration: Bai X, Li J; investigation and fieldwork: Zhao M, Su L; data analysis & manuscript preparation: Xiao Z; resources: Zhou H. All the authors read and edited the manuscript, and approved the final version.
-
The datasets generated and analyzed during the current study are available from the corresponding author on reasonable request.
This research was funded by the Coffee Industry Technology Delegation of Zhenkang County, Yunnan Province (202204BI090009), Basic Research Project of the Dehong Tropical Agriculture Research Institute of Yunnan (DTARI-JJ2020-02), and the Yunnan Dehong Integrated Experiment Station of the National Cassava Industry Technology System, Coffee Cloud Platform (CARS-11-YNLJH).
-
The authors declare that they have no conflict of interest.
-
# These authors contributed equally: Ziwei Xiao, Guanrun Ma
- Supplemental Table S1 Direct effects of each leaf anatomical traits through other traits on photosynthetic parameters.
- Supplemental Table S2 Indirect effects of each leaf anatomical traits through other traits on photosynthetic parameters.
- Copyright: © 2024 by the author(s). Published by Maximum Academic Press, Fayetteville, GA. This article is an open access article distributed under Creative Commons Attribution License (CC BY 4.0), visit https://creativecommons.org/licenses/by/4.0/.
-
About this article
Cite this article
Xiao Z, Ma G, Bai X, Li J, Zhao M, et al. 2024. The influence of leaf anatomical traits on photosynthesis in Catimor type Arabica coffee. Beverage Plant Research 4: e002 doi: 10.48130/bpr-0023-0035 

The influence of leaf anatomical traits on photosynthesis in Catimor type Arabica coffee
- Received: 15 September 2023
- Revised: 08 October 2023
- Accepted: 26 October 2023
- Published online: 02 January 2024
Abstract: Leaf photosynthesis is largely determined by anatomical features. This study aimed to reveal the quantitative effects of the anatomical structure of Coffea arabica leaves on photosynthesis. Pearson’s correlation and path analysis were used to explore the correlation between leaf structure and photosynthesis. To calculate the comprehensive evaluation value of the correlation between leaf anatomical traits and photosynthetic parameters, the Criteria Importance Through Intercriteria Correlation (CRITIC) method was used to obtain the objective weight of each photosynthetic parameter. The study revealed that leaf anatomical traits were highly significant (p <0.01) and correlated with photosynthetic parameters, suggesting that anatomical traits greatly influenced photosynthesis in C. arabica leaf. Similarly, path coefficient analysis strongly showed direct and indirect correlation of photosynthetic capacity of stomatal conductance of the leaves of C. arabica. The results of the comprehensive evaluation also indicated that leaf thickness (LT) and stomatal density (d) were the anatomical characteristics most closely related to photosynthesis. In these results, understanding the effects of the anatomical structure of coffee leaves on photosynthesis, may provide useful information for coffee breeding programs and the management of coffee plantations to optimize photosynthetic capacity.