


-
Kuding tea[1] tastes bitter and then sweet[2]; hawk tea[3] tastes mellow, astringent, and then sweet[4,5]; Cyclocarya paliurus has a sweet medicinal taste; and sweet tea has a sweet strong taste, which are rich in polysaccharides, triterpenes, flavonoids and other components[6−8], with hypoglycemic, hypolipidemic, and antioxidant effects[9,10], making it a tea substitute for long-term consumption[11,12]. Yang & Yang[13] found that Yuqing small-leaf kuding tea contained 8.96% flavonoids, 82.8% tea polysaccharides, 89.5 mmol/L total antioxidant power, 87.8% DPPH radical scavenging capacity, and 78.9% hydroxyl radical scavenging capacity. Zhang[14] found that hawk black tea had a better flavor quality and lower quantities of bitter and astringent flavonoids, polyphenols, flavonol glycosides, and other substances. Its taste profile went from sweet and mellow back to sweet. Wang et al.[15] compared the physicochemical composition of hawk tea from four counties in Guizhou (China). Kou[16] detected the flavonoid content of Guizhou Cyclocarya paliurus (9.39 ± 0.36 g) mg/g and the polysaccharide content was (15.25 ± 0.13e) mg/g. Teng et al.[17] found that the flavonoid content of steaming sweet tea was higher than that of cylinder type water-removing tea. It can be seen that only basic analyses of the active ingredients contained in the substitute teas are available, while there are still fewer studies on the differences in the taste qualities of kuding tea, hawk tea, Cyclocarya paliurus, and sweet tea.
Most of the kuding tea and hawk tea sold on the market are homemade by farmers, factories, or co-operatives and are processed in a crude manner, simply by frying or sun-drying, with a lack of precise control over quality changes during processing. This results in slightly bitter and astringent finished products and impure, strong, and irritating odors, with varying quality. Green tea has become one of the most popular beverages due to its strong and fresh taste. Molecular sensory science[18] and multi-omics techniques[19] have been used to gradually deepen and systematize the study of green tea taste characteristics, effectively contributing to the quality improvement and efficiency of green tea products. The same research methods used for green tea can be applied to evaluate the intrinsic factors that shape the taste characteristics of substitute teas such as kuding tea, hawk tea, Cyclocarya paliurus, and sweet tea, in order to improve the understanding of the taste quality of substitute teas.
Antioxidants are considered to be largely responsible for the anticancer effects of plant products[20]. Though the antioxidant effects of kuding tea[21,22], hawk tea[23,24], Cyclocarya paliurus[25], and sweet tea[26] have been reported, few studies have reported on the differences in their antioxidant properties. In this study, the tender leaves of kuding tea, hawk tea, Cyclocarya paliurus, and sweet tea were used as raw materials to produce tea substitutes, and their taste characteristics were evaluated by sensory evaluation and an electronic tongue (E-tongue). The metabolic substances such as the flavonoids and sugars of these four substitute teas were quantified based on GC-MS/MS. The aim was to provide a theoretical reference for the scientific evaluation of the taste quality and antioxidant efficacy of the four substitute teas.
-
The raw materials (one bud and two leaves) of small-leaf kuding tea (KD), hawk tea (LY), Cyclocarya paliurus (QQ), sweet tea (TC), and green tea (LC) were harvested from 15 to 22 April 2021 at the base resource nursery of the Tea Research Institute of Meitan County, Guizhou Province (China), and processed into dry tea by spreading for 12 to 14 h, drum killing (temperature controlled at 300 °C), rapid cooling, kneading (light kneading for 25 min), drying (110 °C for 20 min to 70% dry in the drying machine, and then 80 °C for 1.5 h to full dry) into dried tea. Each sample was collected in three portions of 250 g each, of which 100 g was refrigerated for assessment and E-tongue testing. The other sample was freeze-dried, ground into powder (30 Hz, 1.5 min), and stored at −80 °C until needed. Sensory description of the taste of substitute tea with reference to GBT 23776-2018 National Standard for Tea Sensory Review Methods.
Experimental reagents
-
The following reagents were used: HPLC-grade acetonitrile (ACN) and methanol (MeOH) were purchased from Merck (Darmstadt, Germany). Formic acid was purchased from Sigma-Aldrich (Shanghai, China). All the standards were purchased from MCE (MedChemExpress, China); the stock solutions of standards were prepared at a concentration of 2 mg/mL in MeOH. All stock solutions were stored at −20 °C and were diluted with MeOH to working solutions before analysis. Bistrifluoroacetamide (BSTFA) (with 1% TMCS) 99% was purchased from Aladdin (Shanghai, China); methoxamine salt 99% and pyridine 99% were purchased from Sigma-Aldrich (Shanghai, China). 2,2′-azino-bis-(3-ethylbenzothiazoline-6-sulphonic acid) diammonium salt (ABTS) and 1,1-diphenyl-2-picrylhydrazyl (DPPH) were purchased from Missouri State Chemical Co (Shanghai, China).
Experimental methods
Sample preparation
-
Manual sensory and E-tongue preparation: 3 g of tea samples were weighed and brewed in 150 mL of boiling water for 4 min and then used for manual sensory and E-tongue testing.
Quantitative flavonoid sample preparation: 20 mg of powder was weighed and extracted with 0.5 mL 70% methanol. Internal standard (10 μL, 4,000 nmol/L) was added into the extract as an internal standard (IS) for quantitation. The extract was sonicated for 30 min and centrifuged at 12,000 g and 4 °C for 5 min. The supernatant was filtered through a 0.22 μm membrane filter for further LC-MS/MS analysis.
Quantitative sugar sample preparation: 20 mg of powder was added to 500 μL of methanol: isopropanol: water (3:3:2 V/V/V), vortexed for 3 min, and ultrasonically extracted for 30 min. The extract was centrifuged at 14,000 rpm under 4 °C for 3 min. Fifty microliters of the supernatant was combined with 20 μL internal standard (ribitol, 1,000 μg/mL) and evaporated under nitrogen gas stream. The evaporated sample was transferred to the lyophilizer for freeze-drying. The residue was used for further derivatization. The derivatization method was as follows: the sample was mixed with 100 μL solution of methoxyamine hydrochloride in pyridine (15 mg/mL) and then incubated at 37 °C for 2 h. Then, 100 μL of BSTFA was added into the mixture and kept at 37 °C for 30 min after vortex-mixing. The mixture was analyzed by gas chromatography-mass spectrometry (GC-MS) after diluting to an appropriate concentration[24].
Antioxidant sample preparation: 2 g (to 0.001 g) of the dried, ground sample was weighed into a 500 mL conical flask, to which 300 mL of boiling distilled water was added. The mixture was transferred immediately to a boiling water bath and extracted for 45 min (shaking at 10 min intervals). Immediately after the extraction, it was filtered under pressure while still hot, and the filtrate was set to 500 mL.
Activation of the E-tongue taste sensor and reference electrode
-
SA-402B E-tongue (Insent, Japan), The taste sensor reference solution (30 mmoL/L KCl + 0.3 mmoL/L tartaric acid) and internal solution (3.3 mmoL/L KCl + saturated silver chloride) were prepared with ultrapure water. Two-hundred microliters of internal solution were added to the taste sensor probe, the taste sensor was placed in a beaker with the reference solution, and the mouth of the beaker was sealed with cling film and activated at 25 °C for 24 h for use. Two-hundred microliters of the internal solution of the reference electrode (3.3 mmoL/L KCl + saturated silver chloride) were added to the reference electrode probe until the liquid level was about 5 mm from the top of the glass tube, and the reference electrode was placed in a beaker with 3.3 mmoL/L KCl solution. The liquid level was about 15 mm from the electrode head, and the mouth of the beaker was sealed with cling film and maintained at 25 °C for 24 h until use.
E-tongue data acquisition
-
The sensors were first stabilized in an immersion solution for 90 s for preliminary cleaning to remove impurities on the membrane surface, with an anionic immersion solution (0.1 mmoL/L HCl + 300 mL anhydrous ethanol) used for fresh, salty, and acid sensors and a cationic immersion solution (0.1 mmoL/L KCl + 10 mmoL/L KOH + 300 mL anhydrous ethanol) used for sweet and bitter sensors. Each sensor was then washed in the reference solution for 2 min, which can be used to determine the E-tongue score of the samples.
The E-tongue potential value conversion is V = Vs − Vr, where V is the potential difference output value, or the E-tongue score; Vs is the sensor in the sample solution for a 30 s stable measured potential value; and Vr is the sensor in the reference solution for a 30 s stable measured potential value.
Quantitative detection of flavonoids and sugars
-
Quantitative flavonoids UPLC conditions and quantitative flavonoids ESI-MS/MS conditions reference Deng et al.[27].
-
The quantitative detection of sugars GC-MS is as follows. Agilent 8890 gas chromatograph coupled to a 5977B mass spectrometer with a DB-5MS column (30 m length × 0.25 mm i.d. × 0.25 μm film thickness, J & W Scientific, USA) was employed for GC-MS analysis of sugars. Helium was used as carrier gas, at a flow rate of 1 mL/min. Injections were made in the split mode with a split ratio 5:1 and the intection volume was 1 μL. The oven temperature was held at 170 °C for 2 min, and then raised to 240 °C at 10 °C/min , raised to 280 °C at 5 °C/min , raised to 310 °C at 25 °C/min and held at the temperature for 4 min. All samples were analyzed in selective ion monitoring mode. The ion source and transfer line temperature were 230 and 240 °C, respectively[28−30].
Oxidation resistance test
-
Scavenging DPPH-capacity assay referring to the method of Yang et al.[20] and Wang[32]with slight modification, 100 μmol/L DPPH ethanol solution was prepared as follows: 0.004 g of DPPH was dissolved in 100 mL of anhydrous ethanol and stored away from light. The tea broth was prepared into sample solutions with concentrations of 31.25, 62.5, 125, 250, 500, and 1,000 μg/mL. Two-hundred microliters of sample solution was extracted in a test tube, to which 5.0 mL of DPPH ethanol solution (prepared in anhydrous ethanol) was added, mixed well, and left to stand for 30 min at room temperature in the dark. The absorbance, A1, was measured at a wavelength of 518 nm with 200 μL of water mixed with 5.0 mL of anhydrous ethanol adjusted to zero. The absorbance A0 was measured with 200 μL of water instead of the extract solution mixed with 5.0 mL of DPPH solution, and the absorbance A2 was measured with 200 μL of the sample solution mixed with 5.0 mL of anhydrous ethanol to eliminate the effect of the extract solution itself. The DPPH-clearance of different concentrations of tea extracts was calculated according to the following equation: the linear regression equation of tea concentration and DPPH-clearance was derived, and then the IC50 of DPPH-clearance by tea was calculated.
DPPH-clearance (%) = [1 − (A1 − A2) / A0] × 100
Determination of ABTS radical scavenging rate referring to the method of Wang[32], Liu et al.[33] and Bao et al.[34] with slight modification, 7 mmol/L ABTS solution and 2.45 mmol/L potassium persulfate solution were first mixed in equal volumes and reacted at room temperature for 12−16 h away from light, and then the mixture was diluted with deionized water to a dilution and the absorbance value adjusted to 0.700 ± 0.020 at 734 nm.
The tea broth was prepared into sample solutions at concentrations of 15.625, 31.25, 62.5, 125, 250, and 500 μg/mL. The absorbance was measured at 734 nm and recorded as B1. One-hundred microliters of deionized water were mixed with 3 mL of ABTS working solution and the absorbance was measured as B0 under the same conditions. One-hundred microliters of tea broth were mixed with 3 mL of deionized water and the absorbance was measured as B2 under the same conditions. The ABTS cation radical scavenging rate was calculated as shown in Equation (2); the linear regression equation between tea concentration and ABTS scavenging rate was derived, and then the IC50 value of ABTS scavenging by tea was calculated.
ABTS radical scavenging rate (%) = 1 − (B1 − B2) / B0 × 100%
Data processing
-
Based on the self-built database (MWDB) and the public database of metabolite information of Maiwei (Wuhan) Biotechnology Co., the substances were characterized based on the secondary spectrum information. The substances were scanned by multiple reaction monitoring mode (MRM) using five parameters of substance detection, namely declustering voltage (DP), collision energy (CE), retention time (RT), parent ion molecular weight (Q1), and characteristic fragment ion molecular weight (Q3) to detect the relative content of substances in different samples and to obtain the qualitative and quantitative data of the substances[35]. The metabolite mass spectra of different samples were obtained and the peak areas of the mass spectral peaks of all substances were integrated, in which the mass spectra of the same metabolite in different samples were corrected for peak integration[36]. For kuding tea (KD), hawk tea (LY), Cyclocarya paliurus (QQ), and sweet tea (TC), two comparisons were performed with green tea (LC) as the control and were recorded as LC vs KD, LC vs LY, LC vs QQ, and LC vs TC, respectively. Multivariate statistical analysis was used to perform principal component analysis (PCA) and orthogonal bias analysis (OBA) on the four groups of test samples. PCA, orthogonal partial least squares discriminant analysis (OPLS-DA), and cluster analysis (HCA) were used to initially investigate the metabolic characteristics of the flavonoids and sugars of the different tea substitutes. Differential metabolites between groups were screened based on variable importance in the projection (VIP) values ≥ 1, fold change values (FC) ≥ 2 or ≤ 0.5, and p < 0.05 for t-test obtained from the OPLS-DA model[37]. Graphs were produced using Origin pro2021 software, which was developed by Origin Lab Inc (Massachusetts, USA).
-
As shown in Table 1, KD tasted bitter, sweet, and had a sweet aftertaste; LY was sweet and mellow with a camphoraceous taste; QQ had a sweet, astringent, and medicinal taste; and TC tasted sweet, slightly astringent, and calm; and only LC had a prominent umami flavor in the sensory evaluation.
Table 1. Results of the sensory review of the taste of the four substitute teas
Sample Taste KD Bitter, sweeter, with a sweet aftertaste TC Sweet, slightly bitter, calm LY Sweet and mellow, with a camphoraceous flavor LC Fresh and mellow QQ Sweet, astringent and medicinal flavors As indicated in Fig. 1, with LC as the control, the sweetness of the four substitute teas was more prominent in the E-tongue test, and the KD and TC in particular had the highest E-tongue test values, followed by LY and QQ, which had higher E-tongue sweetness test values than LC. TC, LY, and QQ had slightly higher E-tongue bitterness values than LC , and KD, QQ, and TC had slightly higher astringency values than LC. The umami of the LC was much higher than that of the four substitute teas. Overall, the manual sensory and E-tongue test results for the four substitute teas were relatively consistent, with all tastes being sweet and bitter and astringent. The taste of the tea broth represents a combination of all the taste attributes in the tea broth. The bitterness and astringency values of LC were slightly lower than those of the TC and the QQ in this E-tongue test, mainly because the umami value of the LC was too high, which inhibited the bitterness and astringency of the tea brewed[38].
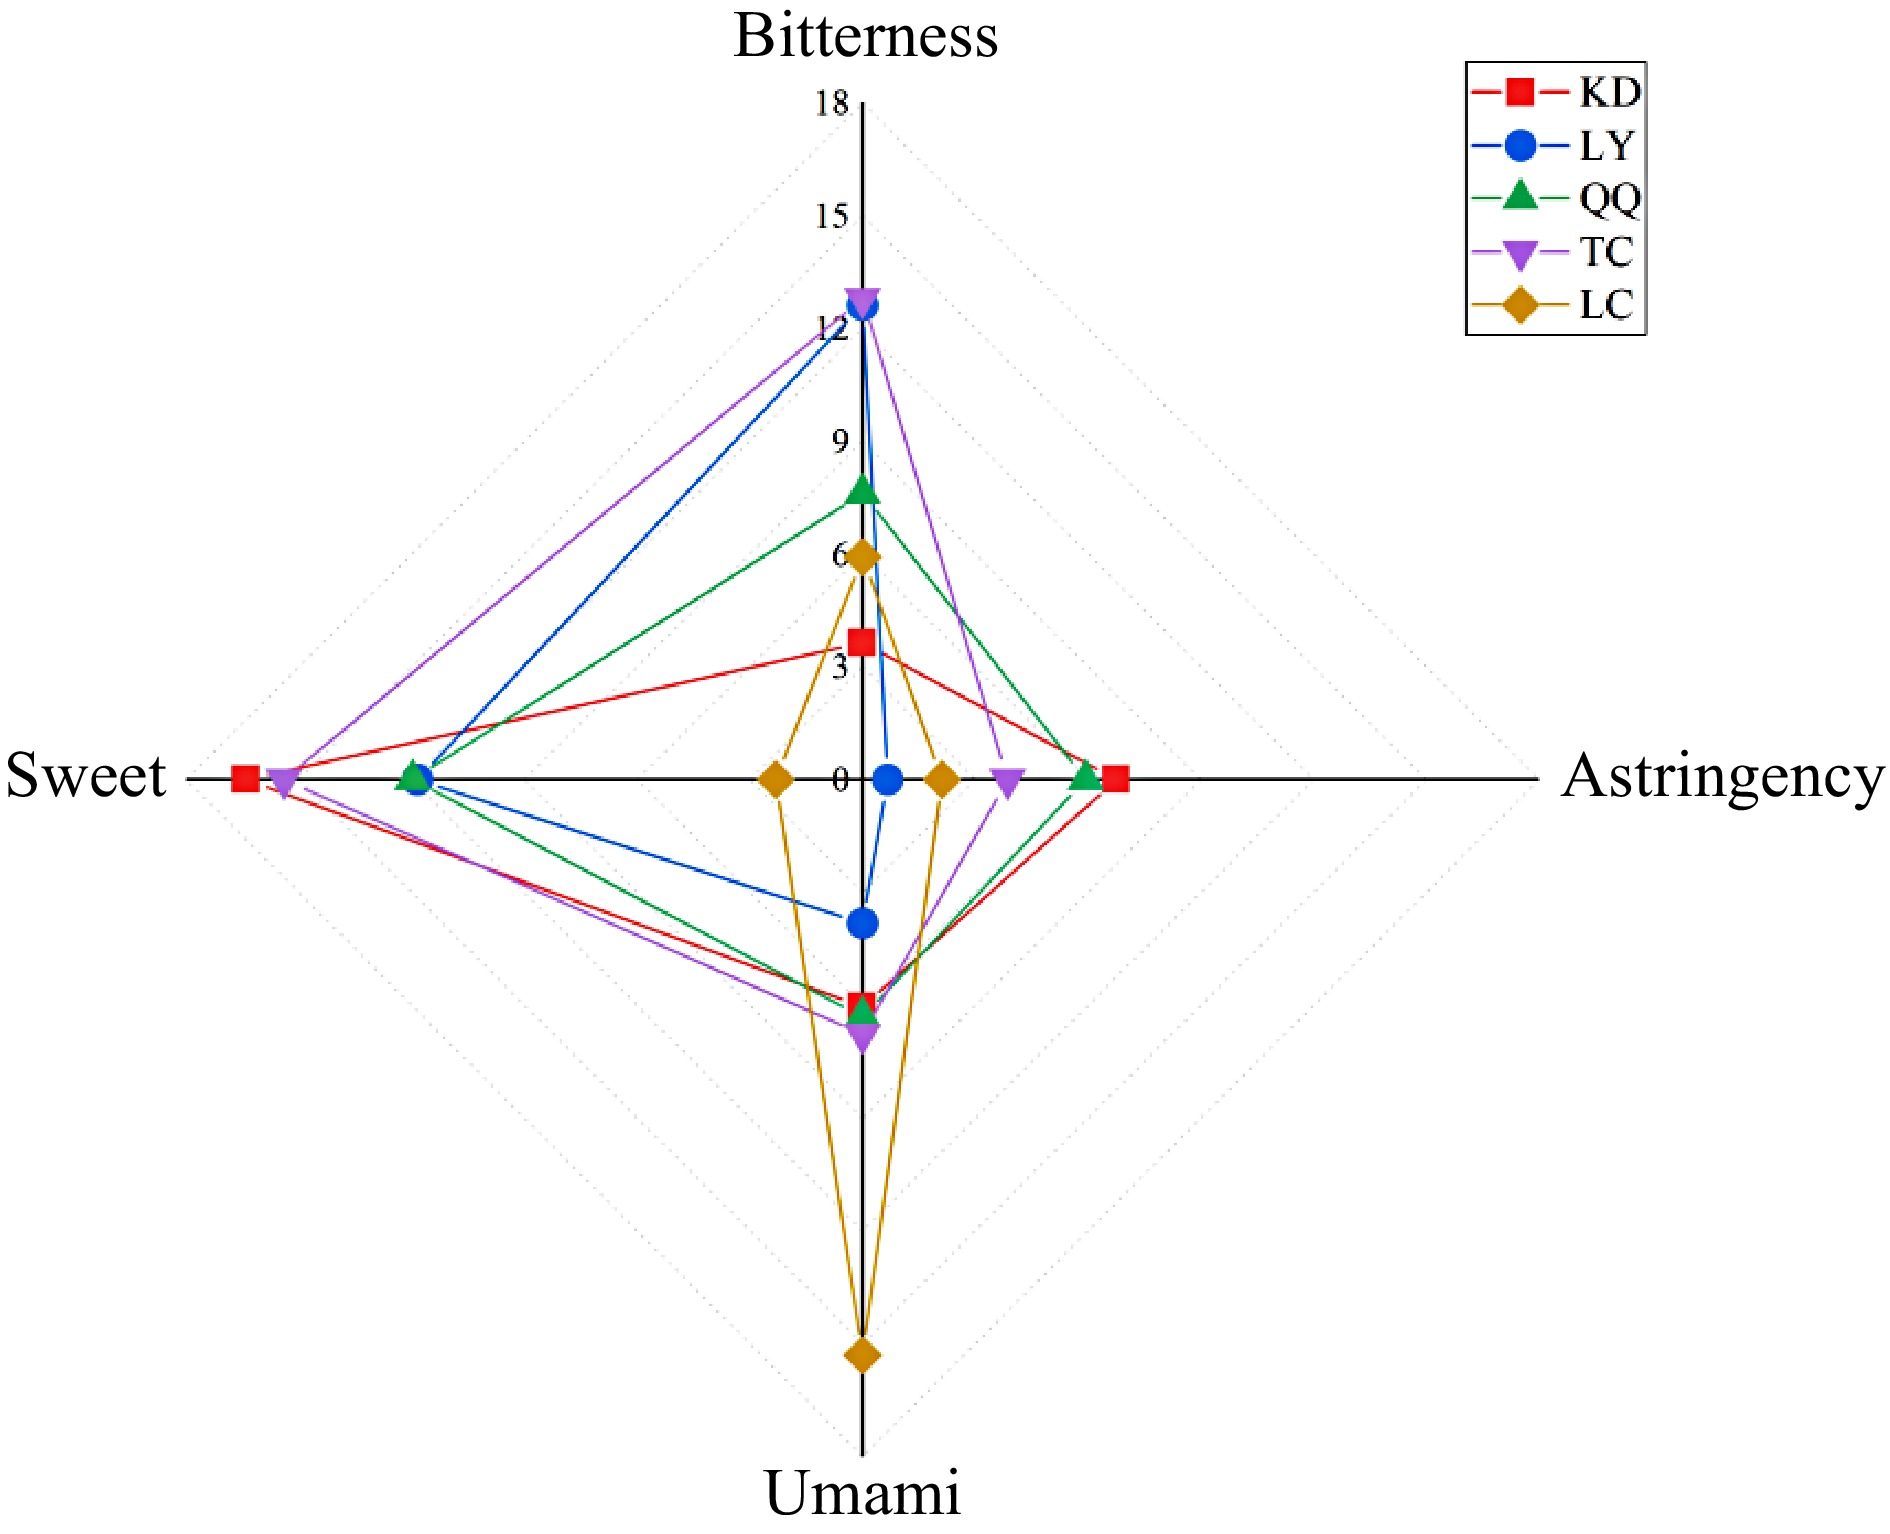
Figure 1.
E-tongue radar map of the four substitute teas.
Identification of flavonoids and sugars in the four substitute teas
-
The flavonoid metabolites of the four substitute teas were quantified by LC-MS/MS, and a total of 136 flavonoid metabolites in 12 categories were identified, including 37 flavones, 29 flavonols, 13 flavanones,13 isoflavanones, 12 chalcones, eight flavanonols, seven flavanols, five flavone glycosides, five phenolic acids, two xanthones, one anthocyanin, one biflavonoid and fourothers, with flavones and flavonols being the most dominant, followed by chalcones, flavanonols, and isoflavanones.
From Table 2, the total flavonoid content of TC was much higher than that of the other substitutes tea at (11,512.93 ± 0.14c) nmol/g, followed by LY with a high total flavonoid content of (1,885.37 ± 0.28a) nmol/g, and KD and QQ with comparable total flavonoid contents of (893.82 ± 0.12c) and (887.16 ± 0.35d) nmol/g. The total flavonoids of all four substitute teas were lower than those of LC. TC was dominated by flavonols, flavanols, chalcones, flavanonols, and anthocyanins, all of which were much higher than in the other three substitutes tea (7,402.47 ± 136.25b), (1,036.37 ± 59.53b), and (2,763.33 ± 133.39a) nmol/g, respectively. Both LY and QQ were dominated by flavonols, with contents of (1,766.96 ± 79.16b) and (787.8 ± 36.16c) nmol/g, respectively. Further, flavanols were more abundant in the LY and QQ, with contents of (49.83 ± 3.02c) nmol/g, respectively. Flavonoids and flavonols were predominant in the KD, with contents of (394.85 ± 13.13a) and (380.02 ± 9.97d) nmol/g, respectively, and the flavonoids were higher than in the other tea substitutes. Flavanols and flavanonols were the next highest in KD, with contents of (35.79 ± 1.42c) and (54.05 ± 2.81b) nmol/g, respectively.
Table 2. Statistical results of the flavonoid content of the four substitute teas. Unit: nmol/g.
KD LY QQ TC LC Anthocyanins 3.13 ± 0.49c 6.46 ± 0.78c 2.59 ± 0.27c 1036.37 ± 59.53b 3238.45 ± 82.64a Biflavonoids 0.12 ± 0.06a − − − − Chalcones 0.85 ± 0.05b 11.9 ± 0.09b 1.4 ± 0.01b 97.18 ± 12.72a 9.03 ± 0.56b Flavanols 35.79 ± 1.42c 49.83 ± 3.02c 55.34 ± 2.22c 7402.47 ± 136.25b 19411.19 ± 365.66a Flavanones 54.05 ± 2.81b 12.04 ± 0.03d 5.13 ± 0.13e 68.9 ± 2.16a 37.93 ± 3.36c Flavanonols 3.73 ± 0.12c 15.27 ± 0.46b 1.78 ± 0.04c 16.35 ± 0.71b 95.21 ± 4.36a Flavone glycosides 2.48 ± 0.09b 1.18 ± 0.02d 1.82 ± 0.04c 0.9 ± 0.04d 6.03 ± 0.55a Flavones 394.85 ± 13.13a 7.74 ± 0.28d 19.74 ± 0.93c 82.95 ± 3.44b 26.5 ± 1.39c Flavonols 380.02 ± 9.97d 1766.96 ± 79.16b 787.8 ± 36.16c 2763.33 ±1 33.39a 423.6 ± 34.27d Isoflavanones 0.65 ± 0.09c 0.14 ± 0.01e 0.3 ± 0.05d 1.04 ± 0.09b 1.37 ± 0.08a Phenolic acids 8.66 ± 0.22a 2.06 ± 0.16c 3.2 ± 0.16b 3.32 ± 1.14b − Xanthones − 0.22 ± 0.02b − 0.07 ± 0.01c 0.59 ± 0.02a Others 9.49 ± 1.07b 11.57 ± 5.05b 8.06 ± 3.14b 40.05 ± 9.08b 1707.99 ± 202.53a Total 893.82 ± 0.12c 1885.37 ± 0.28a 887.16 ± 0.35d 11512.93 ± 0.14c 24957 ± 0.28a.89 N indicates biological sample size; data are mean ± standard deviation; peer data followed by different letters indicate significant differences (p < 0.05), and those with the same letter indicate non-significant differences (p > 0.05). In addition, biflavonoids were only detected in KD; phenolic acids were detected in KD, LY, QQ, and TC; and xanthones were only detected in LY and TC. In the clustering heat map (Fig. 2a), there were obvious grouping patterns of flavonoid metabolites in each tea sample, and the aggregation differences were large. All teas clustered individually, indicating that the four substitute teas had different flavonoid metabolite characteristics. Overall, the TC and LY had a higher flavonoid content, which is consistent with the bitterness values of the TC and LY being slightly greater than those of the KD and QQ in the E-tongue test.
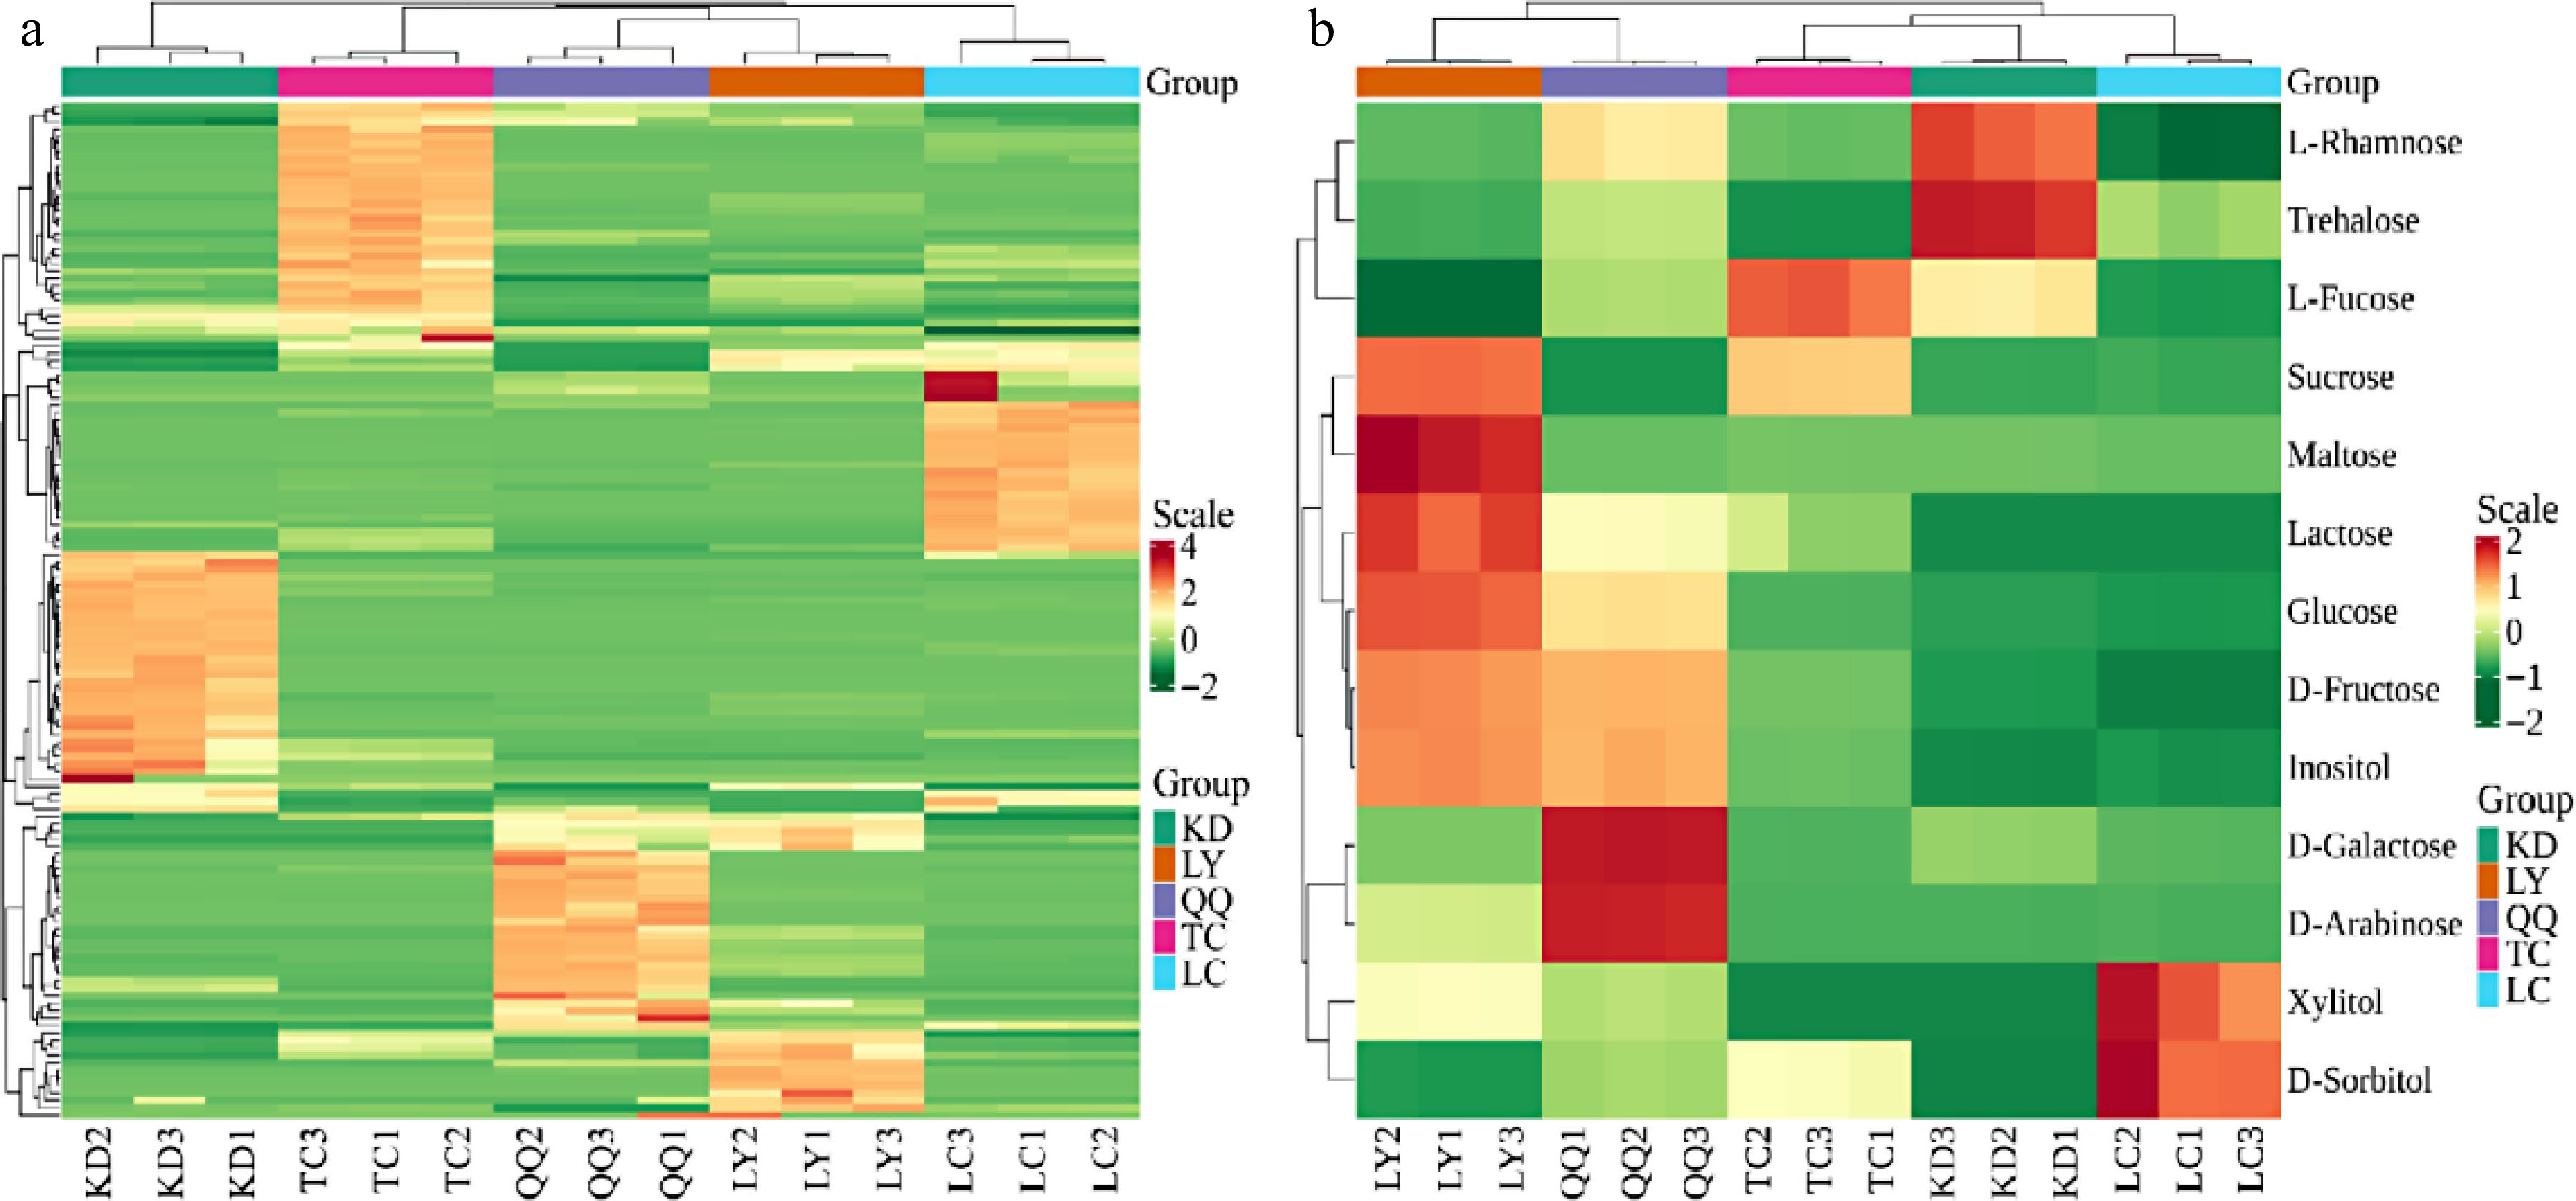
Figure 2.
Heat map of (a) flavonoid metabolite and (b) sugar metabolite contents of the four substitute teas.
The separation of sugars in the different substitute tea samples was achieved using GC-MS/MS, as shown in Table 3. Twelve sugars belonging to two types were detected, including four disaccharides, namely sucrose, alginose, maltose, and lactose; and eight monosaccharides, namely D-arabinose, L-rhamnose, L-fucose, D-fructose, D-galactose, glucose, D-sorbitol, and xylitol. Among the four substitute teas, total sugars were highest in LY at (114.4 ± 0.09b) mg/g and were at comparable levels in QQ and TC at (34.71 ± 0.12c) and (36.94 ± 0.52a) mg/g, respectively, and at lower levels in KD and LC at (5.27 ± 0.14a) and (3.34 ± 2.12c) mg/g, respectively.
Table 3. Statistical results of the sugar content of the four substitute teas. Unit: mg/g.
Class Compounds RT KD LY QQ TC LC Disaccharide Sucrose 13.053 2.55 ± 0.06c 39.24 ± 0.36a 0.03 ± 0d 30.19 ± 0.27b 2.77 ± 0.44c Trehalose 14.342 0.1 ± 0a 0.01 ± 0d 0.03 ± 0b − 0.03 ± 0c Maltose 14.264 0.01 ± 0b 0.39 ± 0.02a − 0.01 ± 0b − Lactose 13.662 − 0.02 ± 0a 0.01 ± 0b 0.01 ± 0c − Total disaccharide 2.66 ± 0.07c 39.66 ± 0.38a 0.08 ± 0d 30.21 ± 0.27b 2.8 ± 0.45c Monosaccharide D-Arabinose 3.965 0.01 ± 0c 0.09 ± 0b 0.29 ± 0a 0.01 ± 0c 0.01 ± 0c D-Fructose 5.758 1.15 ± 0.02d 13.18 ± 0.32a 11.98 ± 0.05b 3.33 ± 0.04c 0.1 ± 0.01e D-Galactose 5.937 0.13 ± 0.01b 0.1 ± 0c 0.97 ± 0.01a 0.01 ± 0e 0.03 ± 0.01d Glucose 5.991 1.19 ± 0.02d 31.34 ± 0.74a 21.31 ± 0.15b 3.23 ± 0.05c 0.34 ± 0.04e L-Rhamnose 4.424 0.05 ± 0a 0.03 ± 0c 0.04 ± 0b 0.03 ± 0c 0.02 ± 0d D-Sorbitol 6.361 − − − 0.01 ± 0b 0.01 ± 0a L-Fucose 4.634 0.07 ± 0b − 0.04 ± 0c 0.11 ± 0a 0.01 ± 0d Xylitol 4.318 − − − − 0.01 ± 0a Total monosaccharide 2.61 ± 0.06d 44.74 ± 1.12a 34.63 ± 0.29b 6.73 ± 0.12c 0.54 ± 0.13e Other Inositol 7.772 0.5 ± 0.01e 4.82 ± 0.06a 4.46 ± 0.09b 1.38 ± 0.02c 0.62 ± 0.07d Total sugar 5.27 ± 0.14a 114.4 ± 0.09b 34.71 ± 0.12c 36.94 ± 0.52a 3.34 ± 2.12c Data are mean ± standard deviation. Peer data followed by different letters indicate significant differences (p < 0.05), and those with the same letter indicate non-significant differences (p > 0.05). Total sugar content does not include inositol. The heatmap (Fig. 2b) of the four substitute teas showed that LY contained more different sugar metabolites than the other tea substitutes, mainly sucrose, maltose, and lactose (disaccharides) and glucose and fructose (monosaccharides). QQ was second, containing mainly galactose and arabinose. KD mainly differed in containing more trehalose and rhamnose, while TC contained more fructose. The tea samples all clustered into a single category. Overall, the sugar content of all four substitute teas was higher than that of LC, which was consistent with the higher sweetness value of all four substitute teas compared to LC in the E-tongue test results. Among the four substitute teas, the KD and TC had lower sugar contents than LY and QQ, but their sweetness values were higher than those of LY and QQ in the E-tongue test. This may be due to the different thresholds of sweet substances and the combined taste of other substances in the tea broth.
Screening of four substitute teas flavonoids and sugar differential metabolites
-
Using LC as the control, the four groups were recorded as LC vs KD, LC vs LY, LC vs QQ, and LC vs TC, and the differences in flavonoid and sugar metabolites of the four substitute teas were analyzed by OPLS-DA. According to Table 4, the evaluation parameters of the OPLS-DA model for flavonoid and sugar metabolites in each group were all greater than 0.5 and Q2 > 0.9, indicating that the model was well constructed and the predictive ability was reliable. Following the PLS-DA analysis, significant differential metabolites were screened. From Table 5, among the flavonoids, a total of 80 differential metabolites were screened in LC vs KD, of which 41 were up-regulated, accounting for 51.25%, mainly flavonoids. Thirty-nine were down-regulated, mainly flavonols. Eighty-five differential metabolites were screened in LC vs LY, of which 48 were up-regulated, accounting for 56.47%, which were mainly flavonoids and flavonols. There were 37 down-regulated metabolites, mainly flavonoids and flavonols. There were 85 different metabolites screened in LC vs QQ, of which 38 were up-regulated, mainly flavonoids and flavonols, and of which 47 were down-regulated, accounting for 55.29%, mainly chalcones, flavanols, flavonoids, and flavonols. Seventy-seven different metabolites were screened in LC vs TC. Among them, 44 were up-regulated, accounting for 57.14%, mainly flavonoids and flavonols, and 33 were down-regulated.
Table 4. Parameters for PLS analysis of the four substitute teas flavonoids and sugars.
Sample Flavonoids Sugars R2X R2Y Q2 R2X R2Y Q2 LC vs. KD 0.949 1 1 0.926 1 0.999 LC vs. LY 0.942 1 0.998 0.934 1 1 LC vs. QQ 0.946 1 1 0.906 1 0.997 LC vs. TC 0.973 1 1 0.937 1 1 Table 5. Statistical results of the different flavonoid and sugar metabolites of the four substitute teas.
LC vs KD LC vs LY LC vs QQ LC vs TC Up Down Up Down Up Down Up Down Anthocyanins 1 1 1 1 Biflavonoids 1 1 - 1 Chalcones 2 5 3 3 3 6 7 2 Flavanols 6 6 6 3 4 Flavanones 4 3 3 2 5 4 2 4 Flavanonols 2 3 2 4 1 5 1 3 Flavone glycosides 1 2 3 3 4 Flavones 15 5 15 9 14 8 12 5 Flavonols 7 10 18 5 8 9 15 6 Isoflavanones 6 2 3 3 3 3 2 2 Phenonic acids 3 3 4 1 Xanthones 2 1 2 2 Total flavonoids 41 39 48 37 38 47 44 33 Disaccharide 2 3 1 1 1 3 1 Monosaccharide 5 2 4 2 6 2 3 2 Inositol 1 1 1 Total sugar 7 2 9 3 8 3 7 3 Among the sugars, nine different metabolites were screened in LC vs KD, of which seven were up-regulated and two were down-regulated. Twelve different metabolites were screened in LC vs LY, of which nine were up-regulated and three were down-regulated. Eleven different metabolites were screened in LC vs QQ, of which eight were up-regulated and three were down-regulated; and 10 different metabolites were screened in LC vs TC, of which seven were up-regulated and three were down-regulated. All groups were dominated by the up-regulation of sucrose, glucose, and fructose, which accounted for more than 66.67% of the total.
In the Venn diagram (Fig. 3a), there were nine differential metabolites specific to LC vs KD, namely troxerutin and silychristin (flavanonols), spinosin (flavonoid glycoside), apigenin-7-for (flavone), typhaneoside (flavonol), calycosin, 2'-hydroxy-daidzein, and demethyltexasin (isoflavanone), and kavain (phenolic acid).
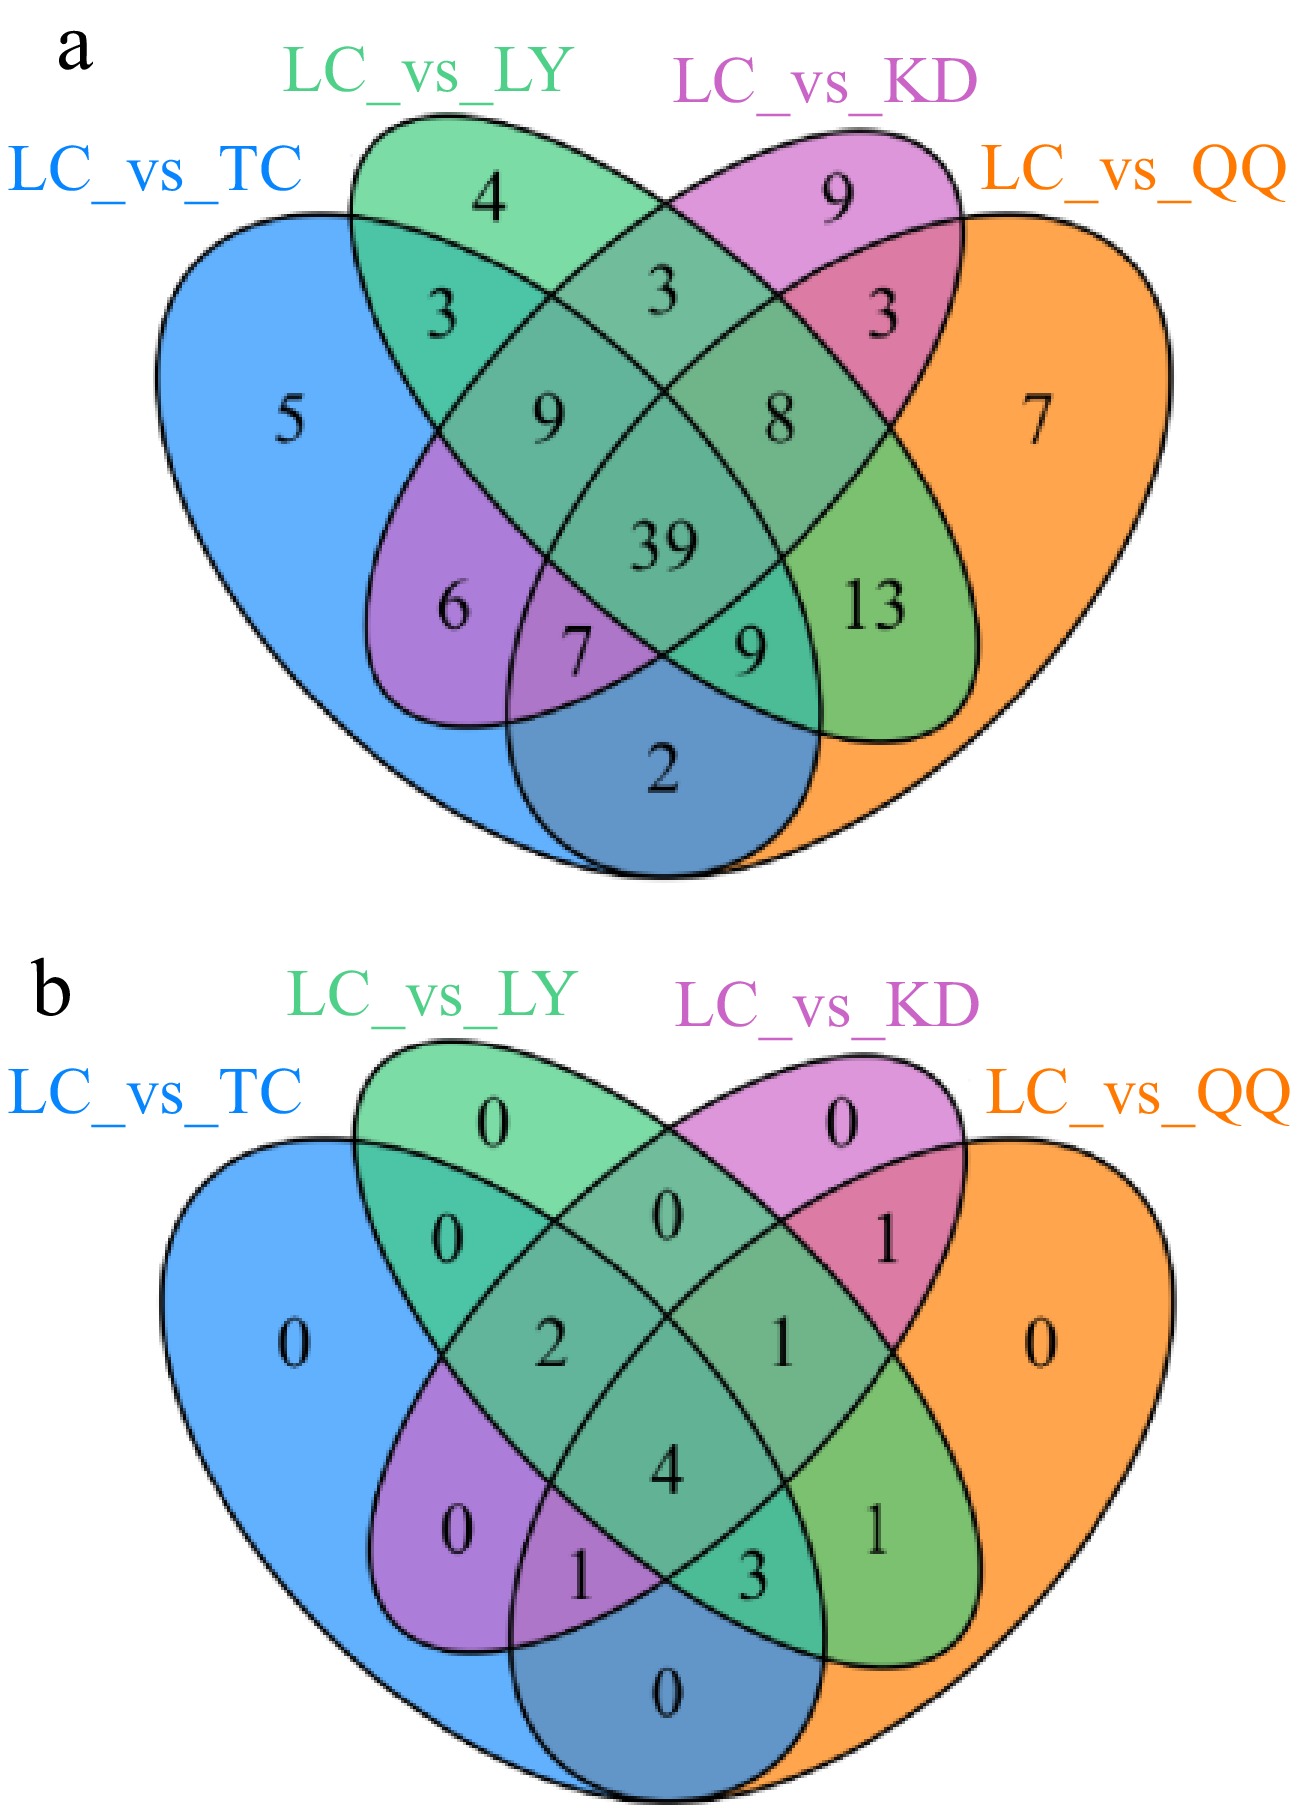
Figure 3.
Venn diagram of the differential metabolites of the (a) four substitute tea flavonoids and (b) sugars.
LC vs LY had four specific differential metabolites, including silibinin (flavanonol), limocitrin and genkwanin (flavonoids), and sagittatoside A (flavonol). In general, the specific differential metabolites were up-regulated in all groups.
There were seven different metabolites specific to LC vs QQ, namely benzylideneacetophenone (chalcone), isosakuranin and liquiritin (flavanones), tricin and scutellarein (flavones), corylin (isoflavanone), and 7-hydroxy-4H-chromen-4-one (phenolic acid).
LC vs TC had five specific differential metabolites, including neohesperidin dihydrochalcone (chalcone), afzelechin (flavanol), sophoraflavanone G (flavanone), baicalin (flavonoid), and isorhamnetin (flavonol). The specific differential metabolites were up-regulated in all groups, indicating that these differential metabolites were higher in all four substitute teas than in LC.
From Fig. 3b, there were no specific differential metabolites in the four groups and there were four shared differential metabolites, all of which were monosaccharides. Fructose and glucose were up-regulated in all groups, fructose. was only down-regulated in LC vs LY and up-regulated in the rest, and galactose. was only down-regulated in LC vs TC and up-regulated in the rest.
Comparative analysis of the antioxidative activity of the four substitute teas
-
In the selected range (250 to 1,000 μg/mL), the scavenging ability of the four substitute teas for DPPH and ABTS radicals increased with increasing concentration (Fig. 4), the scavenging ability of the four substitute teas for DPPH and ABTS radicals was in the following order: TC > KD > LY > QQ.
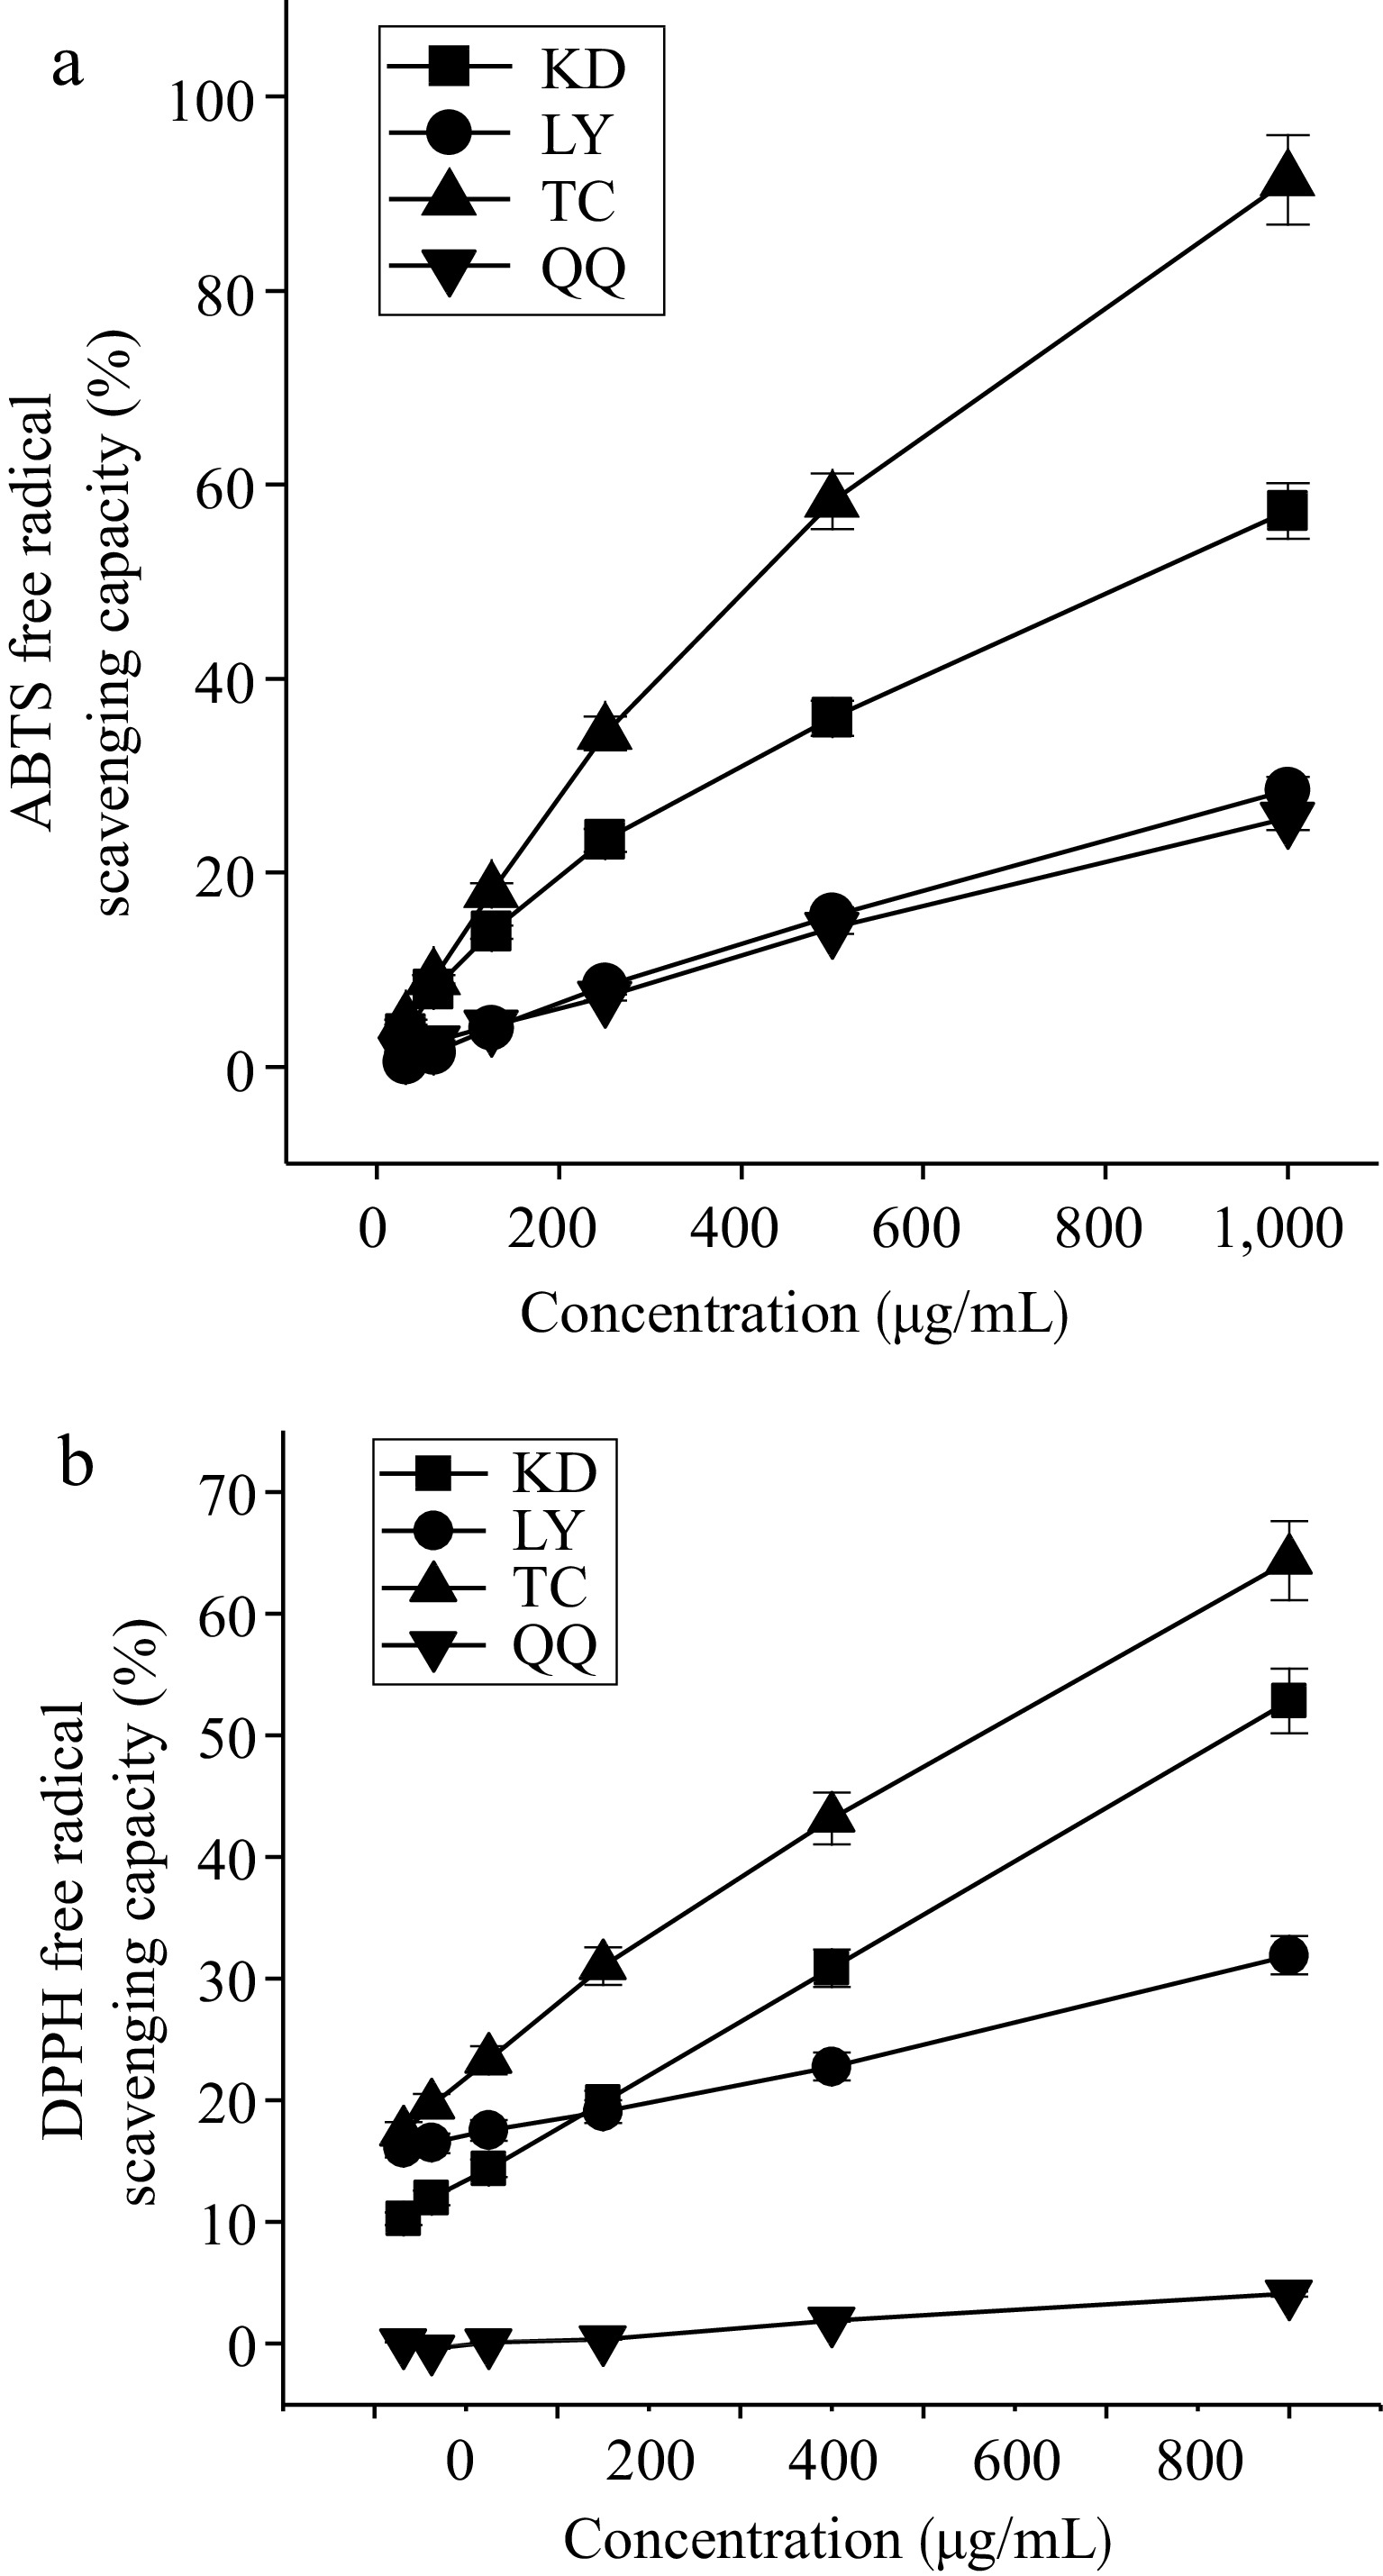
Figure 4.
Scavenging capacity of the four substitute teas for (a) ABTS radicals and (b) DPPH radicals.
As shown in Table 6, the total flavonoid content of the four substitute teas showed a significant positive correlation with the scavenging ability of DPPH and ABTS radicals, and the total sugar content showed a negative correlation with the scavenging ability of DPPH radicals and a highly significant negative correlation with the scavenging ability of ABTS radicals. Among the four substitute teas, TC had the highest total flavonoid content and the strongest scavenging ability for DPPH and ABTS radicals. The total flavonoid content of LY was higher than that of KD, but the scavenging ability for DPPH and ABTS radicals was higher than that of LC. This is because the total sugar content of LY was higher than that of KD, and flavonoids are easily combined with sugars, especially glucose, rhamnose, and glucuronide, which are often used as glycosidic ligands for flavonoids[38,39]. The total flavonoid content of QQ was comparable to that of KD, while the total sugar content was slightly higher than that of KD, rendering the scavenging ability of DPPH and ABTS free radicals weaker than that of KD for the same reason. To further investigate the correlation between flavonoids and antioxidant properties of the four substitute teas. Twenty flavonoids were found to be positively correlated with antioxidant properties by correlation network plots (r ≥ 0.8, p < 0.0001), of which 15 were positively associated with clearing ABTS radicals and five were positively associated with clearing DPPH radicals (Fig. 5);procyanidin B2, (−)-gallocatechin, (−)-epigallocatechin, (−)-gallocatechin gallate, (−)-catechin gallate, astragalin, tiliroside, naringenin-7-glucoside, and taxifolin were the most predominant, and all of them were found in the highest levels in TC (Fig. 6). Among them, procyanidin B2 amounted to 1,036.37 ± 59.53 nmol/g in TC, followed by astragalin and tiliroside with 626.32 ± 55.22 and 318.72 ± 5.20 nmol/g, respectively. (−)-Gallocatechin, (−)-gallocatechin gallate, astragalin, naringenin-7-glucoside, and taxifolin, were slightly higher in LY than in KD and QQ, in addition to being higher in TC. (−)-Epigallocatechin, (−)-catechin gallate and tiliroside, were slightly higher in KD than in LY and QQ, in addition to their higher contents in TC. These differences in flavonoid content are important reasons for the different antioxidant properties of the four substitute teas.
Table 6. Correlation analysis between taste substances and antioxidant properties.
Pearson correlation Total flavone Total sugar Total DPPG clearance Total ABTS clearance Total flavone 1 −0.461 0.103 0.626* Total sugar 1 −0.286 −0.645** Total DPPG clearance 1 0.793** Total ABTS clearance 1 * Correlation is significant at the 0.05 level (2-tailed).** Correlation is significant at the 0.01 level (2-tailed). 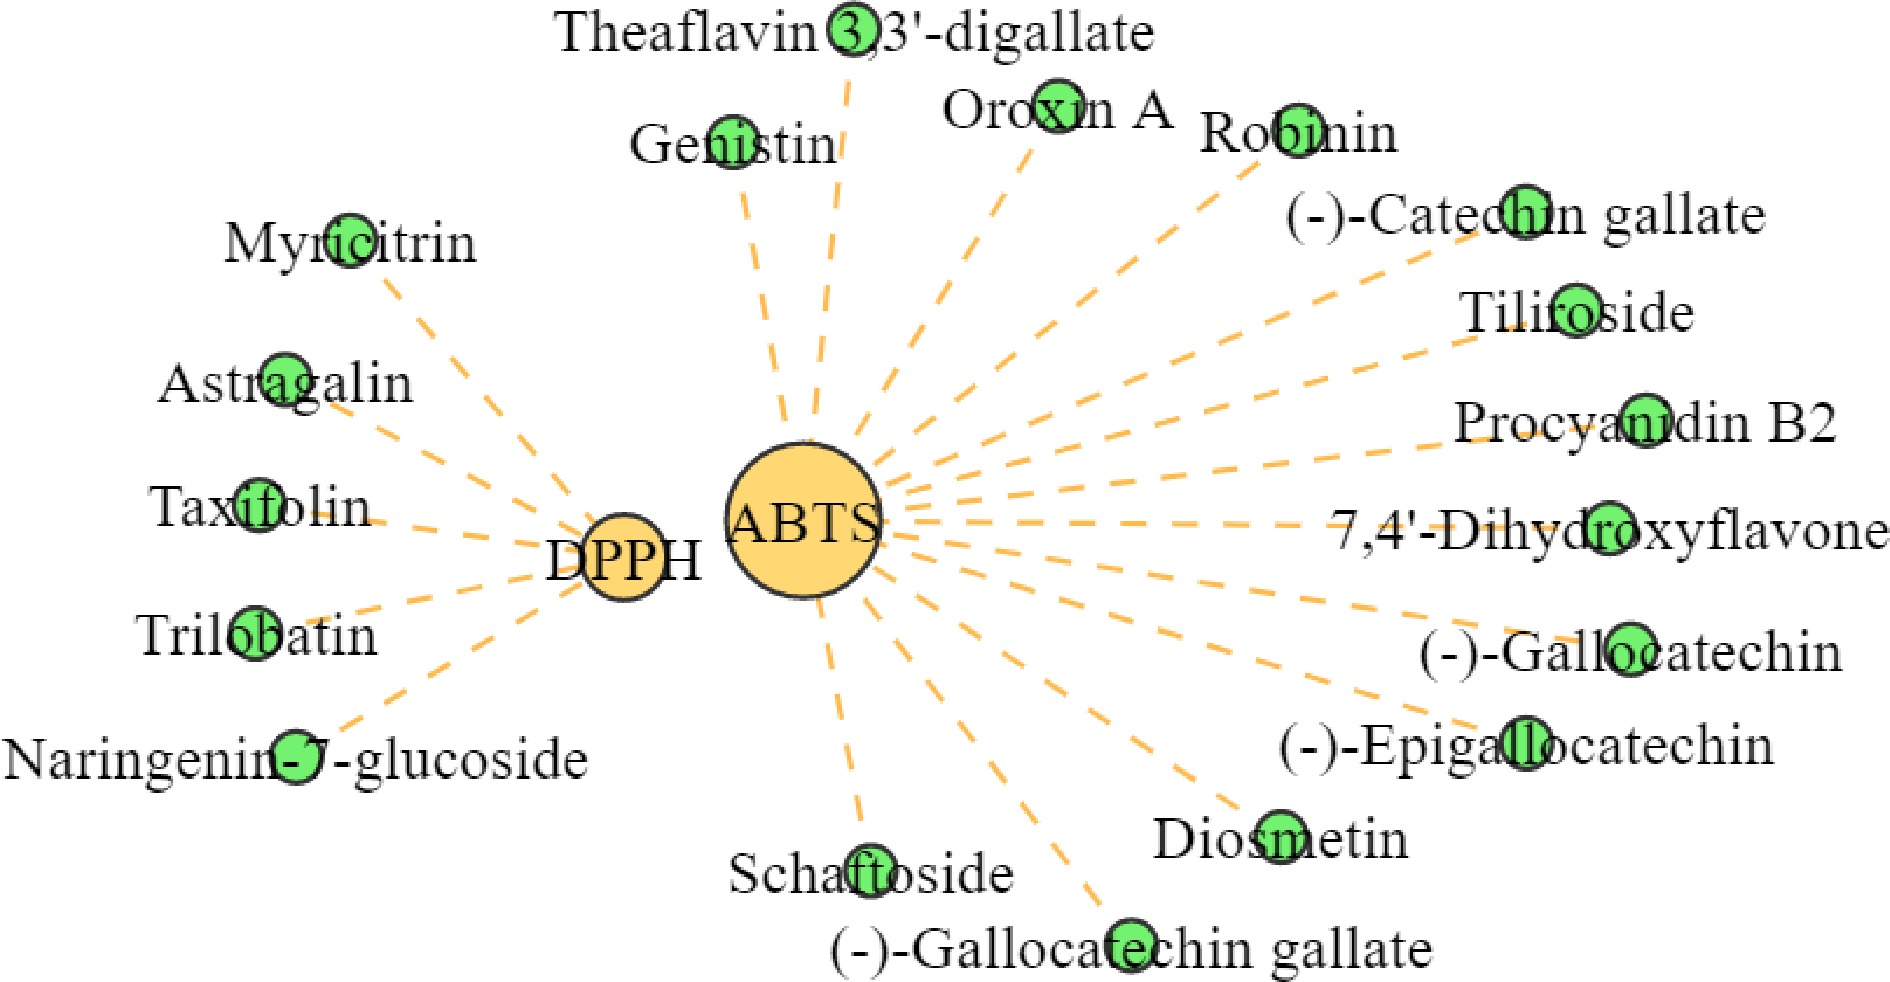
Figure 5.
Network diagram of antioxidant correlation of flavonoids. Note: The green circles in the figure indicates the substance and the orange circles indicates the antioxidant properties.
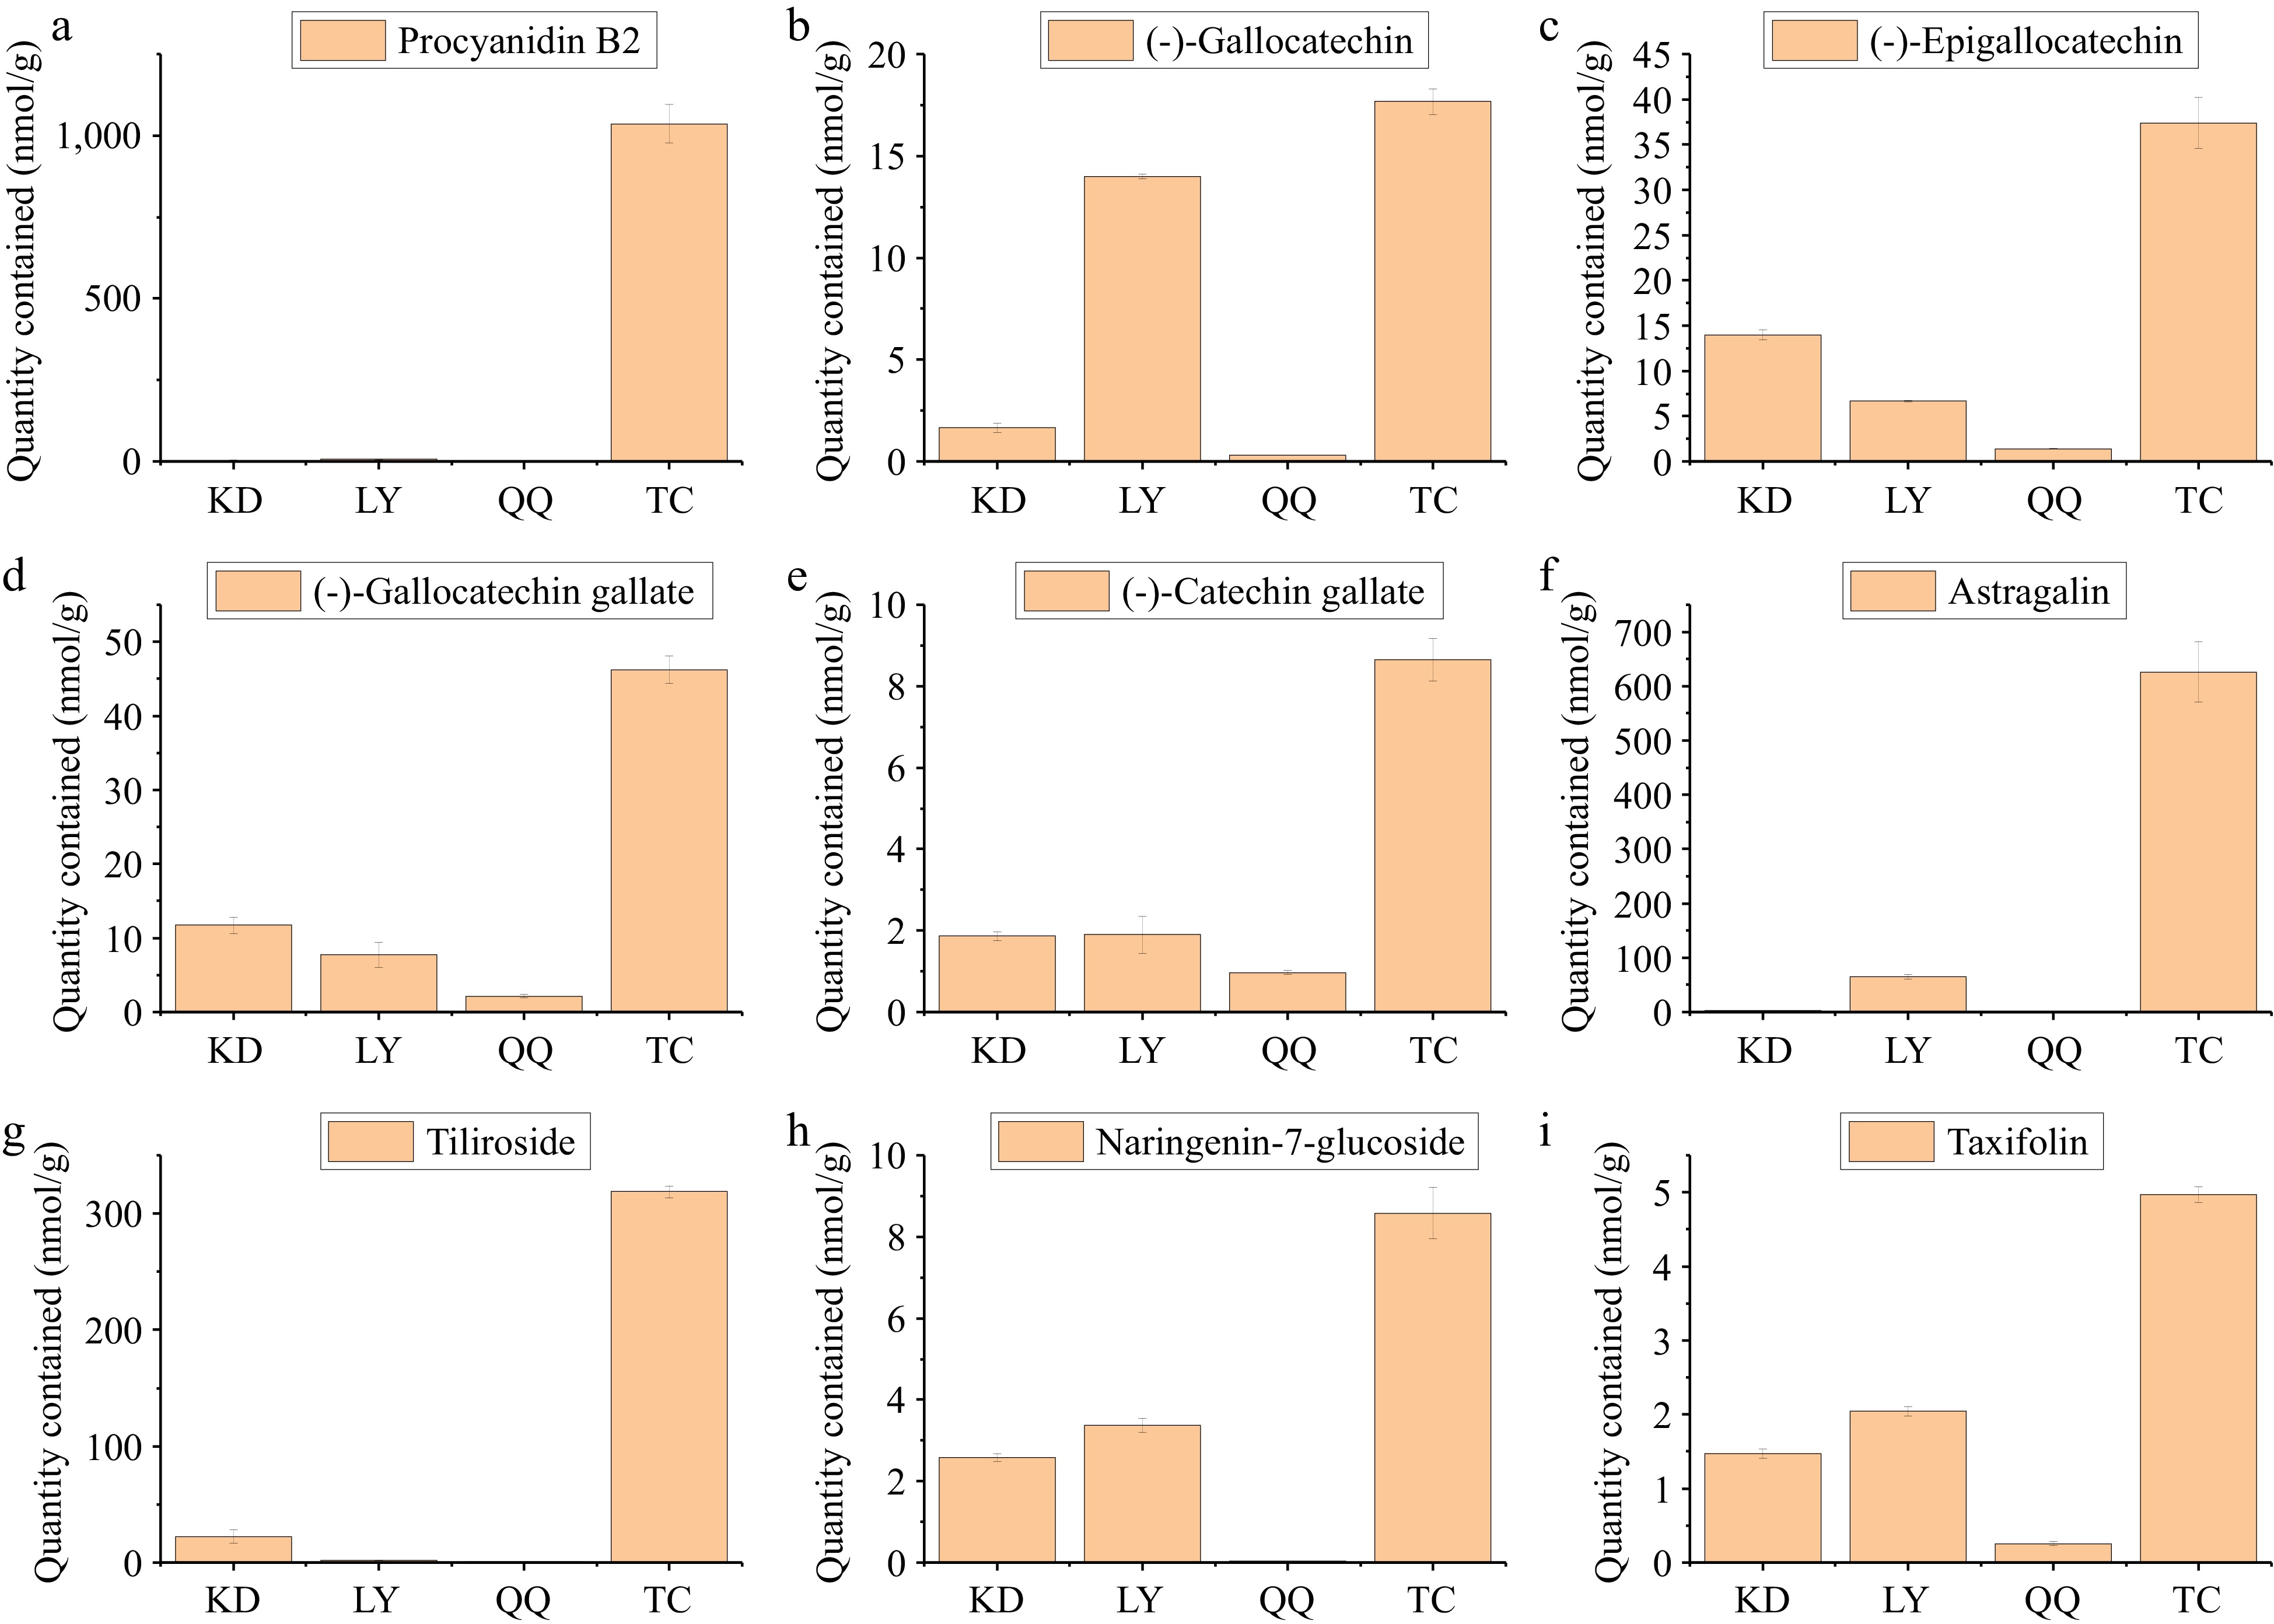
Figure 6.
Flavonoids with high correlation in four kinds of substitute teas. Note: (a)−(i) correspond respectively to Procyanidin B2, (−)-Gallocatechin.
-
The different sources of fresh leaves and the different leaf types and textures of the four substitute teas are the basis for the differences in the taste substances and antioxidant properties of the substitute teas. In this study, a total of 12 classes of 136 flavonoid metabolites and two classes of 12 sugars were identified based on GC-MS/MS. Flavonoid metabolites were dominated by flavones and isoflavanones, and sugars were dominated by glucose, sucrose, and fructose. The differences in flavonoid metabolites in TC and LY were the greatest, and the differences in sugar metabolism in LY and QQ were the greatest.
Flavonoids are important active substances in KD, LY, QQ, and TC because of their special phenolic hydroxyl structure, which can provide active protons that combine with free radicals to form stable compounds, thus playing a role in scavenging free radicals[40]. In this study, flavonoids were significantly and positively correlated with antioxidant activity, and the total flavonoid content of TC was much higher than that of the other three types of tea substitutes. The scavenging ability of the DPPH and ABTS free radicals was strongest in TC, followed by KD, and was weaker in LY and QQ. This is consistent with the results of Nie et al.[41] & Xia[42], who found that the flavonoid contents of QQ and LY were significantly positively correlated with in vitro antioxidant activity. In addition, glycans also showed some antioxidant activity[43,44], and in this study, the scavenging ability of glycans on DPPH and ABTS free radicals was significantly negatively correlated. The present study responded to some extent to the differences in taste substances and antioxidant properties of the four substitute teas.
Differences in the content of flavouring substances are the key to the formation of different flavour characteristics of the four substitute teas
-
Flavonoids are tricyclic polyphenolic compounds with a C6-C3-C6 structure as their backbone[45]. Part of the flavonoids are hydrolyzed into smaller-molecular-weight flavonoid glycosides by stress or heat treatment during processing. Part of them are retained and dissolved in the tea broth to influence the taste of the tea broth, with mildly astringent and low threshold. The high content of flavonoids enhances the bitterness of caffeine in tea broth, making tea broth bitter and astringent[46−48]. Li[49] detected higher flavonoids in KD than green tea by UV spectrophotometry, and the present study detected a higher flavonoid metabolite content in kuding tea than green tea based on UPLC-MS/MS, with more accurate results. Rutin, quercetin, and yangmei ketone are the main flavonoids in KD[50], and rutin is often used as a reference for astringency and can enhance the bitter taste presentation of caffeine and catechins[45]. In this study, rutin was high in KD and TC, which had a greater impact on the astringency of KD and TC. Epicatechins mainly contribute to the bitter and astringent taste of tea soup. In this study, the content of epicatechin in sweet tea was the highest, which has a greater impact on the bitter and astringent taste of TC.
As a direct contributor to the sweetness of tea broth[43], sugars are partly promoted by stress or heat treatment during processing to gradually hydrolyze polysaccharides into substances such as disaccharides or monosaccharides of smaller molecular weight[51]. In this study, based on quantitative detection by UPLC-MS/MS, it was found that monosaccharides were more abundant than disaccharides in the four substitute teas, glucose was the highest sugar substance in QQ at (21.31 ± 0.15b) mg/g, which is consistent with the study of Jiang et al.[52]. The E-tongue test results showed that the sweetness values of LY and TC were higher, and the sweetness values of the four types of substitute tea were higher than those of LC. The difference in taste substances is the key to the different taste characteristics of the four substitute teas.
-
Significant differences in the content of flavonoids and sugar metabolites are the main reasons for the formation of the flavour characteristics and antioxidant differences of the four substitute teas. This study explored the differences in flavonoid and sugar metabolites and antioxidant properties of the four substitute teas compared to green tea at the metabolic level, providing a theoretical basis for the scientific evaluation of the taste quality and antioxidant efficacy of the four substitute teas.
-
The authors confirm contribution to the paper as follows: Liu Z and Ran Q contributed equally to this work. Draft manuscript preparation: Liu Z, Ran Q; software: Yuan C; study supervision: Fang S; project management: Pan K, Long L. All authors reviewed the results and approved the final version of the manuscript.
The Guizhou Provincial Science and Technology Support Project, QKHBZ [2021] 109 general. No. 4014 of the Middle Diversion of Guizhou [2020].
-
The authors declare that they have no conflict of interest.
-
# These authors contributed equally: Zhongying Liu, Qiansong Ran
- Copyright: © 2023 by the author(s). Published by Maximum Academic Press, Fayetteville, GA. This article is an open access article distributed under Creative Commons Attribution License (CC BY 4.0), visit https://creativecommons.org/licenses/by/4.0/.
-
About this article
Cite this article
Liu Z, Ran Q, Yuan C, Fang S, Pan K, et al. 2023. Differences in taste characteristics and antioxidant properties of four substitute teas based on a targeted metabolomics approach. Beverage Plant Research 3:33 doi: 10.48130/BPR-2023-0033 

Differences in taste characteristics and antioxidant properties of four substitute teas based on a targeted metabolomics approach
- Received: 03 September 2023
- Revised: 27 September 2023
- Accepted: 21 October 2023
- Published online: 18 December 2023
Abstract: To investigate the differences in taste characteristics and antioxidant properties of four types of tea substitutes. After sensory review and electronic tongue indicated that the taste characteristics of the four substitute teas were sweetness, bitterness and astringency. There were a total of 136 flavonoid metabolites in 12 categories and 12 sugar metabolites were identified in the four substitute teas with ultra-performance liquid chromatography tandem-mass spectrometry metabolomics targeted detection. Flavonoids were significantly positively correlated with antioxidant properties, among them, 15 were positively associated with clearing ABTS radicals and five were positively associated with clearing DPPH radicals, and sugars were significantly negatively correlated with antioxidant properties. The antioxidant properties were in the following order: TC > KD > LY > QQ. The conclusion is that significant differences in the content of flavonoids and sugar metabolites are the main reasons for the formation of the flavour characteristics and antioxidant differences of the four substitute teas.
-
Key words:
- Taste characteristics /
- Antioxidant properties /
- Flavonoids /
- Sugars /
- Tea substitutes