


-
Kombucha originated in China and has a history of over two thousand years. Sometimes referred to as 'Sea Treasure' or 'Stomach Treasure'[1−3], this traditional fermented acidic tea drink is widely acclaimed for its unique flavor and numerous health benefits. Kombucha is widely praised as a beneficial health beverage, known for its antioxidant properties[4,5], liver protection[6], and improvement of digestive system function[7], among other benefits. In the traditional production of Kombucha, black tea, and sugar are the primary ingredients. However, in recent years, to enhance the sensory appeal and bioactivity of Kombucha, people have started experimenting with various herbs and teas in its preparation[8]. For instance, Zou et al.[9] used purple bud tea, black tea, and green tea to produce different Kombucha samples and found that their 1,1-diphenyl-2-picrylhydrazyl (DPPH) free radical scavenging capacity was enhanced after fermentation. In contrast, Jakubczyk et al.[10] discovered that the antioxidant capacity of black tea, white tea, and green tea decreased after fermentation. Additionally, Gramza-Michalowska et al.[11] found that the microbial fermentation process had no significant impact on the content of tea polyphenols and antioxidant capacity. Jakubczyk et al.[10] reported that green tea Kombucha had the greatest antioxidant potential. Recently, Cardoso et al.[12] reported that the antioxidant capacity of black tea Kombucha was superior to that of green tea Kombucha.
The fermentation process of Kombucha involves complex interactions among microbial communities, primarily including acetic acid bacteria, yeast, and lactic acid bacteria[13,14]. Within the first three days of fermentation, yeast converts sucrose into glucose and fructose[15,16], generating ethanol and carbon dioxide through glycolysis and acetoin decarboxylation reactions[10,17]. By the 6th to the 8th day of fermentation, yeast population and ethanol concentration peak[18], at which point acetic acid bacteria consume glucose and fructose, converting ethanol into acetic acid and gluconic acid, with acetic acid levels reaching their peak on the 15th day of fermentation[19,20]. Analysis of Kombucha fermentation broth reveals that acetic acid, lactic acid, and gluconic acid are its primary metabolic products[17]. The levels of these compounds and microbial composition dynamically change throughout fermentation, influenced not only by fermentation techniques but also closely related to the types of tea leaves used to brew Kombucha. Understanding these changes is crucial for optimizing the fermentation process of Kombucha, enhancing its health benefits and flavor characteristics.
Green tea and black tea are the two most commonly used tea bases for making Kombucha. Studies have shown that Oenococcus oeni, which is closely associated with green tea, is found in Kombucha made from a green tea base, while it is absent in Kombucha made from a black tea base. During the fermentation process, black tea Kombucha consumes glucose and fructose at a higher rate and produces organic acids and cellulose more quickly than green tea Kombucha, with its yeast population peaking on the 7th day, whereas green tea Kombucha reaches the peak on the 10th day[21].
Building upon previous research, this study used green tea and black tea prepared from the same raw materials as bases, employing traditional Chinese methods to produce Kombucha. Through microbial testing, untargeted metabolomics, and network pharmacology analysis, the study systematically explored the differences between the two base Kombuchas in terms of sensory quality, microbial structure, and bioactive components.
HTML
-
Green tea and black tea were prepared from tea leaves harvested during the Grain Rain season in Fuliang County, Jiangxi Province, China. The Kombucha SCOBY (Symbiotic Culture of Bacteria and Yeast) was purchased from Beijing Sisi Slow Food Catering Co., LTD (Beijing, China).
Preparation and sampling of Kombucha
-
Using an electronic scale, 5 g of green tea and black tea samples were respectively weighed and added to containers with 500 mL of boiling water, boiled for 3 min on an induction cooker. The tea liquid was then topped up to 500 mL and poured into sterile 1,500 mL glass jars. Subsequently, 50 g of white sugar was added and stirred until completely dissolved. The tea liquid was allowed to cool to room temperature. Twenty g of SCOBY (Symbiotic Culture Of Bacteria and Yeast) were measured and placed into fermentation tanks, followed by the addition of 50 mL of Kombucha original liquid; The green tea and black tea Kombucha samples were labeled K-GT and K-BT, respectively. In the control group, except for adding an equal amount of distilled water without tea, the other steps were the same as those of the previous two groups and were labeled K-C. The fermentation tank was sealed with two layers of clean gauze and secured with rubber bands. Finally, the fermentation tanks were placed in an incubator at 28 °C for 14 d of fermentation. Afterward, they were quickly frozen with liquid nitrogen for 10 s and immediately transferred to a refrigerator at −80 °C for further analysis.
Sensory evaluation
-
On the 14th day of fermentation, a sensory evaluation of the Kombucha was conducted[22]. A sensory evaluation was conducted by a trained panel from Hunan Agricultural University, consisting of four females and three males aged between 20 to 35 years. Three groups of 250 mL Kombucha fermentation liquid were sampled: 100 mL was poured into a transparent glass for observing appearance and color, and 150 mL was transferred into a tasting bowl for flavor assessment. In conformity with a validated methodological framework, a sensory evaluation of the Kombucha samples was carried out through a quantitative descriptive analysis technique. The assessment was performed on a scale that spanned a numerical continuum from 1 to 9, with a higher score indicating a greater preference for the Kombucha sample.
Microbial community analysis
-
The fermentation liquid samples of three groups in 1.3 after 14 d of fermentation were frozen in liquid nitrogen for 3 min and then sent to BGI Genomics for microbial community analysis. High-quality genomic DNA (30 ng) underwent PCR using fusion primers targeting the V3-V4 and ITS2 regions of total DNA. PCR products were purified with Agencourt AMPure XP beads, eluted in Elution Buffer, and prepared for library construction. Library fragment sizes and concentrations were assessed using an Agilent 2100 Bioanalyzer. Qualified libraries were sequenced on the HiSeq platform based on insert sizes. Following sample differentiation, community bar charts, and heat maps were generated at phylum and genus levels. The LEfSe method analyzed bacterial community abundances and related categories. PICRUSt2 predicted Kyoto Encyclopedia of Genes and Genomes (KEGG) functional abundances based on KO IDs, representing specific genes and metabolic pathways[23].
Non-targeted metabolomics analysis
-
The fermentation liquid samples of three groups in 1.3 after 14 d of fermentation were thawed at 4 °C, and 100 μL/sample was mixed in a 96-well plate with 300 μL extraction solution (methanol : ACN = 2:1, pre-cooled to −20 °C) and 10 μL internal standards (d3-leucine, 13C9-phenylalanine, d5-tryptophan, 13C3-progesterone), vortexed for 1 min, and incubated at −20 °C for 2 h. After centrifugation (4 °C, 4,000 g, 20 min), 300 μL supernatant was dried in a cold vacuum concentrator. Then, 150 μL resolvent (methanol : H2O = 1:1) was added, vortexed (1 min), and centrifuged (4 °C, 4,000 rpm, 30 min). The supernatant was transferred to sample vials. Quality control used 10 μL of each supernatant to prepare a QC sample for LC-MS analysis repeatability. The experiment utilized a Waters 2D UPLC coupled with a Q Exactive HF high-resolution mass spectrometer (Thermo Fisher Scientific) for metabolite separation and detection.
Correlation analysis between microbes and metabolites
-
Correlation analysis was conducted on the major differential metabolites enriched in the top 10 KEGG pathways of both green tea (K-GT) and black tea (K-BT) Kombucha. Microbial and metabolite correlation analysis was performed using the OmicStudio tool available at
www.omicstudio.cn/tool . Specifically, 10 differential metabolites from the top 10 KEGG pathways of K-GT and 22 differential metabolites from K-BT were annotated using the PubChem database (https://pubchem.ncbi.nlm.nih.gov ) to convert into Simplified Molecular Input Line Entry System (SMILES) notation and filtered for bioavailability score (BS) > 0.17. Target prediction of these metabolites was conducted using the SwissTargetPrediction database (www.swisstargetprediction.ch ), setting Probability > 0 as a filtering criterion. Filtered target genes were imported into the STRING database (https://string-db.org/ ) to predict protein-protein interactions (PPI) with a total score ≥ 0.9. Metascape database (www.metascape.org ) was employed for online functional annotation and enrichment pathway analysis of target genes, selecting Homo sapiens as the species. Cytoscape 3.9.1 (https://cytoscape.org/ ) was used to construct a network of associations between active ingredients and target genes.Network pharmacology analysis
-
To identify active ingredients of differential metabolites in green tea and black tea Kombucha, metabolite SMILES numbers obtained from PubChem were inputted into SwissADME for screening, particularly focusing on metabolites with a 'Bioavailability Score ≥ 0.17'. The Swiss Target Prediction database was used to analyze the targets of active ingredients to obtain potential targets, filtering based on probability > 0 and removing duplicates. Import the gene names of potential targets into STRING (
www.string-db.org ), select the species as 'Homo sapiens', and perform protein-protein interaction (PPI) network analysis. Save the PPI diagram and import the analysis data into Cytoscape 3.9.1 for further analysis. Use the values of Degree Centrality (DC), Betweenness Centrality (BC), and Closeness Centrality (CC) from the analysis results for screening. First, perform an initial screening based on the median values of these three metrics, then adjust the screening values for further refinement to identify potential core targets. Finally, a diagram of core target-active ingredient relationships was constructed, with node color indicating compound categories, node size related to degree, and edges representing connections.
Materials
-
After fermentation, a sensory assessment was performed on Kombucha samples from various groups, with the findings presented in Fig. 1. Detailed sensory descriptions are shown in Supplementary Tables S1 and S2. The assessment results in Fig. 1a show that the green tea Kombucha group (K-GT) exhibited a pale yellow-green liquid color, while the black tea Kombucha (K-BT) displayed an amber-colored liquid. Figures 1b and c indicate that the green tea Kombucha had a smooth and subtly sweet taste with a hint of vinegar flavor and a fresh tea aroma. The black tea Kombucha had a robust vinegar flavor intertwined with the floral and fruity notes characteristic of black tea, with a sweet and sour taste and a fizzy texture. Compared to the other two groups, it had the highest sweet taste score and the lowest sourness score, offering a superior overall sensory experience.
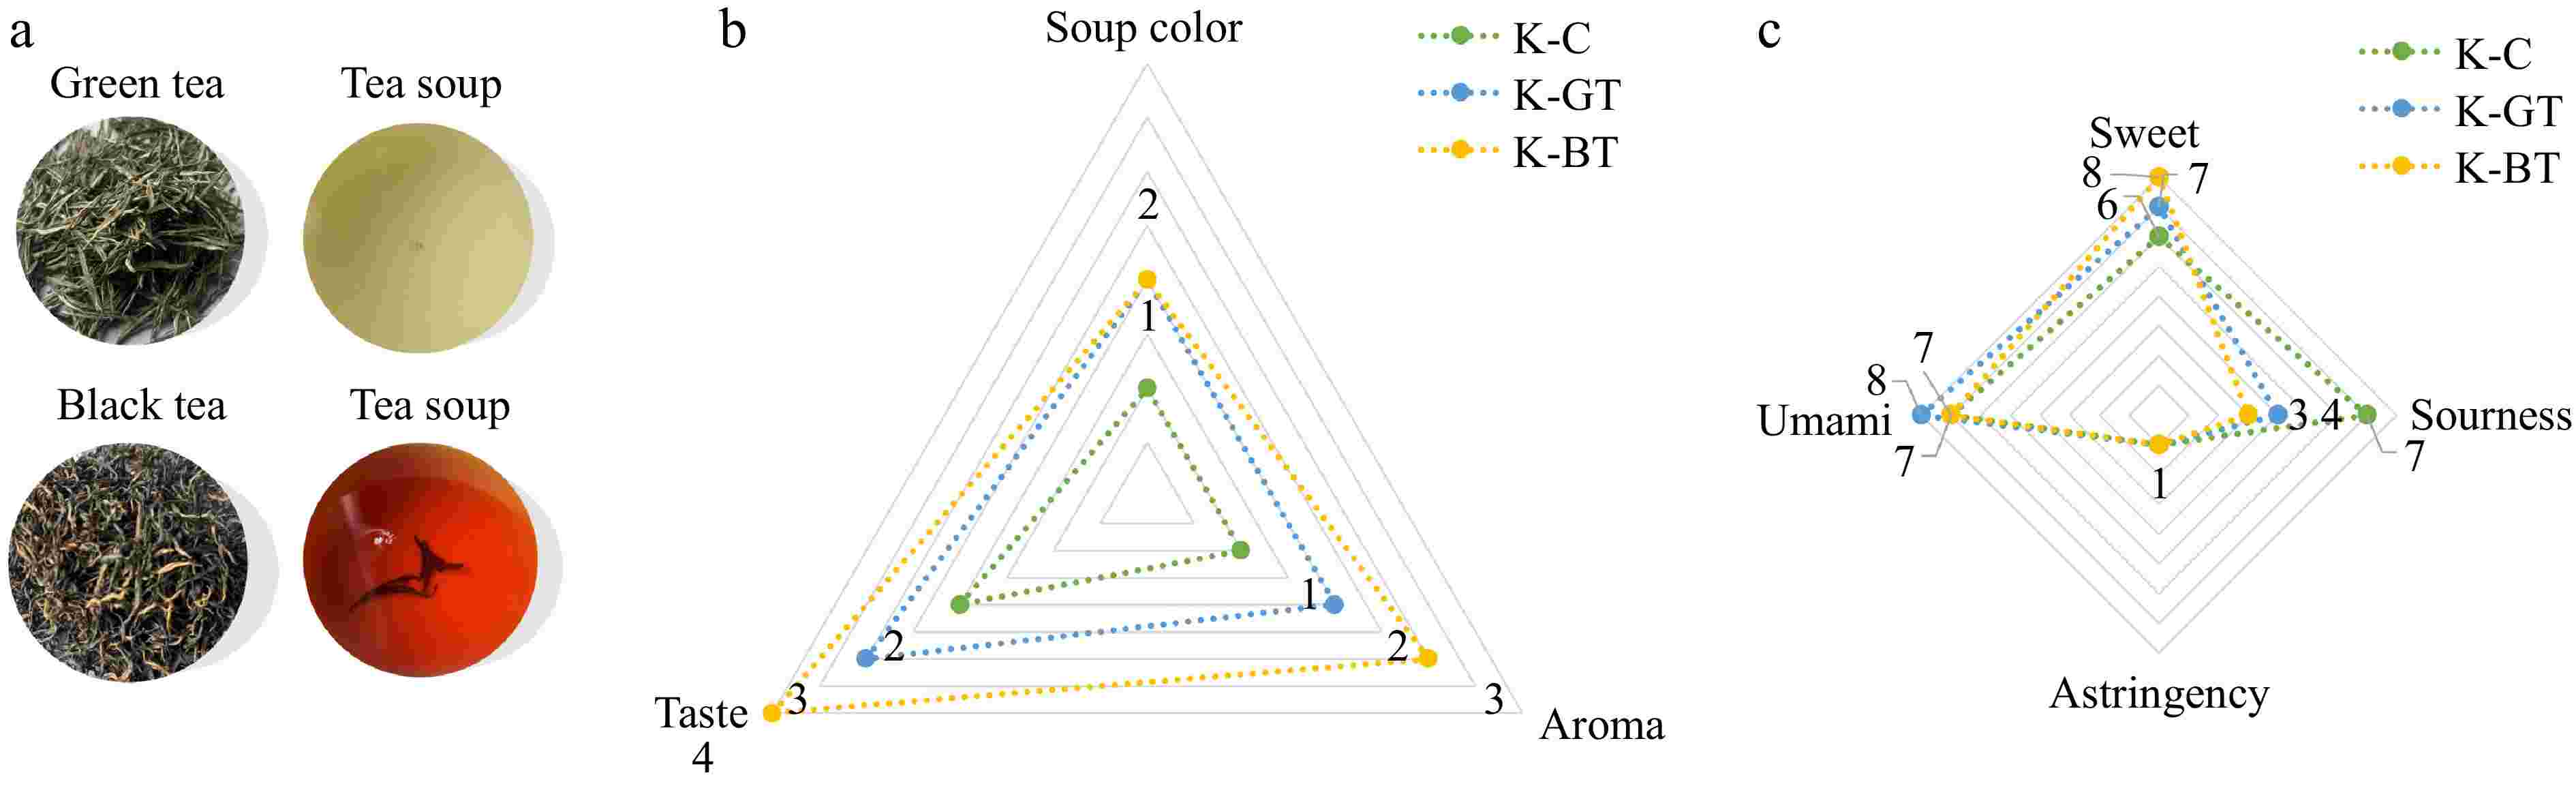
Figure 1.
Sensory evaluation results of Kombucha. (a) The appearance of dried tea, tea infusion according to sensory analysis. (b) The effects of three type of Kombucha on the taste, aroma, and soup color according to sensory analysis. (c) Taste evaluation of three type of Kombucha.
Microbial composition analysis of Kombucha liquor
Analysis of bacterial 16S rRNA sequencing in fermentation liquor
-
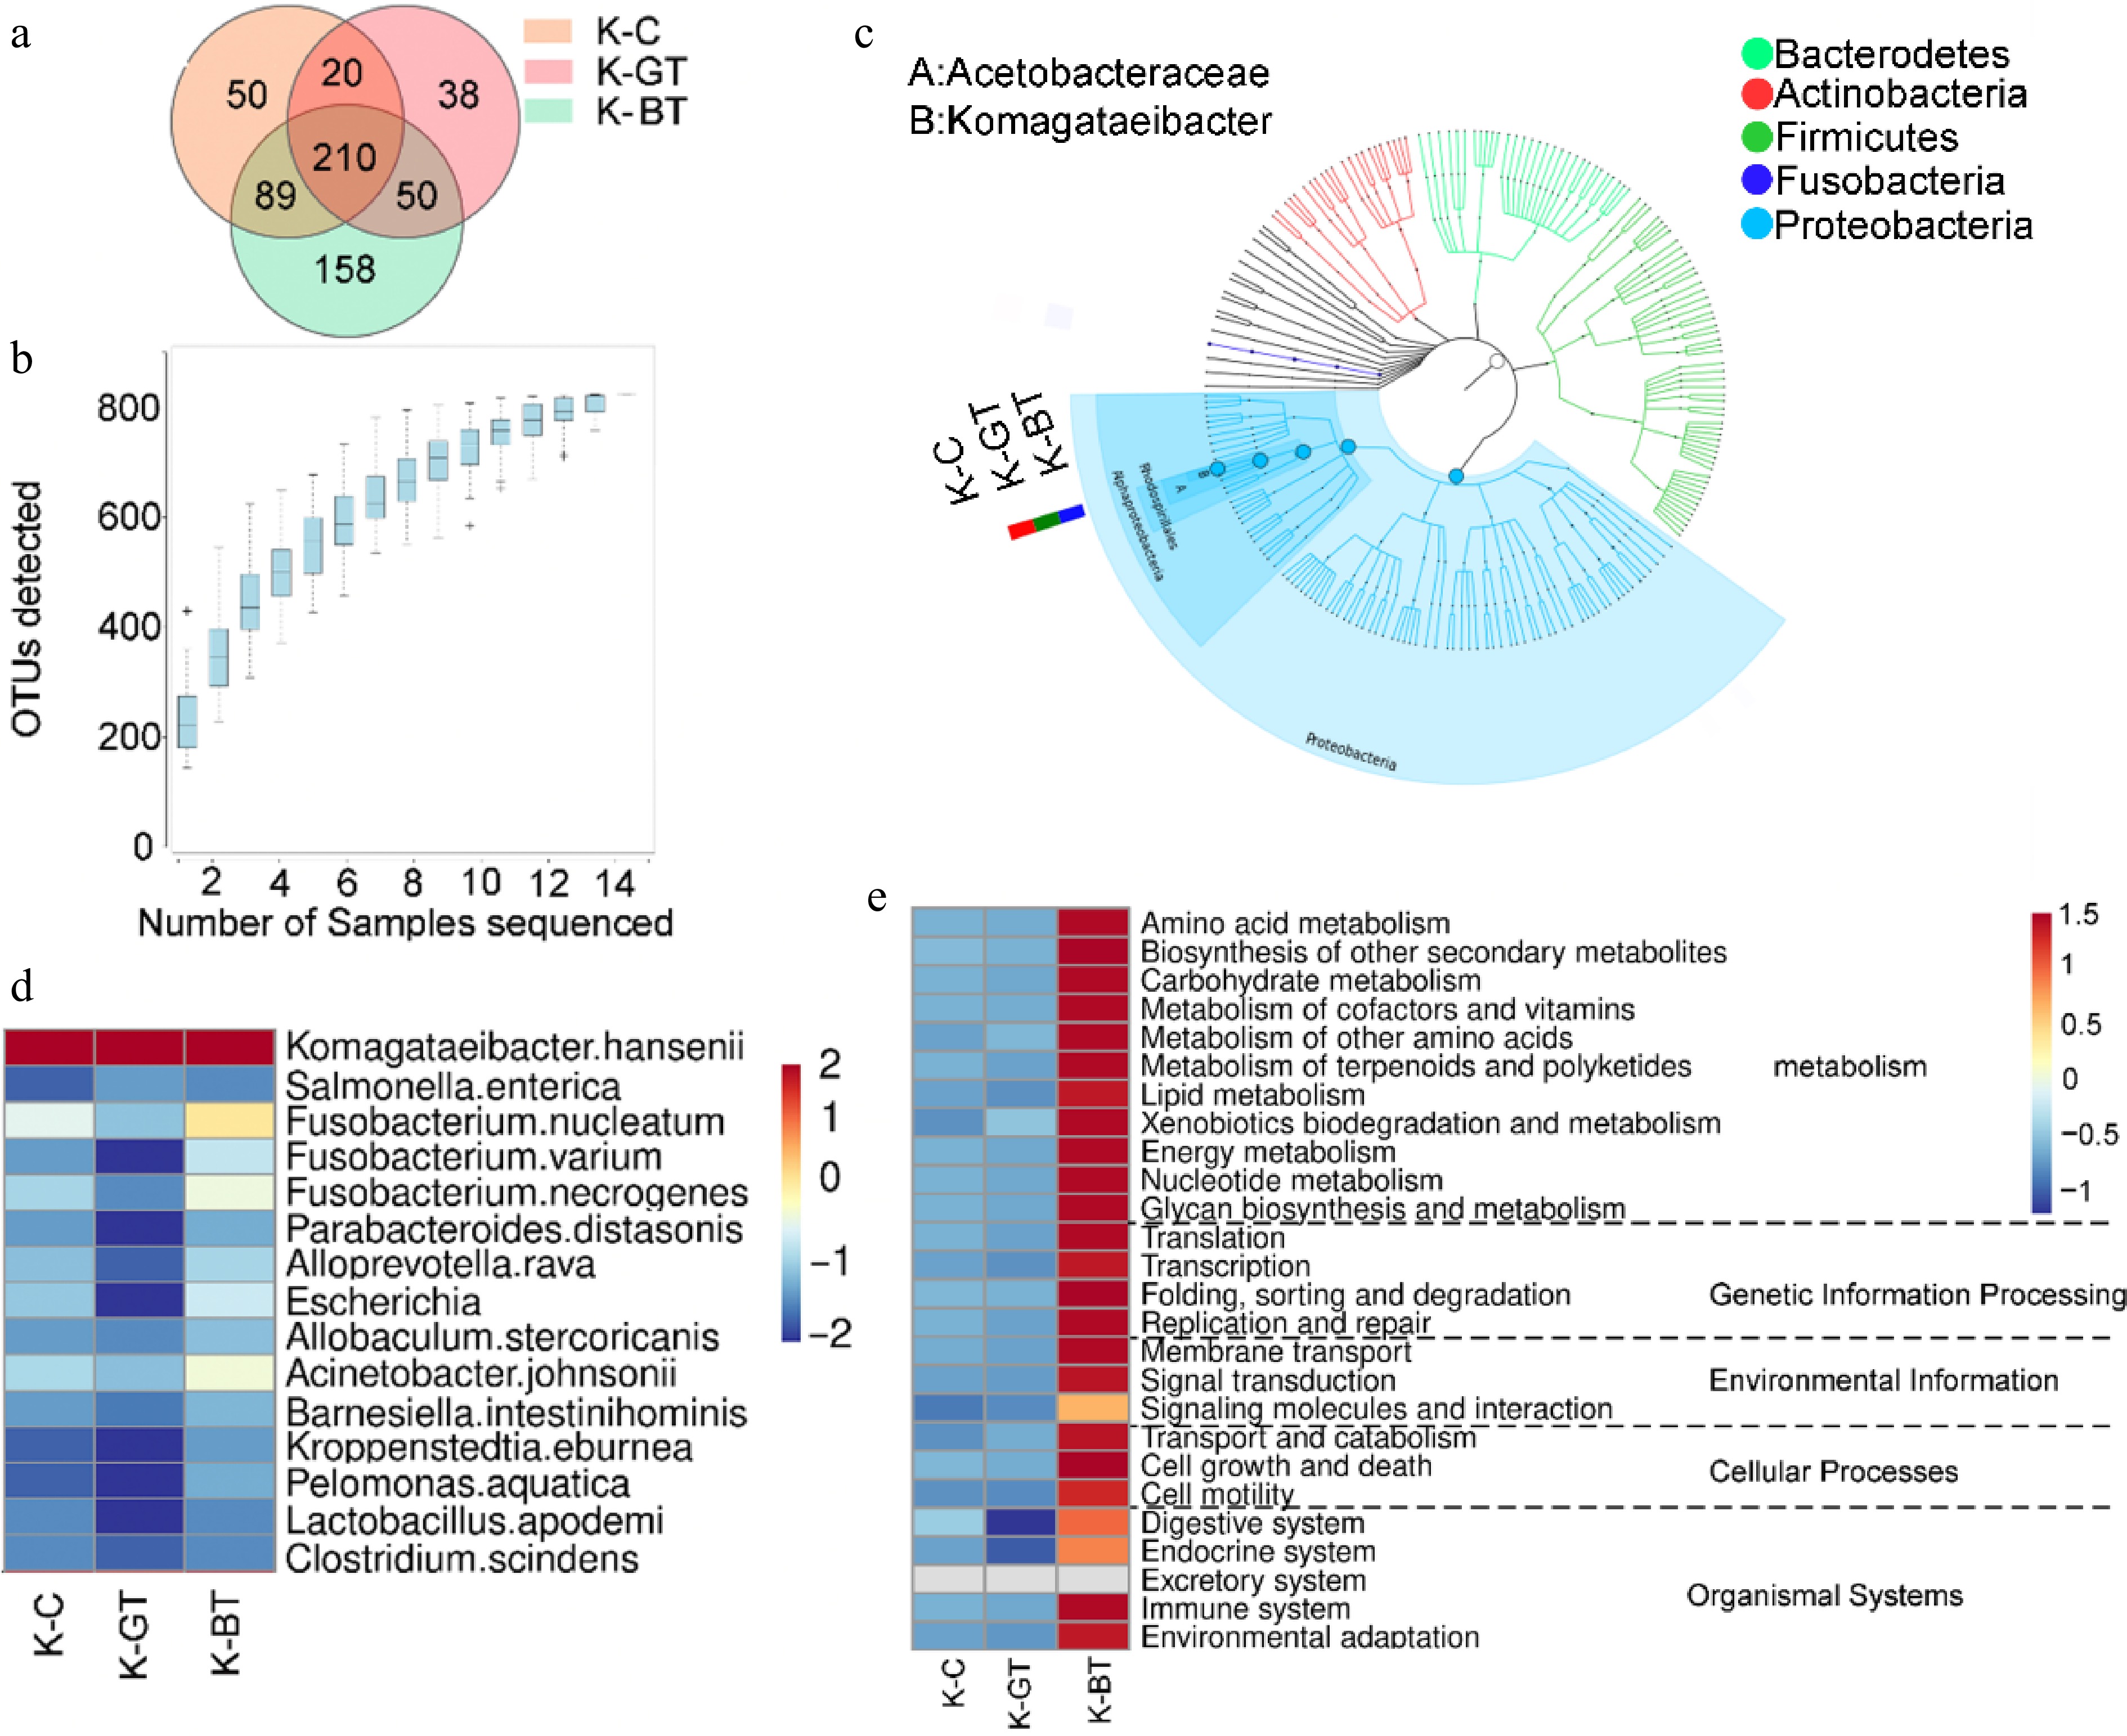
16S rRNA sequencing analysis was performed on 12 Kombucha samples, resulting in the identification of 615 operational taxonomic units (OTUs) through clustering analysis. Among them, the K-BT group exhibited the highest number of unique OTUs, totaling 158; whereas the K-GT group had the fewest unique OTUs, with 38. There were 210 core OTUs identified across all samples, which were present universally (Fig. 2a).
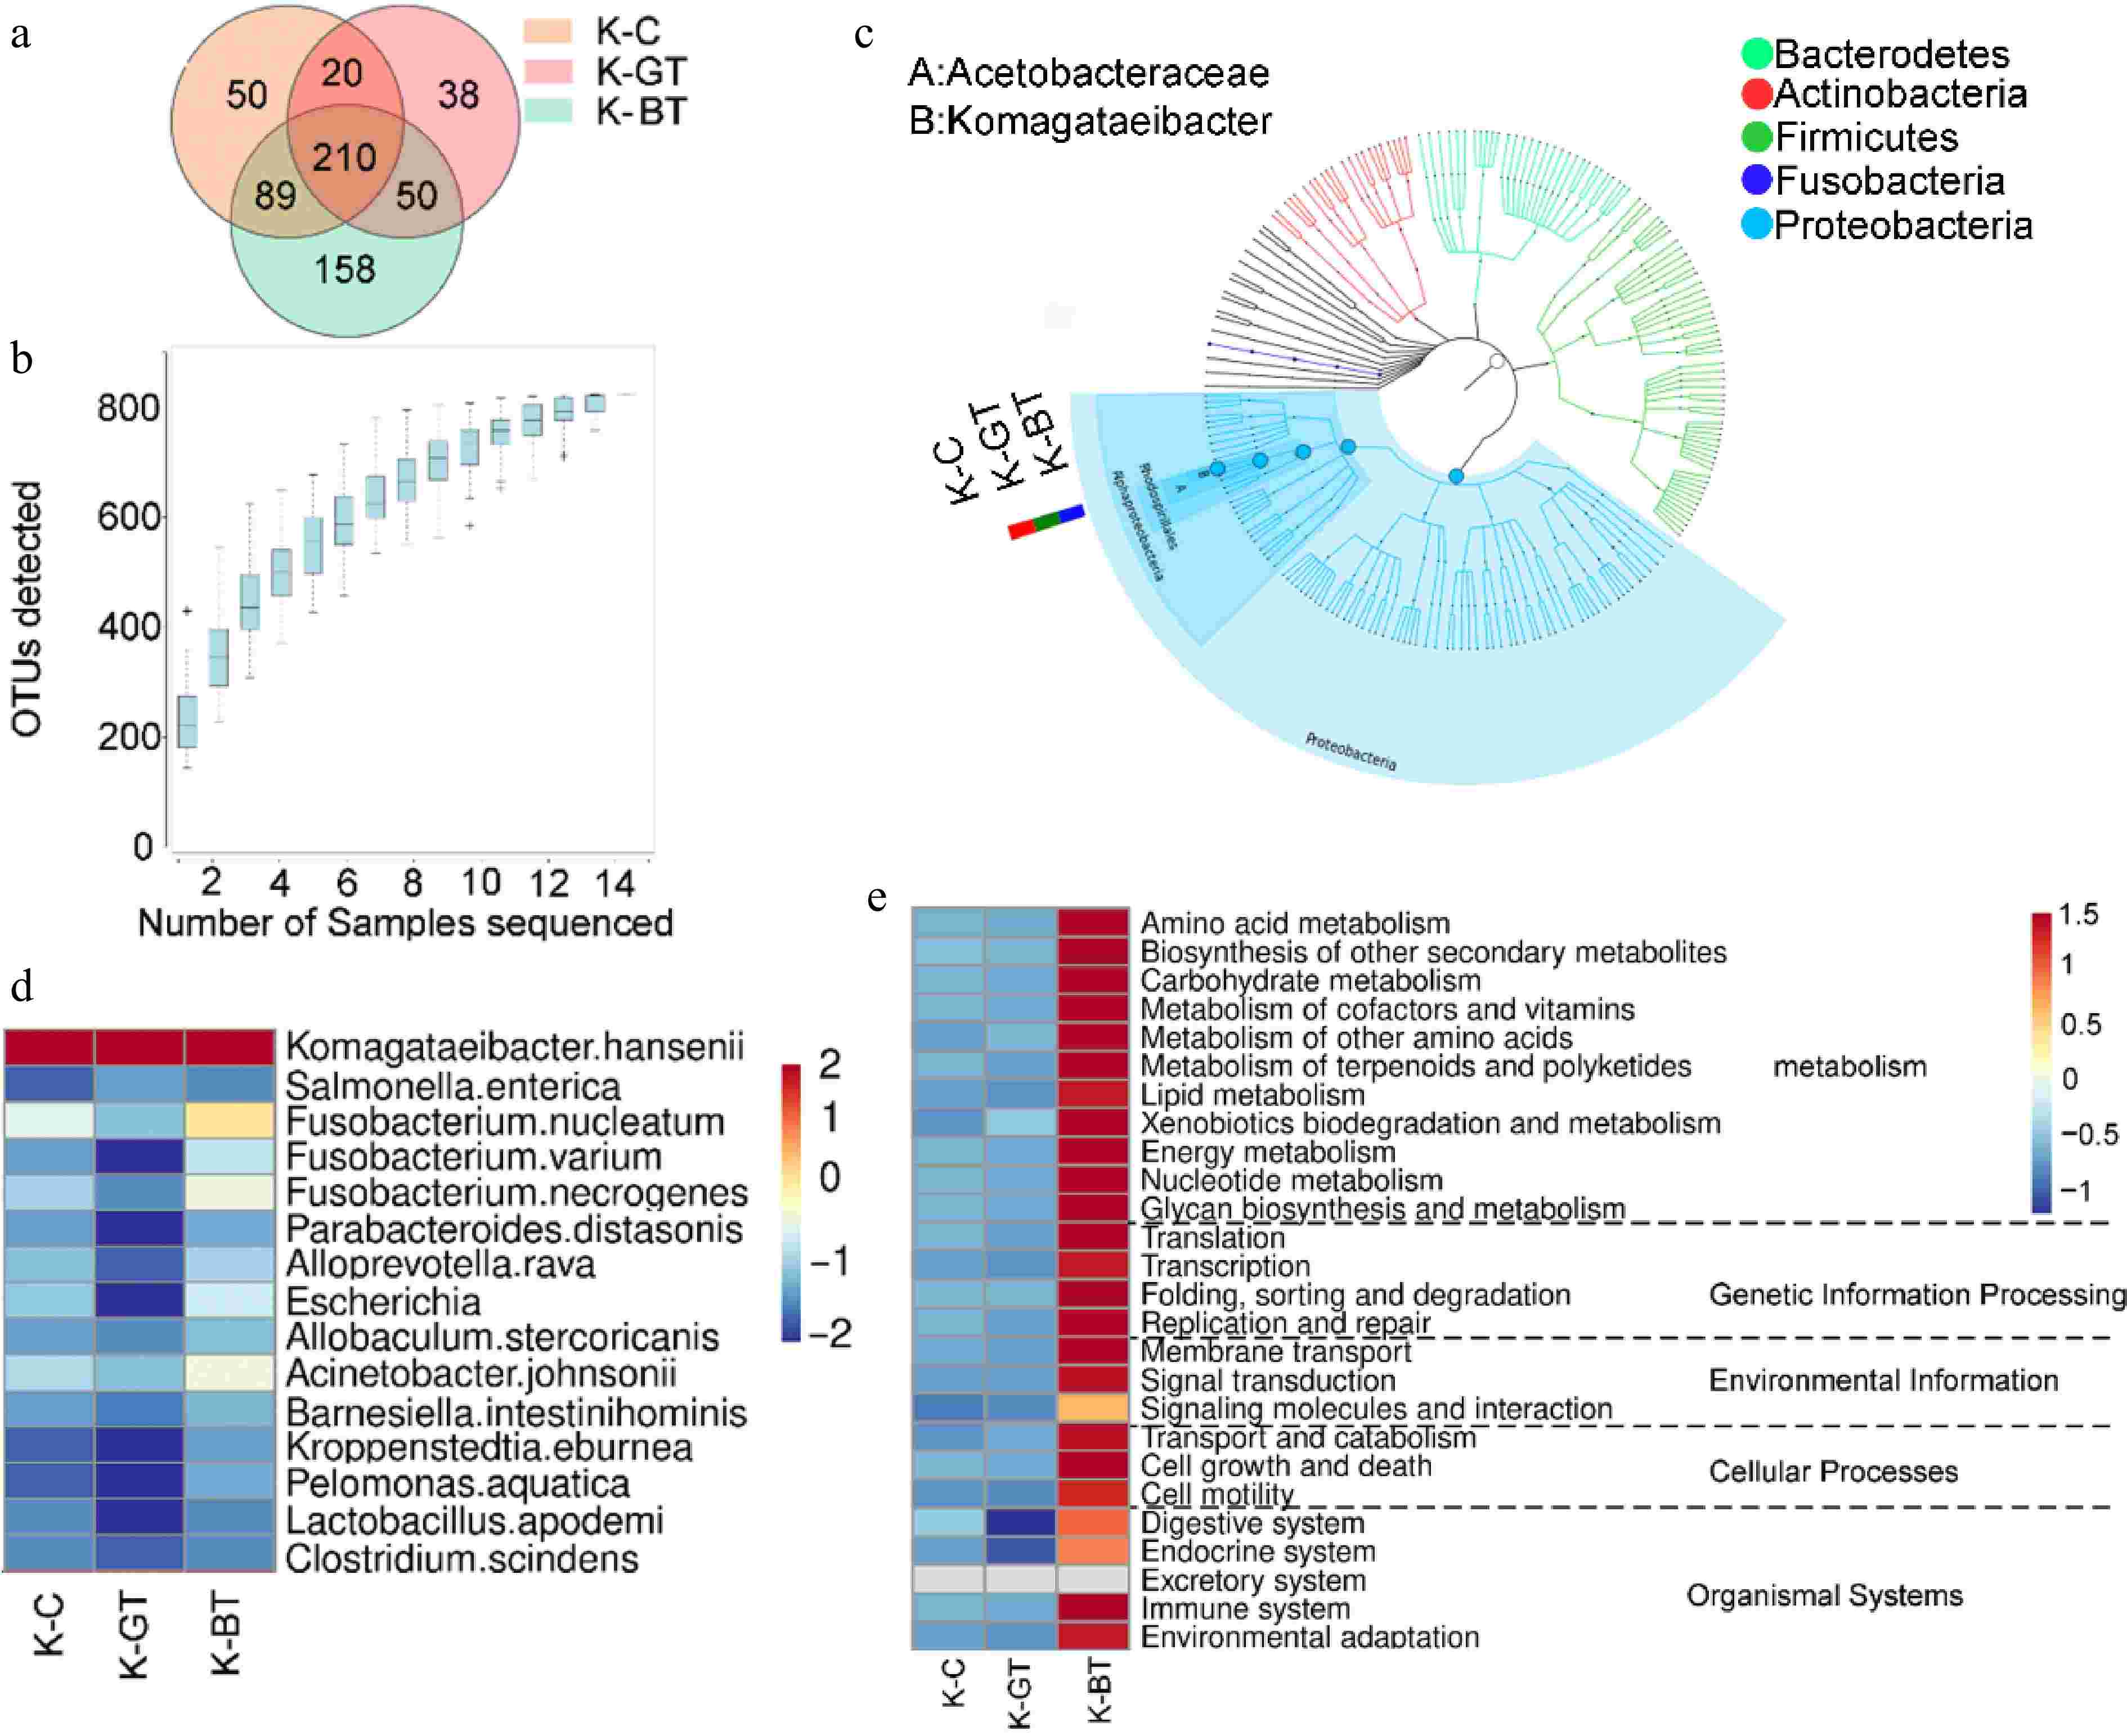
Figure 2.
16S sequencing analysis of Kombucha fermentation liquor among different groups. (a) Venn diagram of 16S sequencing OTUs. (b) Species accumulation curve. (c) Graphlan diagram. (d) Heat map displaying distribution of species at the bacterial species level. (e) Relative abundance of major metabolic pathways from the KEGG database (based on 16S rRNA sequencing data). To ensure data comparability and accuracy, functional gene abundances have been log10 transformed and normalized using z-score standardization (zero-mean normalization).
Rarefaction curves demonstrated that as sequencing depth increased, the number of OTUs gradually rose and stabilized after reaching a certain level (Fig. 2b). This indicates high sequencing accuracy and comprehensive coverage of OTUs, reflecting the microbial diversity of Kombucha liquor comprehensively.
At the species level classification, Komagataeibacter hansenii emerged as the predominant species in all samples, demonstrating significant dominance (Fig. 2c). In the analysis of microbial composition at the genus level, the main microbial genera identified include Komagataeibacter and Fusobacterium. Among them, Komagataeibacter was overwhelmingly dominant across all samples, with an average abundance exceeding 84%, belonging to the Acetobacteraceae family. Specifically, the relative abundances of Komagataeibacter in K-C, K-GT, and K-BT were 97%, 98.6%, and 92.97%, respectively (Fig. 2d). Komagataeibacter hansenii serves as a model organism that can be genetically engineered to produce specific biomaterials like bacterial cellulose or metabolic products such as acetic acid.
Predictive functional analysis of KEGG pathways was conducted for the three groups of Kombucha samples (Fig. 2e). The results indicate that K-BT exhibited the highest total abundance of functional genes, particularly highlighting its prominence in metabolic pathways. This suggests that Kombucha based on black tea shows significant advantages in metabolic activity and functional diversity.
ITS analysis of fungi in Kombucha tea
-
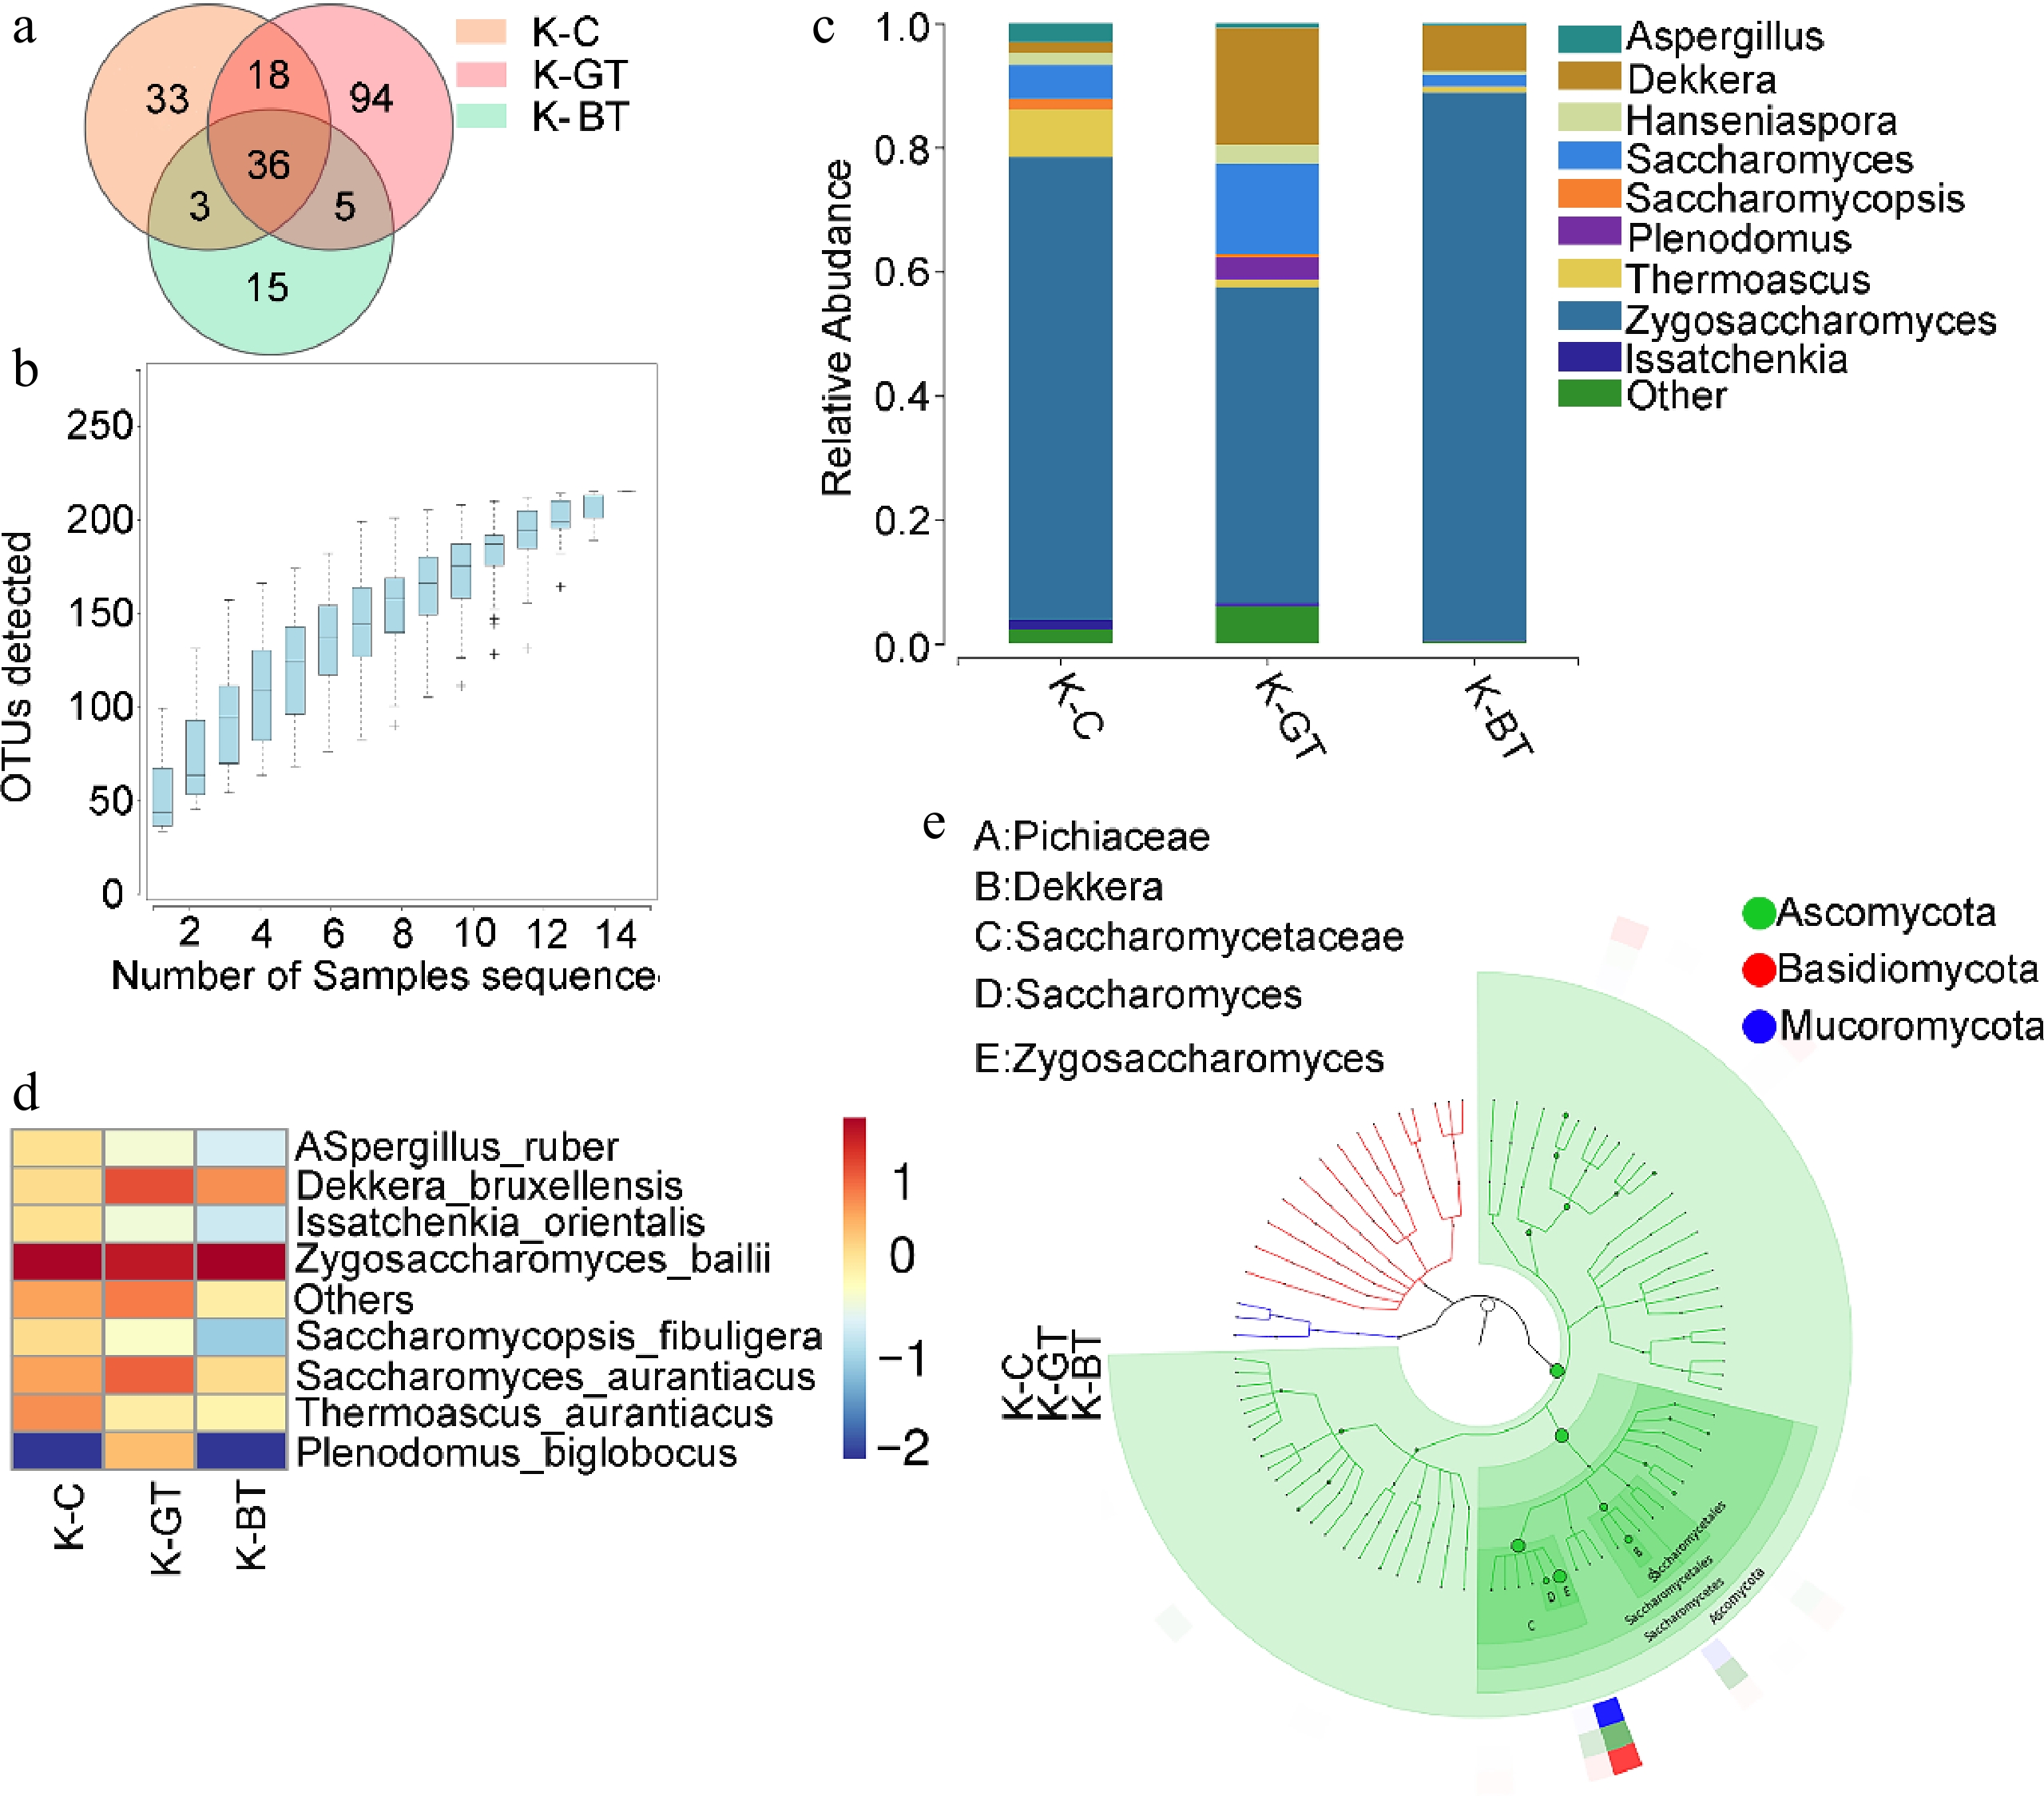
Through ITS gene sequencing analysis, a total of 204 Operational Taxonomic Units (OTUs) were detected across the three groups of samples. Among these, the K-GT group exhibited the highest number of unique OTUs, totaling 94; followed by the K-BT group with 89; and a core set of 36 OTUs common to all groups (Fig. 3a). Species rarefaction curves from ITS sequencing (Fig. 3b) demonstrate high accuracy and comprehensive OTU coverage of the sequencing results.

Figure 3.
Analysis of ITS sequencing of Kombucha fermentation fungi. (a) Venn diagram of ITS sequencing OTUs. (b) Species accumulation curve. (c) Bar chart of fungal genus-level species distribution. (d) Heat map of fungal species-level species distribution. (e) Graphlan diagram.
Through ITS sequencing, the top ten genera with the highest relative abundance were found at the genus level, as shown in Fig. 3c. The three groups of samples included Zygosaccharomyces, Thermoascus, Saccharomyces, Aspergillus, Hanseniaspora, and Saccharomycopsis, Dekkera, Issatchenkia, Plenodomus, and Zygosaccharomyces were predominant in the K-BT group (88.27%), followed by 74.5% in the K-C group and 50.94% in the K-GT group.
At the species level analysis, major yeast species in Kombucha tea included Zygosaccharomyces bailii, which occupied a significant proportion across all groups: 88.27% in K-BT, 74.5% in K-C, and 50.95% in K-GT. Additionally, Saccharomyces cerevisiae and Dekkera bruxellensis were also prominent in all three groups. Notably, the K-BT group showed the highest yeast proportion among fungi, reaching 97.74%, followed by 85.28% in K-GT, and approximately 85.07% in K-C (Fig. 3d, e). This indicates that the K-BT group has superior yeast abundance and diversity compared to the other two groups, highlighting the significant advantages of black tea-based Kombucha tea in yeast richness and biological activity.
Metabolomic analysis of Kombucha fermentation broth
-
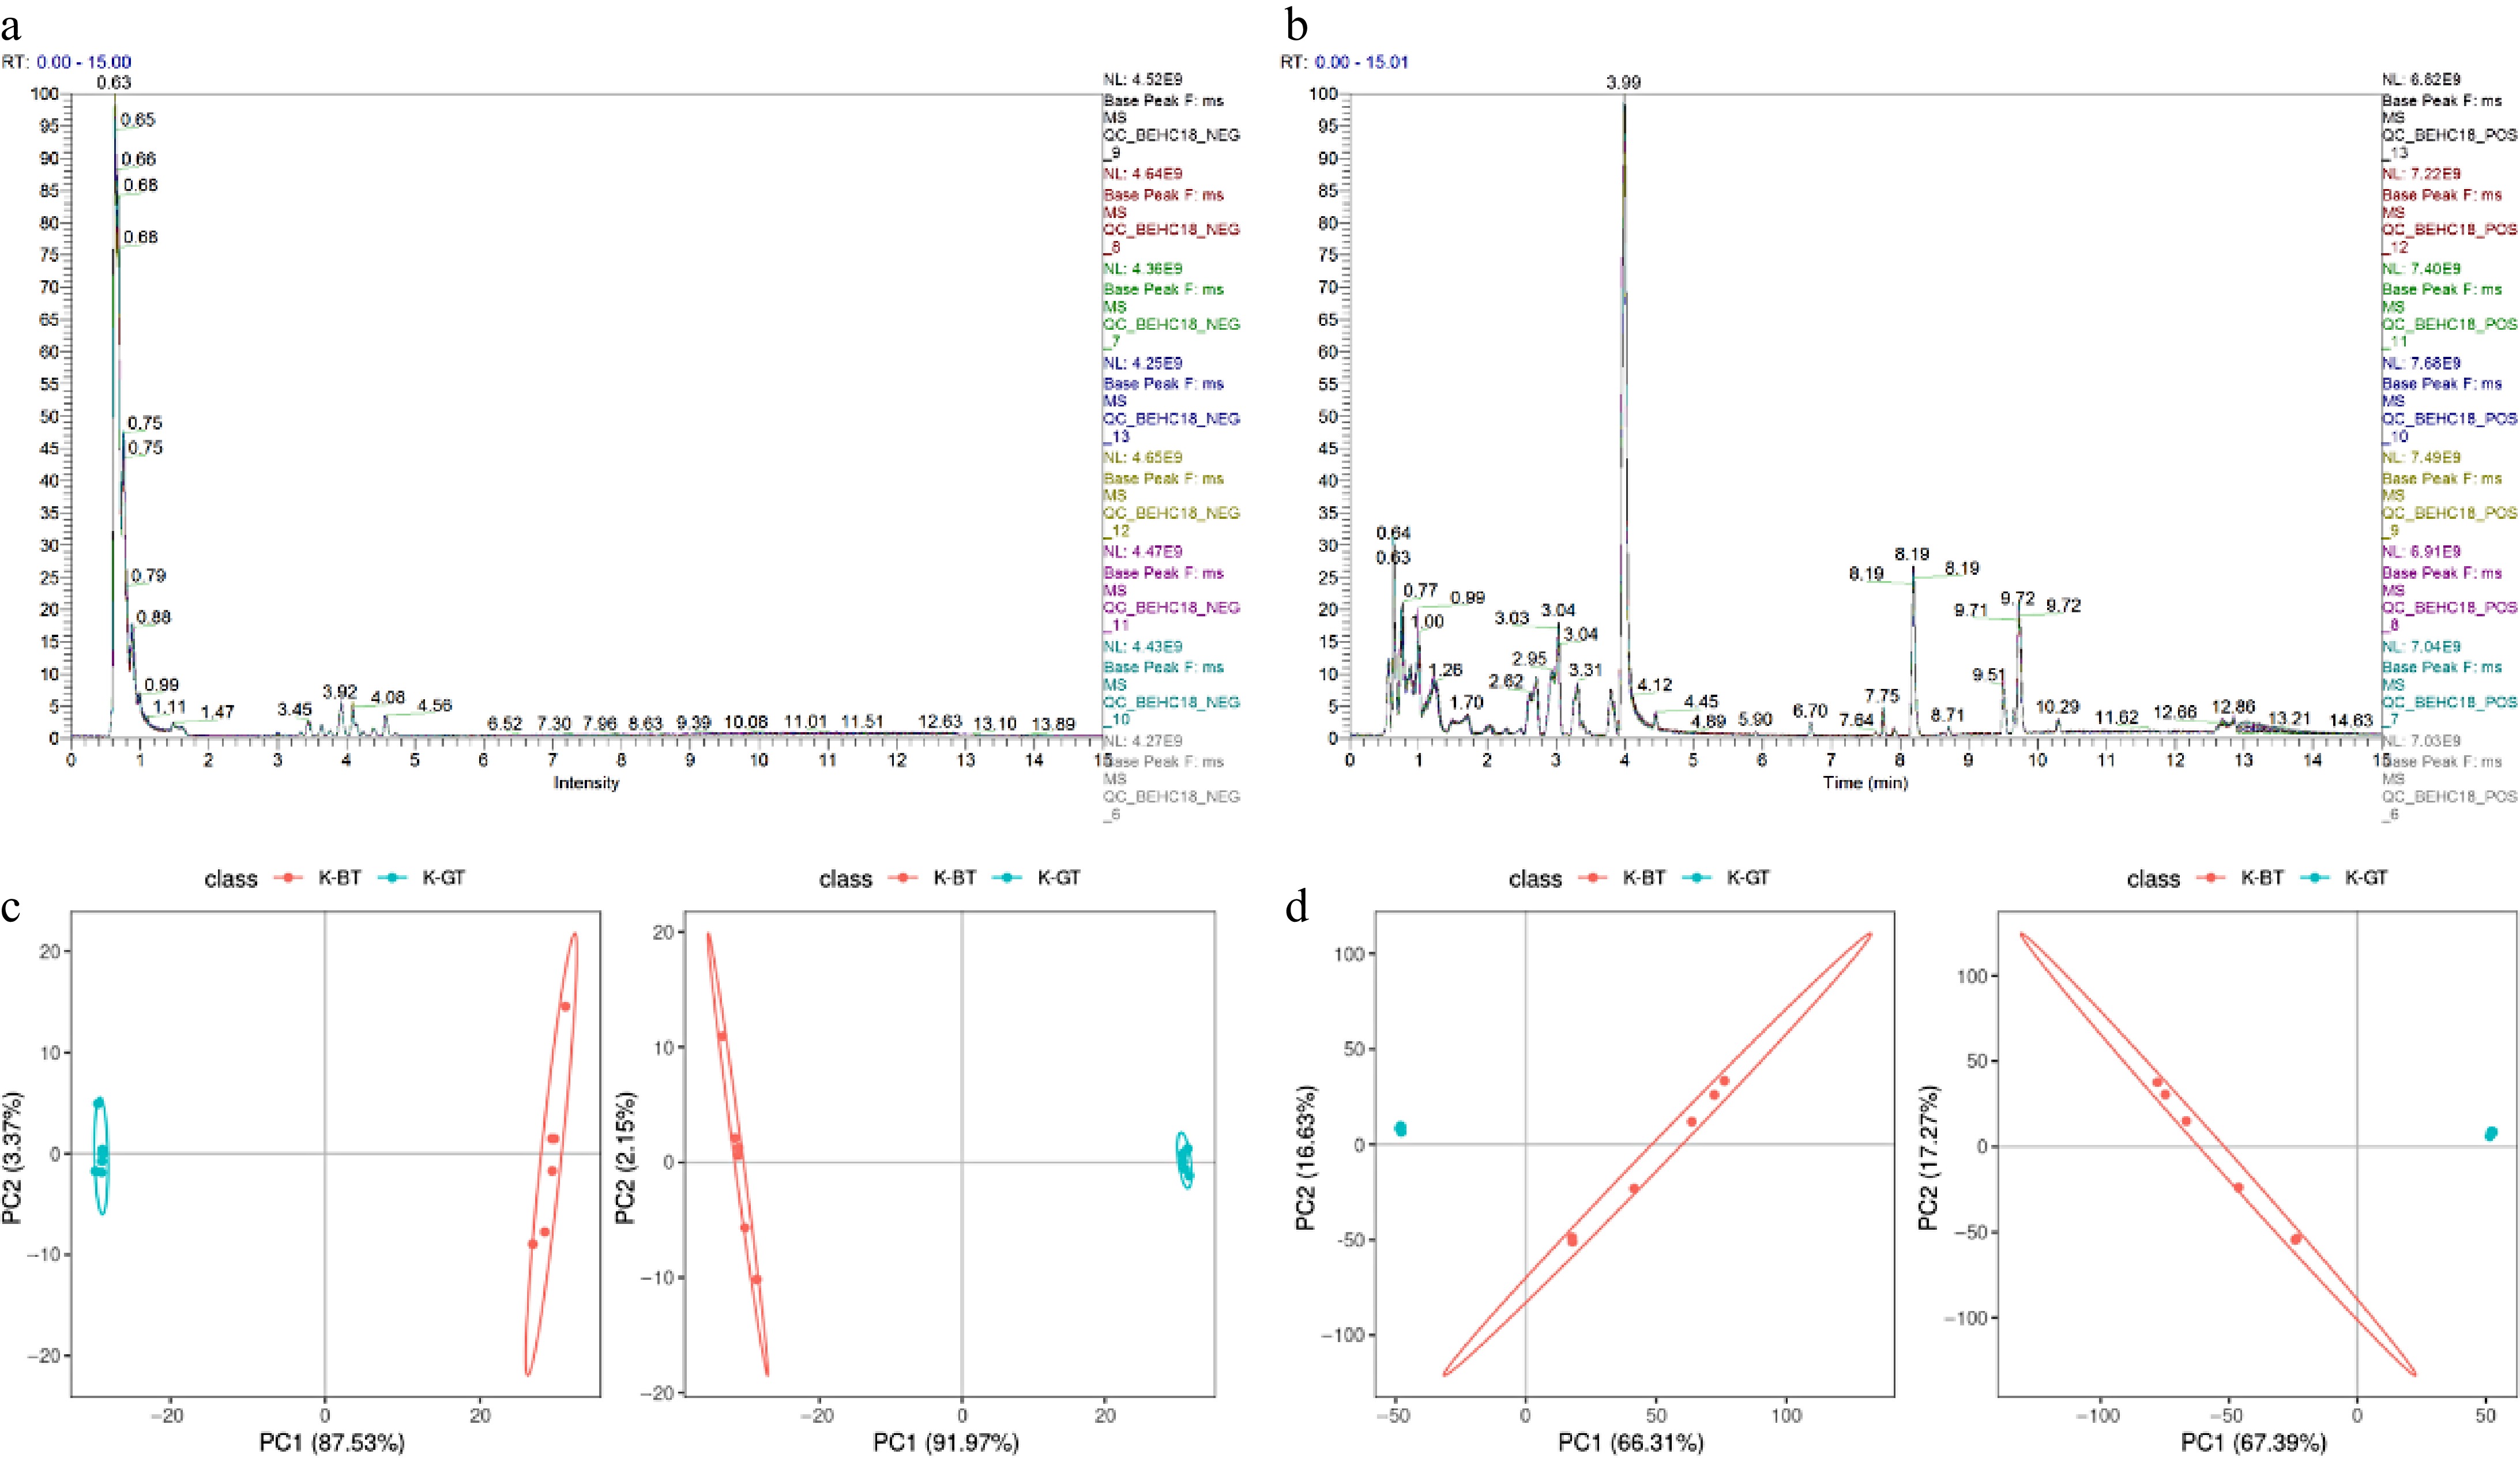
Metabolites from three types of Kombucha were separated and detected using LC-MS/MS in both positive and negative ion modes. The base peak chromatograms (BPCs) of all quality control samples in positive and negative ion detection modes are shown in Fig. 4a and b, indicating good reproducibility and stability of the analysis. Principal Component Analysis (PCA) and Partial Least Squares Discriminant Analysis (PLS-DA) were employed to explore the correlation between K-GT and K-BT groups. The results demonstrate that PCA and PLS-DA effectively distinguish between samples from different groups in both positive and negative ion modes (Fig. 4c & d).
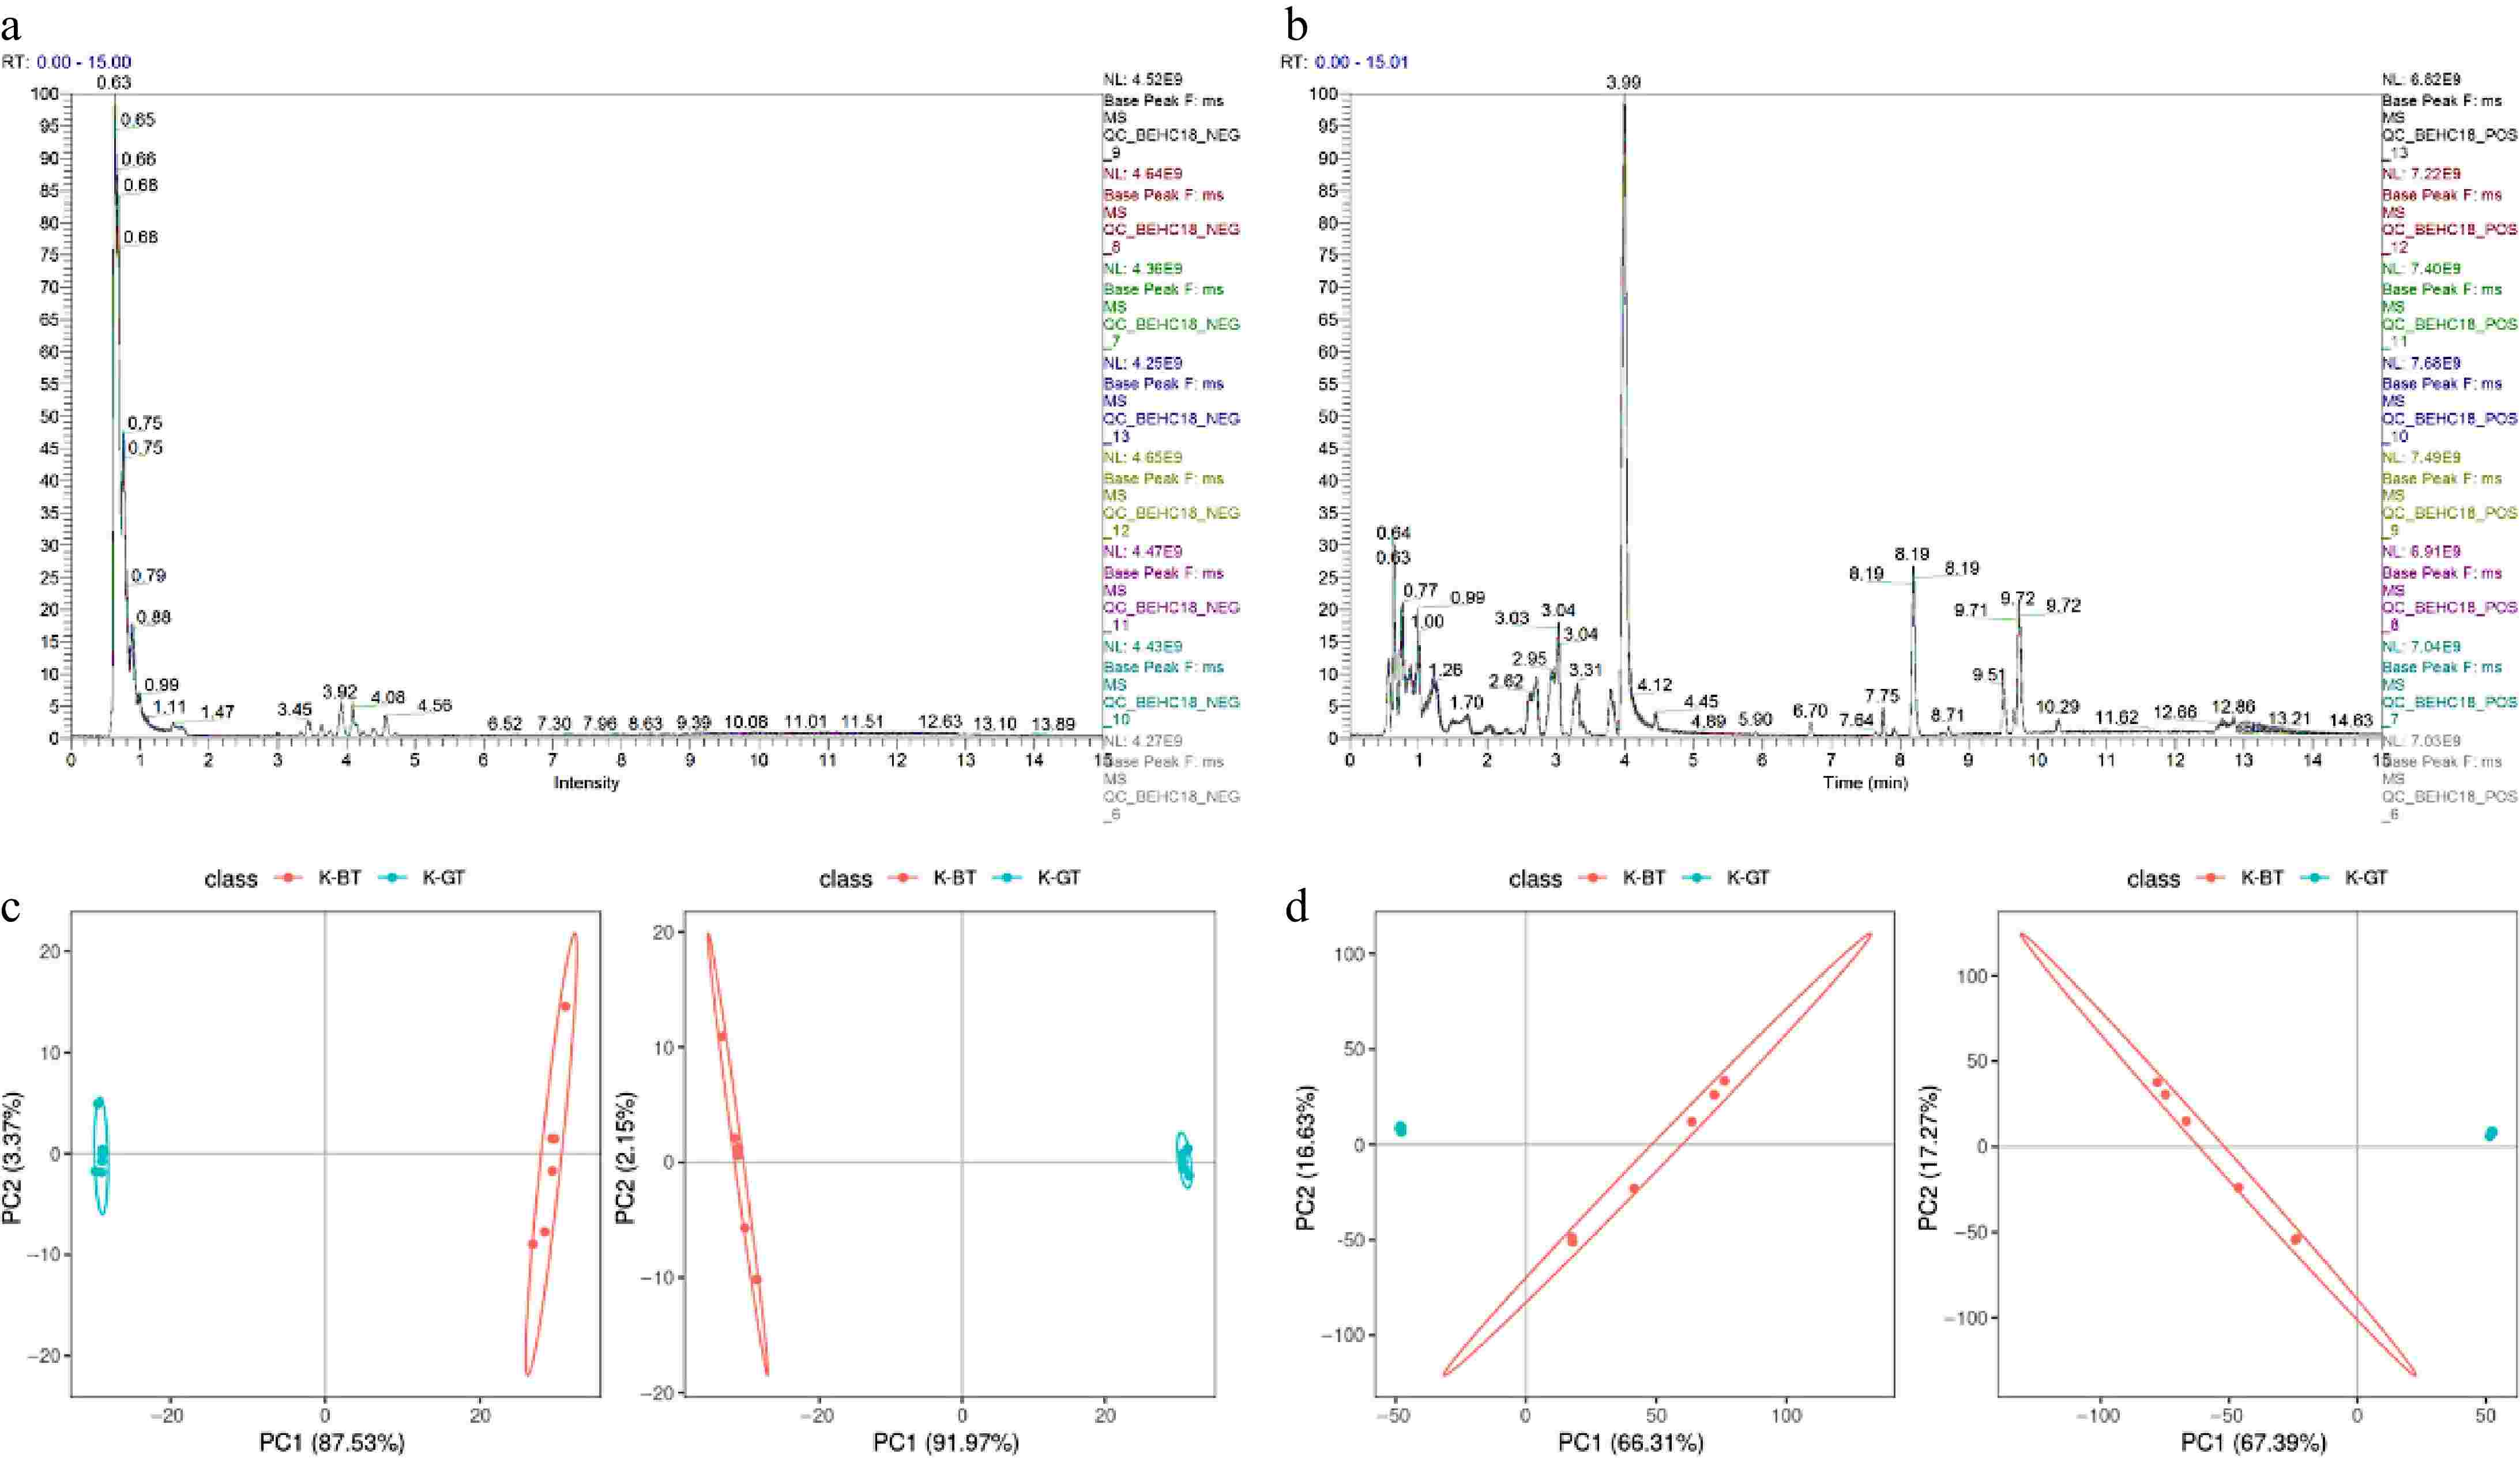
Figure 4.
Non-targeted metabolomic data analysis of different types of Kombucha. (a), (b) Overlay of base peak chromatograms (BPCs) in negative and positive ion modes for QC samples. (c), (d) PCA and PLS-DA score plots depicting the analysis models between K-GT and K-BT groups.
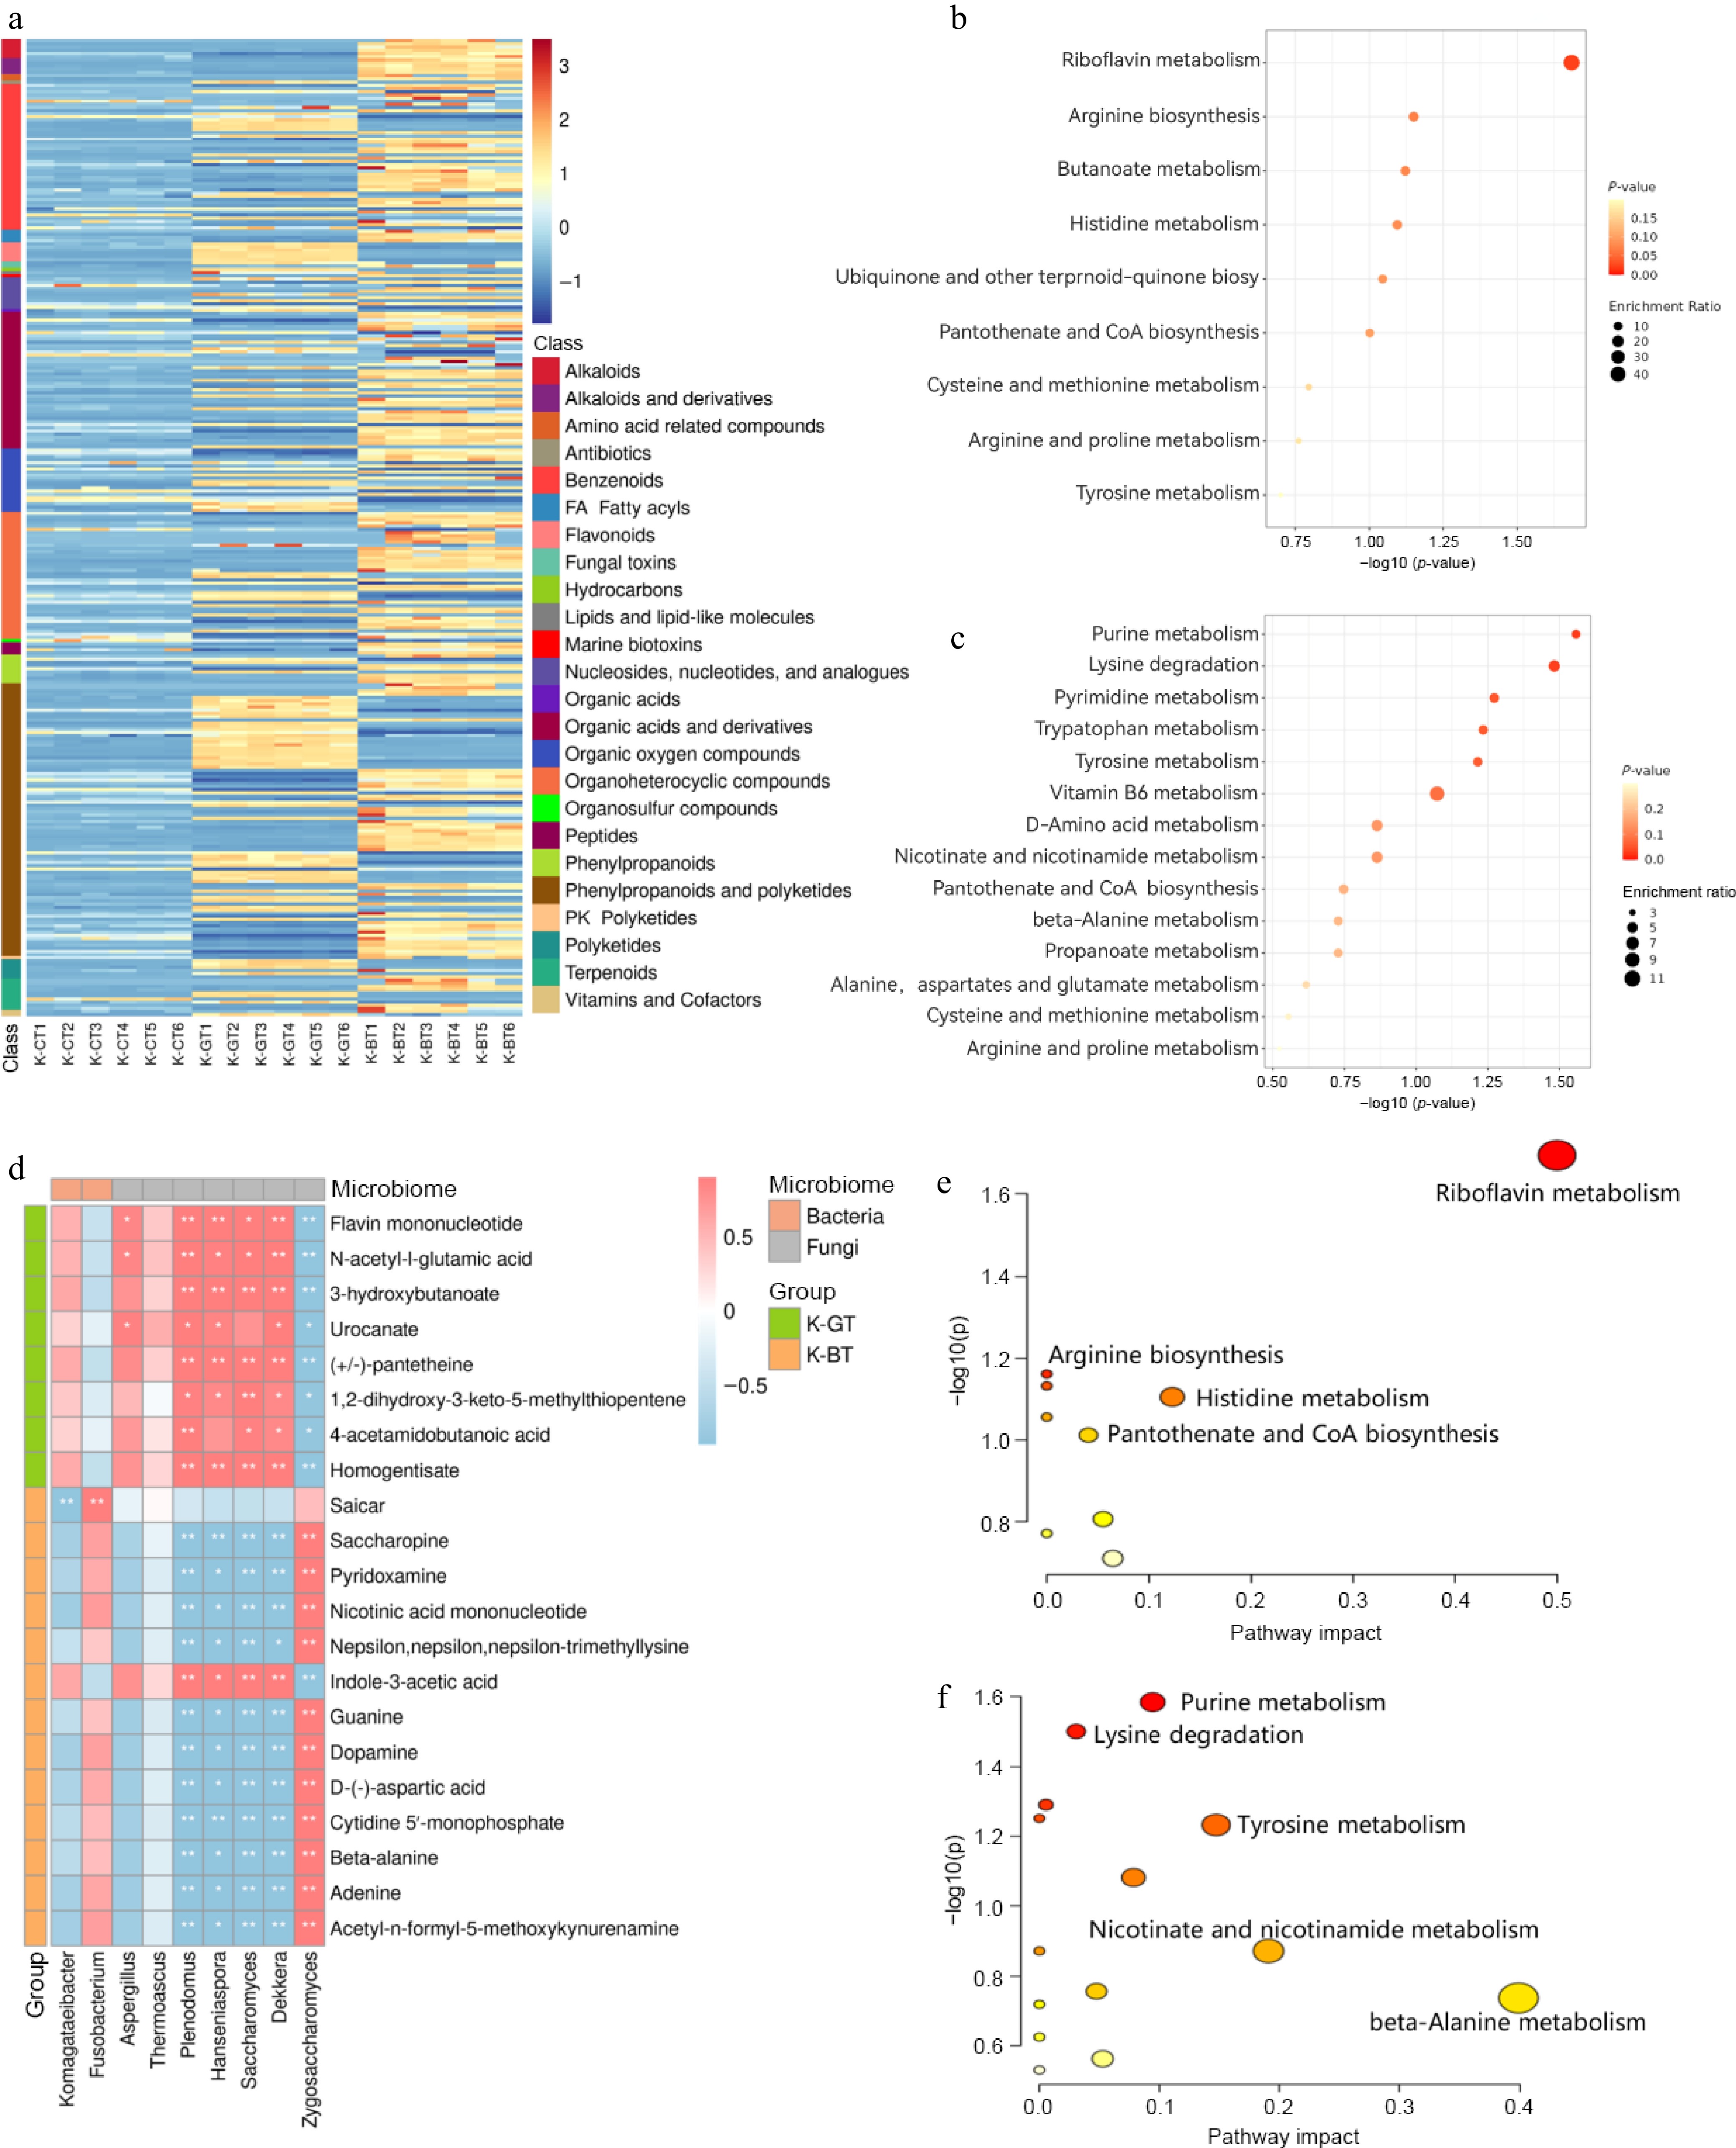
The heatmap analysis of differential metabolites shows that, according to the secondary classification standards of the HMDB database, 120 upregulated metabolites were identified in K-GT, primarily including 41 phenylpropanoids and polyketides, 17 benzenoids, 12 organic acids and derivatives, 11 organic oxygen compounds, and 11 organoheterocyclic compounds. In contrast, 188 upregulated metabolites were identified in K-BT, primarily including 45 phenylpropanoids and polyketides, 31 organic acids and derivatives, 29 organoheterocyclic compounds, and 29 benzenoids. Compared to K-GT, K-BT may produce more amino acids, peptides, purines, and pyrimidines in terms of abundance and diversity (Fig. 5a).

Figure 5.
Differential metabolite analysis of K-GT and K-BT fermentation liquids. (a) Heatmap of differential metabolites. (b) KEGG enrichment analysis of differential metabolites in K-GT. (c) KEGG enrichment analysis of differential metabolites in K-BT. (d) Correlation analysis between key metabolites and microorganisms in K-GT and K-BT. The top 10 key metabolites enriched in KEGG from the differential metabolites of K-GT and K-BT were analyzed for Pearson correlation with bacterial and fungal species. The x-axis represents bacterial and fungal genera, and the y-axis represents key metabolites. Red and blue indicate positive and negative Pearson correlation coefficients (r), respectively. * and ** denote significance levels of 0.01 < p < 0.05 and 0.001 < p < 0.01, respectively. (e), (f) Cluster analysis scatter plots of metabolites obtained from the correlation analysis in the K-GT and K-BT groups, respectively.
KEGG functional clustering analysis of differential metabolites in the fermentation liquids of K-GT and K-BT revealed that K-GT's differential metabolites were mainly enriched in 11 pathways (Fig. 5c). Pearson correlation coefficients analysis of these key metabolites with strains showed that K-GT was associated with eight major microbial metabolites, including flavin mononucleotide, N-acetyl-L-glutamic acid, 3-hydroxybutanoate, urocanate, homogentisate, (+/−)-pantetheine, 1,2-dihydroxy-3-keto-5-methylthiopentene, and 4-acetamidobutanoic acid (Fig. 5d). These metabolites were significantly enriched in pathways such as riboflavin metabolism, arginine biosynthesis, histidine metabolism, and pantothenate and CoA biosynthesis (Fig. 5e). These metabolites were significantly associated with the bacterium Komagataeibacter and fungi Dekkera, Saccharomyces, Hanseniaspora, Plenodomus, and Aspergillus (Fig. 5d).
In addition, K-BT's differential metabolites were mainly enriched in 21 pathways (Fig. 5c). Pearson correlation coefficients analysis of the top ten pathways' differential metabolites with strains identified 13 microbial metabolites, including Saicar, saccharopine, pyridoxamine, nicotinic acid mononucleotide, Nepsilon,nepsilon,nepsilon-trimethyllysine, indole-3-acetic acid, guanine, dopamine, D-(−)-aspartic acid, cytidine 5'-monophosphate, beta-alanine, adenine, and acetyl-n-formyl-5-methoxykynurenamine. These metabolites were primarily enriched in pathways such as purine metabolism, lysine degradation, tyrosine metabolism, nicotinate and nicotinamide metabolism, and beta-alanine metabolism (Fig. 5f). These metabolites were significantly associated with the bacterium Komagataeibacter and Fusobacterium, as well as fungi Zygosaccharomyces, Dekkera, Saccharomyces, Hanseniaspora, Plenodomus, Thermoascus, and Aspergillus (Fig. 5d). The results suggest that there may be mutually promoting relationships between these microorganisms and metabolites.
Network pharmacology analysis of differential metabolites
-
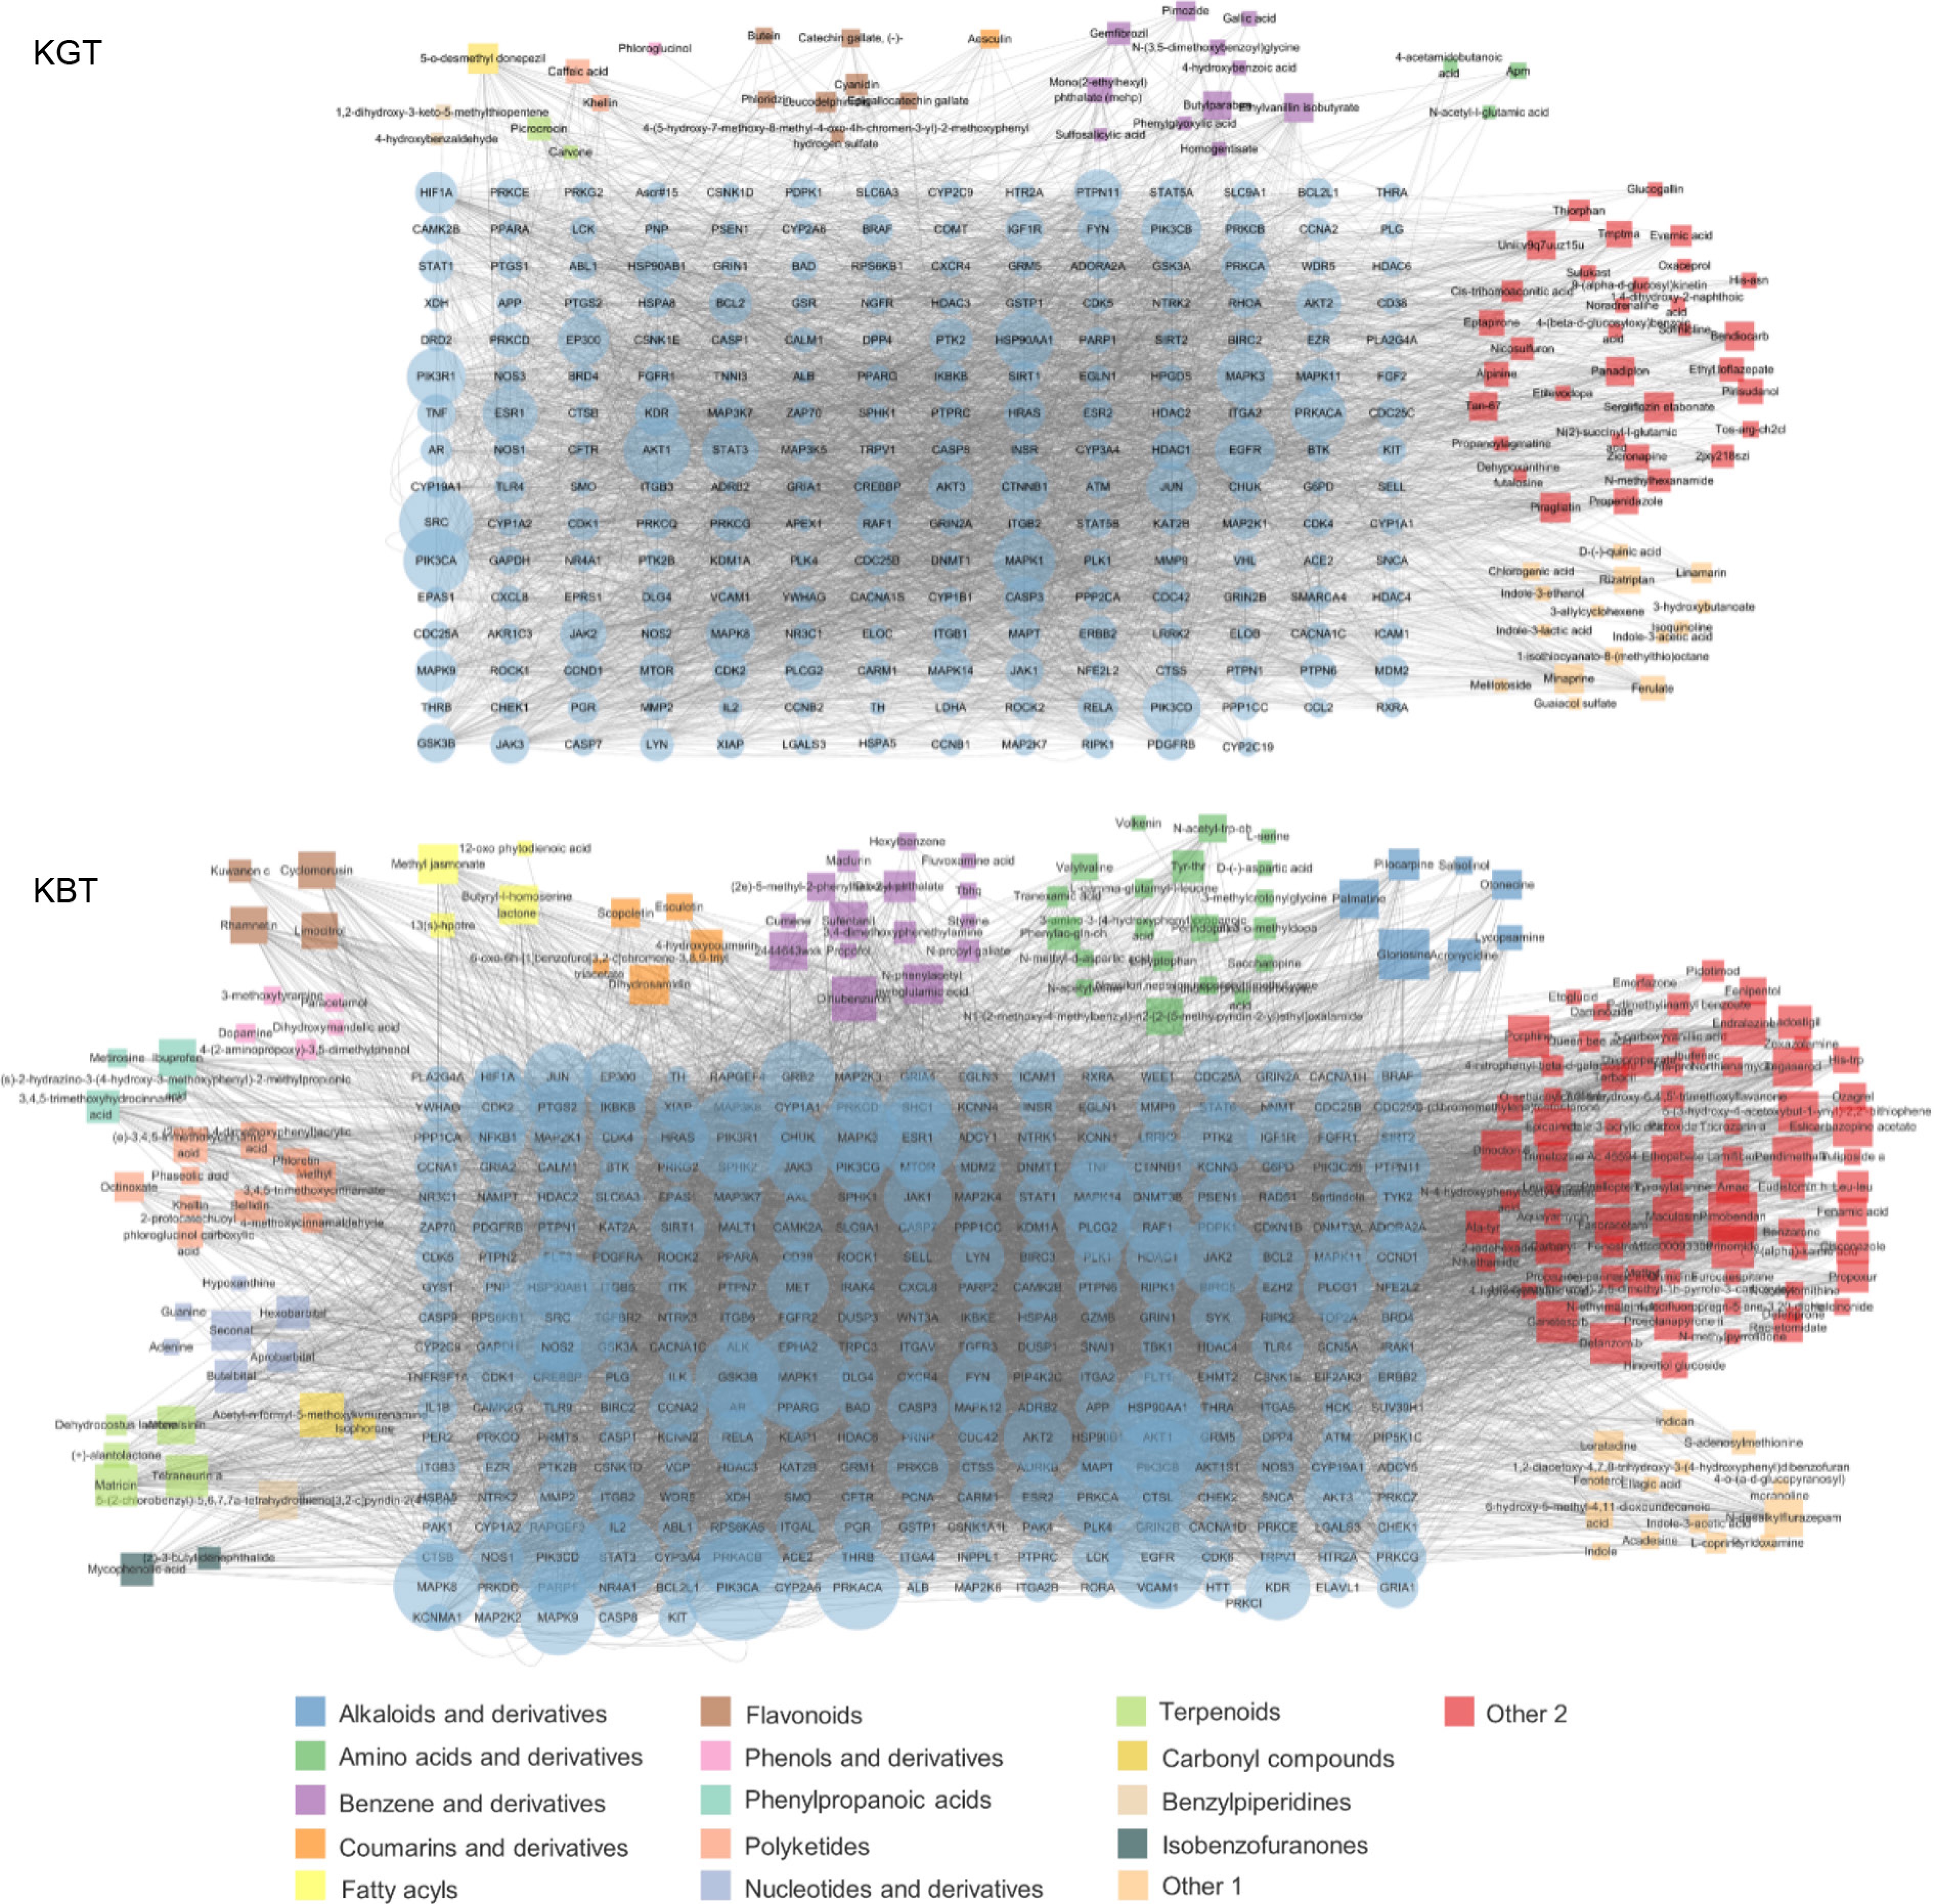
Based on the results of the active ingredient association analysis from the protein-protein interaction (PPI) network (Fig. 6a), key active ingredients were selected using Degree Centrality (DC) greater than the median of 10, Betweenness Centrality (BC) greater than the median of 0.000683, and Closeness Centrality (CC) greater than the median of 0.243137255. In the PPI network, the active ingredients of green tea Kombucha (K-GT) included 300 nodes and 3,954 edges, involving a total of 79 bioactive components. These mainly included 11 types of benzene and its derivatives, seven types of flavonoids, three types of indoles and their derivatives, two types of organic acids, two types of terpenes, two types of alcohols, two types of amino acids and their derivatives, two types of carbohydrates, two types of carbonyl compounds, two types of polyketides, one type of amines and their derivatives, one type of phenols and their derivatives, and 24 other types. Based on the degree of connectivity, important active ingredients in K-GT are benzene and its derivatives, flavonoids, and some components in other categories (Fig. 6a).

Figure 6.
Key bioactive components, key target genes, and PPI network diagrams for (a) K-GT, and (b) K-BT. Note: Circles represent target genes, with their size and color intensity indicating the degree of connectivity to active components and their importance in the network. Squares represent active components, with their size proportional to the number of connected target genes. The network topology analysis based on connectivity determined the core bioactive components and key target genes for K-GT and K-BT.
Using Degree Centrality (DC) greater than the median of 10, Betweenness Centrality (BC) greater than the median of 0.000329272, and Closeness Centrality (CC) greater than the median of 0.241144057 as criteria, the active ingredients in the PPI network of black tea Kombucha (K-BT) included 492 nodes and 3,251 edges, involving a total of 183 active ingredients. The main components included 20 types of amino acids and their derivatives, 15 types of benzene and its derivatives, 10 types of polyketides, seven types of alkaloids and their derivatives, five types of terpenes, five types of phenols and their derivatives, four types of flavonoids, four types of fatty acids, four types of coumarins and their derivatives, four types of pyrimidines and their derivatives, three types of purines and their derivatives, two types of carbohydrates, two types of carbonyl compounds, two types of isobenzofuranones, one type of organic acid, and 95 other types. Based on the degree of connectivity, important active ingredients include amino acids and their derivatives, benzene and its derivatives, polyketides, alkaloids, and some components in other categories (Fig. 6b).
Sensory evaluation of Kombucha
-
Compared with the K-C group, both K-GT and K-BT up-regulated more differential metabolites. Among them, there are more small-molecule active substances that are easy to be absorbed by the human body, including catechins and their polymers, flavonoids and glycosides, amino acids, alkaloids, soluble sugars, etc., which indicates that the use of tea as the substrate not only makes the taste of Kombucha sweet and sour but also increases the active ingredients of Kombucha. K-BT produces more purines and pyrimidines and their derivatives than K-GT, which may be the reason for K-BT's unique bubble sensation.
The fermentation process of Kombucha primarily involves three major microbial groups: acetic acid bacteria, yeast, and lactic acid bacteria. Among them, representatives of acetic acid bacteria include Gluconacetobacter, Acetobacter, and Komagataeibacter[24]. These strains are capable of producing bacterial cellulose similar to plant cellulose. Due to its excellent properties in adsorption capacity, mechanical strength, purity, and water retention ability, bacterial cellulose has high practical value. This study found that compared to K-BT, the K-GT group exhibited thicker biofilms and a higher proportion of bacterial cellulose-producing strains. This indicates that green tea-based Kombucha is more favorable for bacterial cellulose production, highlighting its potential advantage in this aspect.
Different types of tea leaves significantly influence the microbial structure of Kombucha. Previous studies commonly identified Gluconacetobacter as the dominant genus of acetic acid bacteria in Kombucha. However, Komagataeibacter, a genus newly classified from Gluconacetobacter[25,26], is widely utilized in industrial production due to its high acid production capacity, which contributes to the sour taste of Kombucha. Additionally, this study detected the presence of Fusobacterium for the first time, which has not been reported in previous research. We found that Fusobacterium was most abundant in the K-BT and K-CT groups, while its presence was minimal in the K-GT group. Fusobacterium is a type of bacteria that produces butyric acid, commonly found in fermented tofu and is known to inhibit the production of propionic acid by propionic acid bacteria[27]. Compared to K-GT, the microbial communities in K-BT were more diverse, possibly due to the broad-spectrum antibacterial properties inherent in green tea itself[28].
Through ITS sequencing analysis of eukaryotes in Kombucha, we identified a notably dominant fungal genus in K-BT—Saccharomyces. In contrast, the fungal population distribution in K-GT was more evenly spread. Additionally, Aspergillus was detected in all three sample groups. Kaashyap et al. also reported the presence of this fungus in Kombucha samples[29]. This fungus is commonly found in fermented foods like wine and vinegar, often in significant quantities. Aspergillus plays a pivotal role in breaking down raw materials, particularly starch and proteins, thereby increasing the concentrations of sugars and amino acids over time[30,31].
Through predictions of microbial community gene functions, we found that functional gene abundance in the K-BT group generally exceeded that of the other two groups. From a health perspective, microbial functions related to metabolism were predominantly enriched in pathways such as carbohydrate metabolism, cofactor and vitamin metabolism, amino acid metabolism, and terpenoid and polyketide metabolism. These metabolic pathways not only facilitate host digestion and nutrient absorption but also contribute to the supplementation of vitamins and amino acids, maintaining the host's health equilibrium. Furthermore, heightened lipid metabolism significantly enhances the functions of the immune system, endocrine system, and digestive system, aiding in regulating the host's lipid metabolism, immune response, and digestive functions.
Through untargeted metabolomics analysis, this study detected the functional components in Kombucha. Organic acids produced during Kombucha fermentation include not only acetic acid but also lactic acid, citric acid, gluconic acid, and their esters, among others[20]. Some of these organic acids have shown efficacy in protecting the intestines[32] and exhibiting in vitro antimicrobial activity[33]. Polyphenols, abundant antioxidants in diets, play a crucial role in preventing various diseases associated with oxidative stress, such as cancer, cardiovascular diseases, and neurodegenerative diseases[34]. Alkaloids in Kombucha primarily originate from tea leaves, predominantly caffeine, which has energizing effects[35,36]. Amino acids, produced through tea leaves and yeast fermentation, possess diverse physiological activities such as neuroprotection[37], blood pressure reduction[38], and immune system enhancement[39].
The KEGG enrichment analysis results indicate that the main enriched pathways in K-BT include ubiquinone and other terpenoid-quinone biosynthesis, riboflavin metabolism, and amino acid metabolism. Enriched metabolites primarily consist of amino acids, peptides, benzoic acids and derivatives, pyrimidines, purines, and their derivatives. Typically, various amino acids such as phenylalanine are key compounds involved in ubiquinone and other terpenoid-quinone biosynthesis pathways. Furthermore, the precursor GTP for riboflavin biosynthesis is provided by the purine metabolism pathway, suggesting that amino acids, pyrimidines, and purines are crucial active components in K-BT.
Network pharmacology results indicate that black tea Kombucha (K-BT) may contain more active components that protect intestinal homeostasis, warranting further investigation. These findings reveal that the selection of different tea raw materials significantly impacts the compound composition and functionality of Kombucha. Tea, as the fermentation substrate for Kombucha, not only enhances sensory qualities but also introduces a variety of beneficial health-promoting compounds. Black tea Kombucha is rich in active substances and prebiotic components, enhancing its flavor profile and providing scientific support for its use as a health beverage.
-
This study systematically explores the influence of different tea bases on the flavor, metabolic composition, and microbial distribution of Kombucha. The results demonstrate that the choice of tea base largely determines the final quality and characteristics of Kombucha. This provides valuable insights for further optimizing Kombucha fermentation techniques and selecting suitable tea bases for producing fermented beverages or efficiently producing bacterial cellulose. However, there are still gaps in understanding the detailed mechanisms of substance transformation during fermentation in this study. Future research should focus on investigating the effects of different tea leaf materials on Kombucha fermentation broth and bacterial cellulose membrane production, offering new perspectives for promoting the high-value utilization of tea resources.
Guangxi Tea Research Station (TS202106), the authors extend their heartfelt gratitude for the financial support from the National Key R&D Program of China (2018YFC1604405), the National Natural Science Foundation of China (31471590, 31100501), and the Natural Science Foundation of Hunan Province, China (2019jj50237).
-
The authors confirm contribution to the paper as follows: conceptualization, investigation, writing-original draft preparation: Yuan J, Nie Q, Pan W; resources, funding acquisition, supervision, writing–review: Liu Z, Wu J, Liu Z, Cai S. All authors reviewed the results and approved the final version of the manuscript.
-
All data generated or analyzed during this study are included in this published article and its supplementary information files.
-
The authors declare that they have no conflict of interest.
- Supplementary Tables S1 Results of sensory assessment of tea base and Kombucha.
- Supplementary Tables S2 Tea base and Kombucha flavor assessment results.
- Copyright: © 2025 by the author(s). Published by Maximum Academic Press, Fayetteville, GA. This article is an open access article distributed under Creative Commons Attribution License (CC BY 4.0), visit https://creativecommons.org/licenses/by/4.0/.
Yuan J, Nie Q, Pan W, Liu Z, Wu J, et al. 2025. Microbial composition, bioactive compounds, and sensory evaluation of Kombucha prepared with green tea and black tea. Beverage Plant Research 5: e011 doi: 10.48130/bpr-0025-0001


|