ARTICLE   Open Access    

Effects of magnetic field pretreatment and chloride salt stress on physio-biochemical changes and γ-aminobutyric acid accumulation in germinated brown rice

More Information
  • Germinated brown rice is a staple food with high nutritional value and market prospects. Gamma-Aminobutyric Acid (GABA), abundantly present in germinated brown rice, has attracted significant attention due to its multiple active functions on the human body. This study aimed to enrich GABA in germinated brown rice by using static magnetic field pretreatment and NaCl, CaCl2 and KCl stress. After selecting Nanjing9108, which had the highest GABA content among the nine cultivars, a single-factor experiment was conducted and optimized the pretreatment condition as 10 mT static magnetic field for 40 min. Under this condition, the GABA content in brown rice germinated for 36 h was 66.35 mg/100 g, which was 13.88% higher than the control group. Simultaneously, the germination rate and early growth of germinated brown rice were also promoted. The optimal combination of culture medium for GABA enrichment obtained by response surface experimental design was NaCl 37.23 mmol/L, CaCl2 4.71 mmol/L, and KCl 5.75 mmol/L, with a GABA content of 69.783 mg/100 g. Under this condition, the changes in nutrients and the expression of glutamic acid decarboxylase (GAD) and GABA transaminase (GABA-T) related genes during the 0-48 h germination process of brown rice were studied. The relative expression of GAD was promoted and the relative expression of GABA-T was inhibited, resulting in the accumulation of GABA. This indicates that the combination of static magnetic field and salt treatment is an effective method to increase the GABA content in germinated brown rice.
  • Agricultural management practices impact soil physicochemical properties to a remarkable extent. Degradation of soil health has led to a contraction in agricultural production and soil biodiversity particularly due to conventional farming practices, indiscriminate use of inorganic fertilizers (INF) and inadequate input of residues[1]. Organic or inorganic fertilizers have been regarded as a critical component of agriculture to accomplish global food security goals[2]. The exogenous supply of fertilizers could easily alter soil properties by restoring the nutrients that have been absorbed by the plants[2]. Thus, implementing adequate nutrient management strategies could boost plant yield and sustain plant health. Tillage affects the soil, especially for crop production and consequently affects the agro-ecosystem functions. This involves the mechanical manipulation of the soil to modify soil attributes like soil water retention, evapotranspiration, and infiltration processes for better crop production. Thus, tillage practices coupled with fertilizer inputs may prove a viable strategy to improve soil health components such as nutrient status, biodiversity, and organic carbon.

    Soil serves as a major reservoir of nutrients for sustainable crop production. Intensive cultivation due to growing population burden has led to the decline of soil nutrient status that has adversely affected agricultural production. Various researchers have assessed the soil nutrient budget and the reasons behind decline of nutrient content in soil[3]. Soil management strategies have assisted in overcoming this problem to a greater extent. Tillage practices redistribute soil fertility and improve plant available nutrient content due to soil perturbations[4]. Different tillage and fertilization practices alter soil nutrient cycling over time[5]. Fertilization is an important agricultural practice which is known to increase nutrient availability in soil as well as plants[6]. A report has been compiled by Srivastava et al.[7], which assessed the effectiveness of different fertilizers on soil nutrient status in Indian soils.

    Soil biota has a vital role in the self-regulating functions of the soil to maintain soil quality which might reduce the reliance on anthropogenic activities. Soil microbial activities are sensitive to slight modifications in soil properties and could be used as an index of soil health[8]. Maintenance of microbial activity is essential for soil resilience as they influence a diverse range of parameters and activities including soil structure formation, soil SOM degradation, bio-geochemical cycling of nutrients etc.[9]. Various researchers have identified microbial parameters like microbial biomass carbon (MBC), potentially mineralizable nitrogen (PMN), soil respiration, microbial biomass nitrogen (MBN), and earthworm population as potential predictors of soil quality. Geisseler & Scow[10] have compiled a review on the affirmative influence of long-term mineral fertilization on the soil microbial community.

    Being the largest terrestrial carbon (C) reservoir, soil organic carbon (SOC) plays a significant role in agricultural productivity, soil quality, and climate change mitigation[11]. Manure addition, either solely or along with INF augments SOC content which helps in the maintenance and restoration of SOM more effectively as compared to the addition of INF alone[12]. Enhancement of recalcitrant and labile pools of SOC could be obtained through long-term manure application accentuating the necessity of continuous organic amendments for building up C and maintaining its stability[13]. Generally, compared with manure addition, INF application is relatively less capable of raising SOC and its labile fractions[14]. Alteration in SOC content because of management strategies and/or degradation or restoring processes is more prominent in the labile fraction of soil C[15]. Several fractions of soil C play vital roles in food web and nutrient cycles in soils besides influencing many biological properties of soil[16]. Thus, monitoring the response of SOC and its fractions to various management practices is of utmost importance.

    A positive impact on SOC under manure application coupled with INF in rice-wheat systems has been reported, as compared to sole applications of INFs[17]. Although ploughing and other mechanical disturbances in intensive farming cause rapid OM breakdown and SOC loss[18], additional carbon input into the soil through manure addition and rational fertilization increases carbon content[13]. Wei et al.[19] in light sandy loam soil of China found that the inclusion of crop straw together with inorganic N, P and K fertilizers showed better results for improving soil fertility over sole use of inorganic fertilizers. Zhu et al.[20] studied the influence of soil C through wheat straw, farmyard manure (FYM), green manure, and rice straw on plant growth, yield, and various soil properties and found that the recycling of SOM under intensive cultivation is completely reliant on net OM input and biomass inclusion. However, most of the studies on residue management and organically managed systems could not provide clear views regarding the relations between the quality of OM inputs and biological responses towards it. The disintegration of soil aggregates due to ploughing, use of heavy machinery, and residue removal has been reported widely under conventional tillage (CT) practices[21]. On the contrary, improvement in SOC stabilization has also been observed by some scientists[22]. Under CT, the disintegration of macro-aggregates into micro-aggregates is a prominent phenomenon, while conservation tillage has been identified as a useful practice for increasing macro-aggregates as well as carbon sequestration in agricultural soils[23]. By and large, the ploughing depth (0–20 cm) is taken into consideration for evaluating the impact of tillage and straw retention on soil aggregation[24], while degradation in deeper layers of soil is becoming a major constraint towards soil quality together with crop yield[25].

    Hence, the present review would be useful in determining how tillage practices and inorganic and organic fertilization impact nutrient availability in the soil, microbial composition and SOC fractions besides stocks under different land uses.

    Agricultural production is greatly influenced by nutrient availability and thus nutrient management is required for sustaining higher yields of crop. The term 'nutrient availability' refers to the quantity of nutrients in chemical forms accessible to plant roots or compounds likely to be converted to such forms throughout the growing season in lieu of the total amount of nutrients in the soil. For optimum growth, different crops require specifically designed nutrient ratios. Plants need macronutrients [nitrogen (N), phosphorus (P), potassium (K) in higher concentrations], secondary nutrients [calcium (Ca), magnesium (Mg), sulphur (S) in moderate amounts as compared to macronutrients] and Micronutrients [Zn (zinc), Fe (iron), Cu (copper), B (boron), Mn (manganese), Mo (molybdenum) in smaller amounts] for sustainable growth and production[26]. Fertilizers assist the monitoring of soil nutrient levels by direct addition of required nutrients into the soil through different sources and tillage practices may alter the concentration of available plant nutrients through soil perturbations. Various studies on the influence of fertilization and tillage practices on available plant nutrients have been discussed below.

    Yue et al.[27] reported that long-term fertilization through manure/INF improved the macronutrient content of Ultisol soil in China. Two doses of NPK (2NPK) considerably improved soil properties over a single dose (NPK). Combined application (NPK + OM) resulted in higher hydrolysable N and available P over the sole OM application. The total K content was higher under the treatments NPK, 2NPK and NPK + OM than sole OM treatment, whereas available K was higher in treatments NPK + OM and 2NPK over the sole OM and NPK. Likewise, OM, INF, and OM + INF were evaluated for their potential to regulate the soil macronutrient dynamics. Organic manure significantly improved the soil N content, whereas INF showed comparable results to that of the control treatment. Besides, all the treatments improved available P and exchangeable K concentration[28].

    Hasnain et al.[29] performed comparative studies of different ratios of INF + compost and different application times for the chemical N fertilizer on silty loamy soils of China. The available nitrogen and phosphorous content were greater in conjoint OM + INF application over the bare INF and control application irrespective of N application time. Soil quality substantially improved with increasing ratio of compost and 70:30 (INF to compost ratio) was found to be most suitable to maintain soil fertility and nutrient status. Another study by Liu et al.[30] reported the superior effects of NPK + pig manure and NPK + straw to improve soil available P and K over the control and sole NPK treatments. However, total N concentration did not exhibit any significant variation under any treatment.

    Shang et al.[31] accounted the positive impact of vermicompost and mushroom residue application on grassland soil fertility in China. The addition of organic manures improved available P and K content to a considerable extent. Under moisture-deficit winter wheat-fallow rotation, another study quantified the influence of residue management approaches and fertilizer rate on nutrient accrual. Residue burning resulted in no decline in soil macronutrient content, whereas the perpetual addition of FYM for 84 years significantly improved total N and extractable K and P concentration. Thus, residue incorporation along with FYM application may prove beneficial in reducing the temporal macronutrient decline[32].

    Ge et al.[33] examined the effects of NPK and NPK along with manure (NPKM) addition on the macronutrient status of Hapli-Udic Cambisol soil. The NPKM application resulted in the highest increase in total N, available-P and K concentration as compared to NPK and control. Likewise, mineral fertilization reduction and partial substitution with organic amendments have posed a significant influence on soil macronutrient status. Soil available P and K decreased after INF reduction[34]. Chen et al.[35] evinced that integrated application of manure and mineral fertilizers to red clay soil (typical Ultisols) improved hydrolyzed nitrogen and available P due to an increase in the decomposition of organic matter (OM) and N bio-fixation than sole mineral fertilizers and control.

    A long-term experiment was carried out out by Shiwakoti et al.[36] to ascertain the influence of N fertilization and tillage on macronutrient dynamics in soil. Nitrogen fertilization produced higher crop biomass which might have improved total N and P concentration in soil. Moreover, the reduced interaction between soil colloids and residue or greater cation exchange sites due to tillage practices could have augmented K concentration in 0−10 cm soil depth. Likewise, among tillage systems combined organic (poultry manure) and inorganic (lime and fertilizers) fertilization, no-tillage, and reduced tillage with organic fertilization resulted in higher availability of P owing to minimal disturbance of soil which decreases contact surface between phosphate ions and adsorption sites. Greater losses of K in runoff water under NT resulted in lower K availability under NT than CT[37].

    The influence of tillage systems on soil nutrient dynamics showed that minimal soil disturbances under zero tillage prohibited redistribution of soil nutrients and resulted in the highest available N, P, and K in the surface soil[38]. The influence of tillage timing on soil macronutrient status has also been assessed under tillage treatments that are fall tillage (FT), spring tillage (ST), no tillage (NT), and disk/chisel tillage (DT/CT) on mixed mesic Typic Haploxerolls soil. All the tillage systems differed in the quantity of residues generated. Thus, variation in the decomposition of crop residue and mineralization of SOM resulted in variable rates of nutrient release. The FT and ST had the highest N content over DT/CT and NT systems at corresponding depth. The N content also decreased with soil depth irrespective of tillage treatment. The available P and extractable K were highest under NT at the top 10 cm soil depth and increased over time[39]. Residue management in combination with tillage treatments (ST and CT) has been reported to affect the soil macronutrient status in Bangladesh. Tillage treatments enhanced the total N content to a considerable extent. Moreover, 3 years of residue retention led to a higher concentration of total N, available P and K in the soil.

    The combinations of N, P, and K in different ratios together with two rates of organic fertilizer (OF) applied on the aquic Inceptisol having sandy loam texture influenced the micronutrient status of the soil[40]. Soil Zn content decreased with time when no fertilizer was applied as compared to organic fertilizer (OF) application. The mineral fertilizer treatments led to a substantial increase in DTPA-extractable micronutrients in the soil. The higher micronutrient concentration due to higher OM highlights the importance of maintaining OM for soil fertility and higher crop production. Further studies revealed that long-term application of sole N fertilizers led to a significant decline in total Zn and Cu, whereas Mn and Fe status improved through atmospheric deposition. Phosphorus and OF addition along with straw incorporation markedly increased total Zn, Cu, Fe, and Mn. The DTPA-extractable Mn, Zn, Fe, and Cu were also higher in OF treatment, thus demonstrating the beneficial effects of constant OM application for maintaining the nutrient status of soil[41].

    López-Fando & Pardo[42] quantified the impact of various tillage practices including NT, CT, minimum tillage (MT), and zone-tillage (ZT) on soil micronutrient stocks. Tillage systems did exhibit a significant influence on plant available Fe stocks in the topsoil; however, diminished with depth under ZT, NT and MT. Manganese was higher in NT and ZT at all depths and increased with soil depth. Zinc was highest under NT and other results did not vary significantly as in the case of Cu. The SOC levels were also found to be responsible to affect micronutrients due to tillage practices. Likewise, in Calciortidic Haploxeralf soil the distribution of soil micronutrients (Zn, Mn, Fe, Cu) was ascertained under different tillage practices (CT, MT, and NT). The micronutrient status was highest under NT in the upper layers due to the higher SOC level[43].

    Sharma & Dhaliwal[44] determined that the combined application of nitrogen and rice residues facilitated the transformation of micronutrients (Zn, Mn, Fe, Cu). Among different fractions, the predominant fractions were crystalline Fe bound in Zn, Mn, and Cu and amorphous Fe oxide in Fe with 120 kg N ha˗1 and 7.5-ton rice residue incorporation. The higher content of occluded fractions adduced the increment in cationic micronutrient availability in soil with residue incorporation together with N fertilization due to increased biomass. Rice straw compost along with sewage sludge (SS) and INF also affected the micronutrient availability under the RW cropping system. Nitrogen fertilization through inorganic fertilizers and rice straw compost and sewage sludge (50% + 50%) improved soil micronutrient status due to an increase in SOM over sole NPK fertilizers[45]. Earlier, Dhaliwal et al.[46] in a long-term experiment determined that different combinations of NPK along with biogas slurry as an organic source modified the extractable micronutrient status of the soil.

    A comparative study was carried out by Dhaliwal et al.[47] to ascertain the long-term impact of agro-forestry and rice–wheat systems on the distribution of soil micronutrients. The DTPA-extractable and total Cu, Zn, Fe, and Mn were greater in the RW system due to the reduced conditions because of rice cultivation. Under the RW system Zn removal was higher which was balanced by continuous Zn application. The higher availability of Fe under the RW system was due to reduced conditions. Contrarily, Mn was greater under the agro-forestry system owing to nutrient recycling from leaf litter.

    The long-term impact of integrated application of FYM, GM, WCS (wheat-cut straw) and INF on the soil micronutrients (Zn, Mn, Cu, and Fe) have been studied by Dhaliwal et al.[48]. The FYM application substantially improved DTPA-extractable Zn status followed by GM and WCS, whereas Cu content was maximum in the plots with OM application. The highest Fe concentration was recorded in treatment in which 50% recommended N supplied through FYM. This could be ascribed to the release of micronutrients from OM at low soil pH.

    Shiwakoti et al.[49] studied the dual effects of tillage methods (MP, DP, SW) and variable rates of N (0, 45, 90, 135 and 180 kg ha−1) on the distribution of micronutrients under a moisture-deficit winter wheat-fallow system. The soil Mn content was highest under the DP regime. Inorganic N application reduced Cu content in the soil. Comparative studies with adjacent undisturbed grass pasture indicated the loss of Zn and Cu to a significant extent. Thus, DP along with nitrogen added through inorganic fertilizers could improve micronutrient concentration in the soil. Moreover, the results implied that long-term cultivation with nitrogen fertilization and tillage results in the decline of essential plant nutrients in the soil. Thus, organic amendments along with INF may prove an effective approach to increase soil micronutrient content. In another study conducted by Lozano-García & Parras-Alcántara[50] tillage practices such as NT under apple orchard, CT with the wheat-soybean system and puddling (PD) in the rice-rice cropping system were found to affect nutrient status. Under CT, Cu content was lowest and Zn content was highest. On the contrary, puddling caused an increase in Fe and Mn concentration owing to the dispersion of soil aggregates which reduced the percolation of water and created an anaerobic environment thereby enhancing the availability of Fe and Mn.

    Tillage practices along with gypsum fertilization have been known to affect secondary nutrient concentrations in soil. In a long-term experiment, FYM application showed maximum response to increased S concentration due to the maximum addition of OM through FYM over other treatments as S is an essential component of OM and FYM[32]. Higher Mg content was recorded in FYM and pea vine treatments because the application of organic matter through organic manure or pea vines outright led to Mg accrual. The lower Mg concentration in topsoil than the lower layers was due to the competition between Mg and K for adsorbing sites and thus displacement of Mg by K. Han et al.[28] while ascertaining the impact of organic manures and mineral fertilizers (NPK) on soil chemical attributes determined that INF application reduced exchangeable calcium, whereas no significant changes were exhibited in the magnesium concentrations. The OM application significantly increased both the calcium and magnesium concentrations in the soil.

    While ascertaining the effect of different tillage treatments such as CT, NT, and MT on exchangeable and water-soluble cations, Lozano-García & Parras-Alcántara[50] recorded that NT had greater content of exchangeable Ca2+ and Mg2+ than MT and CT. The exchangeable Ca2+ decreased with depth, however, opposite results were observed for Mg2+ which might be due to the higher uptake of Mg2+ by the crop. On another note, there might be the existence of Mg2+-deficient minerals on the surface horizon. Alam et al.[51] studied the temporal effect of tillage systems on S distribution in the soil and observed that available S was 19%, 31%, and 34% higher in zero tillage than in minimum tillage, conventional tillage, and deep tillage, respectively.

    Kumar et al.[38] appraised the impact of tillage systems on surface soil nutrient dynamics under the following conditions: conventional tillage, zero till seeding with bullock drawn, conventional tillage with bullock drawn seeding, utera cropping and conservation tillage seeding with country plough and observed that tillage had a significant impact on the available S content. Compared with conventional tillage, zero and minimum tillage had higher S content as there was none or limited tillage operations which led to the accumulation of root stubble in the soil that decomposed over time and increased S concentration.

    Soil is considered a hotspot for microbial biodiversity which plays an important role in building a complex link between plants and soil. The microbial components exhibit dynamic nature and, therefore, are characterized as good indicators of soil quality[52]. These components include MBC, MBN, PMN and microbial respiration which not only assist in biological transformations like OM conversion, and biological nitrogen fixation but also increase nutrient availability for crop uptake. Management strategies such as fertilizer inputs and tillage practices may exert beneficial effects on soil biota as discussed below.

    Soil is an abode to a considerable portion of global biodiversity. This biodiversity not only plays a pivotal role in regulating soil functions but also provides a fertile ground for advancing global sustainability, especially agricultural ventures. Thus, the maintenance of soil biodiversity is of paramount importance for sustaining ecosystem services. Soil biodiversity is the diverse community of living creatures in the soil that interact not only with one another but also with plants and small animals to regulate various biological activities[53]. Additionally, it increases the fertility of soil by converting organic litter to SOM thereby enhancing SOC content. Thus, the SOM measures the number and activity of soil biota. Furthermore, the quality and amount of SOC, as well as plant diversity have a considerable impact on the soil microbial community structure[54].

    Dangi et al.[55] ascertained the impact of integrated nutrient management and biochar on soil microbial characteristics and observed that soil amended with biochar or the addition of organic manures influenced microbial community composition and biomass and crop yield. After two years, the higher rates of biochar significantly enhanced the levels of gram-positive and gram-negative bacterial phospholipid fatty acid (PLFA), total arbuscular mycorrhizal fungal (AMF) than lower rates, unfertilized and non-amended soil. Luan et al.[56] conducted a comparison study in a greenhouse to assess the effects of various rates of N fertilizer and kinds (inorganic and organic) on enzyme activities and soil microbial characteristics. Microbial growth (greater total PLFAs and microbial biomass carbon) and activity were promoted by manure substitution of mineral fertilizer, particularly at a higher replacement rate. On account of lower response in bacterial over fungal growth, manure addition led to a greater fungi/bacteria ratio. Furthermore, manure application significantly enhanced microbial communities, bacterial stress indicators and functional diversity. Lazcano et al.[57] determined the influence of different fertilization strategies on microbial community structure and function, soil biochemical properties and crop yield three months after addition of fertilizer. The integrated fertilizer regimes augmented microbial growth with improved enzyme activity as compared to sole inorganic amendments. Bacterial growth showed variable response with variation in fertilizer regime used whereas fungal growth varied with the amount of fertilizer added. Compared to mineral fertilizers, manure application led to a rapid increase in PLFA biomarkers for gram-negative bacteria. The organic amendments exhibited significant effects even at small concentration of the total quantity of nutrients applied through them; thus, confirming the viability of integrated fertilizer strategies in the short term.

    Kamaa et al.[58] assessed the long-term effect of crop manure and INF on the composition of microbial communities. The organic treatments comprised of maize (Zea mays) stover (MS) at 10 t ha−1 and FYM @ 10 t ha−1, INF treatments (120 kg N, 52.8 kg P-N2P2), integrated treatments (N2P2 + MS, N2P2 + FYM), fallow plot and control. The treatment N2P2 exhibited unfavourable effects on bacterial community structure and diversity that were more closely connected to the bacterial structure in control soils than integrated treatments or sole INF. In N2P2, fungal diversity varied differently than bacterial diversity but fungal diversity was similar in the N2P2 + FYM and N2P2 + MS-treated plots. Thus, the total diversity of fungal and bacterial communities was linked to agroecosystem management approaches which could explain some of the yield variations observed between the treatments. Furthermore, a long-term experiment was performed by Liu et al.[59] to study the efficiency of pig manure and compost as a source for N fertilization and found unique prokaryotic communities with variable abundance of Proteobacteria under compost and pig manure treatments.

    Recently, Li et al.[60] assessed the influence of different tillage practices (no-tillage, shallow tillage, deep tillage, no-tillage with straw retention, shallow tillage with straw retention and deep tillage with straw retention) on microbial communities and observed that tillage practices improved the bacterial Shannon index to a greater extent over the no-tillage plots in which the least value was recorded. Another research study by He et al.[61] reported the effect of tillage practices on enzyme activities at various growth stages. Across all the growth stages, enzyme activities of cellobiohydrolase (CBH), β-xylosidase (BXYL), alkaline phosphatase (AP), β-glucosidase (BG), β-N-acetylglucosamines (NAG) were 17%−169%, 7%−97%, 0.12%−29%, 3%−66%, 23%−137% greater after NT/ST, NT, ST, ST/PT, and PT/NT treatments as compared to plow tillage. The NT/ST treatment resulted in highest soil enzyme activities and yield, and thus was an effective and sustainable method to enhance soil quality and crop production.

    Microbes play a crucial role in controlling different soil functions and soil ecology and microbial community show significant variation across as well as within the landscape. On average, the total biomass of microbes exceeds 500 mg C kg soil−1[62]. Microbial biomass carbon is an active constituent of SOM which constitutes a fundamental soil quality parameter because SOM serves as a source of energy for microbial processes and is a measure of potential microbial activity[48,63]. Soil systems that have higher amounts of OM indicate higher levels of MBC. Microbial biomass carbon is influenced by many parameters like OM content in the soil, land use, and management strategies[64]. The MBC and soil aggregate stability are strongly related because MBC integrates soil physical and chemical properties responds to anthropogenic activities.

    Microbial biomass is regarded as a determinative criterion to assess the functional state of soil. Soils having high functional diversity of microbes which, by and large, occurs under organic agricultural practices, acquire disease and insect-suppressive characteristics that could assist in inducing resistance in plants[65]. Dou et al.[66] determined that soil microbial biomass C (SMBC) was 5% to 8% under wheat-based cropping systems and zero tillage significantly enhanced SMBC in the 0−30 cm depth, particularly in the upper 0 to 5 cm. According to Liang et al.[67], SMBC and soil microbial biomass N (SMBN) in the 0−10 cm surface layer were greater in the fertilized plots in comparison to the unfertilized plots on all sampling dates whereas microbial biomass C and N were highest at the grain filling stage. Mandal et al.[68] demonstrated that MBC also varied significantly with soil depth. Surface soil possessed a maximum MBC value than lower soil layers due to addition of crop residues and root biomass on the surface soil. The MBC content was highest with combined application of INF along with farmyard manure and GM, whereas untreated plots showed minimum MBC values. The incorporation of CR slows down the rate of mineralization processes; therefore, microbes require more time to decompose the residues and utilize the nutrients released[69]. On the other hand, incorporation of GR having a narrow C:N ratio enhances microbial activity and consequently accelerates mineralization in the soil. Malviya[70] also recorded that the SMBC contents were significantly greater under RT than CT, regardless of soil depth which was also assigned to residue incorporation which increases microbial biomass on account of higher carbon substrate in RT.

    Naresh et al.[71] studied the vertical distribution of MBC under no-tillage (NT), shallow (reduced) tillage and normal cultivated fields. A shallow tillage system significantly altered the tillage induced distribution of MBC. In a field experiment, Nakhro & Dkhar[72] examined the microbial populations and MBC in paddy fields under organic and inorganic farming approaches. The organic source used was a combination of rock phosphate, FYM and neem cake, whereas a mixture of urea, muriate of potash and single super phosphate was used as an inorganic source. The organically treated plots exhibited the highest MBC compared to inorganically treated plots and control. Organic carbon exhibited a direct and significant correlation with bacterial and fungal populations. The addition of organic fertilizers enhanced the content of SOC and consequently resulted in higher microbial count and MBC. Ramdas et al.[73] investigated the influence of inorganic and organic sources of nutrients (as minerals or INF) applied over a five-year period on SOC, MBC and other variables. It was observed that the addition of FYM and conjoint application of paddy straw (dry) and water hyacinth (PsWh) (fresh) significantly increased the SOC content than vermicompost, Chromolaena adenophorum (fresh) and Glyricidia aculeate (fresh), and Sesbania rostrata (fresh).

    Xu et al.[74] evaluated the influence of long-term fertilization strategies on the SOC content, soil MBN, soil MBC, and soil microbial quotient (SMQ) in a continuous rice system and observed that MBC at the main growth stages of early and late rice under 30% organic matter and 70% mineral fertilizer and 60% organic matter and 40% mineral fertilizer treatments was greater as compared to mineral fertilizer alone (MF), rice straw residues and mineral fertilizer (RF), and no fertilizer (CK) treatments. However, SMBC levels at late growth stages were greater in comparison to early growth stages. A recent study by Xiao et al.[75] demonstrated that increasing tillage frequency (no-tillage, semi-annual tillage, and tillage after every four months, two months, and one month) decreased soil MBC. Microbial biomass carbon content was significantly greater in no-till treatment (597 g kg−1) than in tillage every four months (421 g kg−1), two months (342 g kg−1) and one month (222 g kg−1). The decrease in the content of MBC in association with tillage practices is due to soil perturbations which enhanced soil temperature, diminished soil moisture content, and resulted in the destruction of microbial habitat and fungal hyphae. Therefore, the MBC content eventually affected the N cycle.

    Li et al.[76] reported that in comparison to CT, NT and RT resulted in increased MBC content and NT significantly increased MBC by 33.1% over CT. Furthermore, MBC concentration was 34.1% greater in NT than RT. The increase in MBC concentration was correlated with the results of increase in SOC concentration. Site-specific factors including soil depth and mean annual temperature significantly affected the response ratio of MBC under NT as compared to the duration of NT.

    Microbial biomass nitrogen (MBN) is a prominent indicator of soil fertility as it quantifies the biological status of soil. Soil MBN is strongly associated with organic matter of the soil. The nitrogen in MBN has a rapid turnover rate thereby reflecting the changes in management strategies way before the transformations in total N are discernable[77].

    In an experiment on continuous silage maize cultivation with crop rotation, Cerny et al.[78] observed that organic fertilizers exerted an affirmative influence on the soil MBN. During the application of organic manure MBN decreased, but there was higher MBN content as compared to control. However, addition of mineral nitrogenous fertilizers exerted an adverse effect on MBN content in experiments with maize. El-Sharkawi[79] recorded that organic matter-treated pots resulted in maximum MBN content than urea-treated pots. The sludge application enhanced total MBN and, therefore, could implicitly benefit crop production particularly in poor soils[18]. Sugihara et al.[80] observed that during the grain-filling stage in maize, residue and/or fertilizer addition exerted a pronounced influence on soil microbial dynamics; however, a clear effect of residue and ⁄or fertilizer addition was not observed. Microbial biomass nitrogen reduced dramatically from 63–71 to 18–33 kg N ha˗1 and C:N ratio at the same time increased more than ten-fold in all plots.

    Malik et al.[81] apprised that the organic amendments significantly enhanced MBN concentrations up to 50% more than the unamended soil. Wang et al.[82] evaluated the influence of organic materials on MBN content in an incubation and pot experiment with acidic and calcareous soils. The results revealed that MBN content which was affected by the different forms of organic amendments, increased by 23.37%−150.08% and 35.02%−160.02% in acidic and calcareous soils, respectively. The MBN content of both soils decreased with the increase in the C/N ratio of the organic materials, though a higher C/N ratio was effective for sustaining a greater MBN content for a very long time.

    Dhaliwal & Bijay-Singh[52] observed higher MBN levels in NT soils (116 kg ha−1) than in cultivated soils (80 kg ha−1). Kumar et al.[83] ascertained that in surface layer, MBN content was 11.8 mg kg−1 in CT which increased to 14.1 and 14.4 mg kg−1 in ZT and RT without residue retention and 20.2, 19.1 and 18.2 mg kg−1 in ZT, RT and CT with residue incorporation, respectively (Table 1). In the subsurface layer, the increased tendency on account of tillage and crop residue retention was identical to those of 0−15 cm layer but the magnitude was comparatively meagre (Table 1). In comparison to control, the persistent retention of crop residues led to significant accrual of MBN in the surface layer.

    Table 1.  Effect of different treatments on contents of various fractions of soil organic carbon[38].
    TreatmentsPMN (mg kg−1)MBC (mg kg−1)MBN (mg kg−1)DOC (mg kg−1)
    Depths (cm)
    0−1515−300−1515−300−1515−300−1515−30
    Tillage practices
    ZTR12.411.2562.5471.120.218.9198.6183.6
    ZTWR8.57.6350.4302.114.112.6167.1159.2
    RTR10.69.9490.2399.319.117.2186.4171.6
    RTWR7.66.6318.1299.814.413.7159.5148.7
    CTR9.38.5402.9354.418.216.6175.9168.9
    CT6.75.6307.9289.511.89.7142.5134.6
    Nitrogen management
    Control3.62.8218.3202.910.810.4103.792.3
    80 kg N ha−15.34.4241.1199.414.912.2128.3116.9
    120 kg N ha−18.97.6282.7220.916.516.1136.8123.6
    160 kg N ha−19.88.4343.9262.919.418.1164.8148.9
    200 kg N ha−110.49.7346.3269.622.721.7155.7136.4
    ZTR = Zero tillage with residue retention, ZTWR = Zero tillage without residue retention; RTR = Reduced tillage with residue retention, RTWR = Reduced tillage without residue retention, CTR = Conventional tillage with residue incorporation; CT = Conventional tillage without residue incorporation.
     | Show Table
    DownLoad: CSV

    Xiao et al.[75] determined that the MBN content decreased with tillage treatment having highest value in no tillage treatment, however, the difference among the treatments was negligible. Soil perturbations decreased the aggregate size and thus lower the soil aeration and exposure of fresh organic matter which restricted the growth of microorganisms. The results also concluded that MBN content is highly sensitive to tillage. Ginakes et al.[84] assessed the impact of zone tillage intensity on MBN in a corn-kura clover cropping sequence. Microbial biomass nitrogen was influenced by time and type of tillage treatment. Temporal studies revealed that MBN was higher after tillage treatment than the values possessed before tillage. Under different tillage treatments, higher values were recorded in ST (shank-till) and DT (double-till) over NT and RZT (zone-till) treatments.

    Another biological parameter, PMN, is a crucial parameter of soil fertility due to its association with soil N supply for crop growth. Also, PMN indicates the status of soil microbial community associated with PMN, whether it is improving or degrading. Forest soils are characterized by greater levels of PMN than CT receiving conventional chemical fertilizers which could be assignable to improved microbial activity in the former soils than the latter[48,77]. Aulakh et al.[85] assessed the effect of various combinations of fertilizer N, P, FYM and wheat residue (WR) applied to soybean and soybean residues added to wheat under CT and CA. The added fertilizers of N and P, FYM, and crop residue enhanced the mean weight diameter and water-stable aggregates thus favoured the development of macro-aggregates. The treatment INF + FYM + crop residue performed better among all the treatments. The net flux of mineral nitrogen from the mineralizable fraction is used to measure potentially mineralizable N which indicates the balance between mineralization and immobilization by soil microbes[77]. Nitrogen mineralization is widely used to assess the ability of SOM to supply inorganic nitrogen in the form of nitrate which is the most common form of plant-available nitrogen. Kumar et al.[83] observed an increase in PMN which was higher in surface soil than sub-surface soil thereby implying that high OC accumulation on account of crop residue retention was the most probable cause.

    Verma & Goyal[86] assessed the effect of INM and organic manuring on PMN and observed that PMN was substantially affected by different organic amendments. Potentially mineralizable nitrogen varied between 19.6−41.5 mg kg−1 soil with greater quantity (2.5%) in vermicompost applied plots than FYM treated plots. The INF treatments resulted in lower PMN content which could be due to nutrient immobilization by microbes. Mahal et al.[87] reported that no-till resulted in higher PMN content than conventional tillage treatments. This trend was due to the maintenance of SOM due to the residue cover and reduction of soil erosion under no-tillage system[88]. On the contrary, tillage practices led to the loss of SOC owing to loosened surface soil and higher mineralization of SOM.

    Soil respiration is referred as the sum of CO2 evolution from intact soils because of the respiration by soil organisms, mycorrhizae and roots[89]. Various researchers have proposed soil respiration as a potential indicator of soil microbial activity[52,77]. Gilani & Bahmanyar[90] observed that addition of organic amendments enhanced soil respiration more than the control and synthetic fertilizer treatments. Moreover, among organic amendment treatments, highest soil respiration was observed in sewage-sludge treated soils. Under controlled conditions in saline-sodic soil, Celis et al.[91] reported that sewage sludge resulted in a higher soil respiration rate than mined gypsum and synthetic gypsum. The application of gypsum because of minimal organic matter intake had little effect on soil respiration. The addition of organic matter especially during early spring led to higher microbial biomass and soil respiration albeit diminished levels of nitrate-N. Moreover, SOM hinders the leaching of nitrate ions thereby resulting in a better soil chemical environment[71].

    Faust et al.[92] observed that microbial respiration was associated with volumetric water content. The respiration declined with less availability of water, thus the lesser the tillage intensity, the more the volumetric water content which consequently resulted in higher microbial respiration. Another study by Bongiorno et al.[93] reflected the influence of soil management intensity on soil respiration. Reduced tillage practices resulted in 51% higher basal respiration than CT. Furthermore, this investigation suggested that microbial catabolic profile could be used as a useful biological soil quality indicator. Recently, Kalkhajeh et al.[94] ascertained the impact of simultaneous addition of N fertilizer and straw-decomposing microbial inoculant (SDMI) on soil respiration. The SDMI application boosted the soil microbial respiration which accelerated the decomposition of straw due to N fertilization. The C/N ratio did not affect the microbial respiration at elongation and heading stages, whereas N fertilization enhanced the microbial respiration to a greater extent than the unfertilized control. Additionally, the interaction between sampling time and basal N application significantly affected microbial respiration.

    Gong et al.[95] apprised the effect of conventional rotary tillage and deep ploughing on soil respiration in winter wheat and observed that deep ploughing resulted in a higher soil respiration rate than conventional rotary tillage. Soil moisture content and temperature are the dominating agents influencing soil respiration which is restricted by the soil porosity.

    Soil organic carbon plays a vital role in regulating various soil functions and ecosystem services. It is influenced by numerous factors like tillage practices and fertilization. Moreover, modified management practices may prove beneficial to avoid SOC loss by increasing its content. An exogenous supply of fertilizers may alter the chemical conditions of soil and thus result in transformation of SOC. Tillage practices lead to frequent soil disturbances which reduce the size of soil aggregates and accelerate the oxidation of SOC thereby reducing its content. The literature on the influence of fertilization and tillage practices on the transformation of SOC is discussed below.

    Soil organic carbon is a major part of the global carbon cycle which is associated not only with the soil but also takes part in the C cycling through vegetation, oceans and the atmosphere (Figs 1 & 2). Soil acts as a sink of approximately 1,500 Pg of C up to 1 m depth, which is greater than its storage in the atmosphere (approximately 800 Pg C) and terrestrial vegetation (500 Pg C) combined[96]. This dynamic carbon reservoir is continuously cycling in diverse molecular forms between the different carbon pools[97]. Fertilization (both organic and mineral) is one of the crucial factors that impart a notable influence on OC accretion in the soil. Many researchers have studied the soil C dynamics under different fertilizer treatments. Though inorganic fertilizers possess the advantage of easy handling, application and storage, they do not contribute to soil organic carbon. On the contrary, regardless of management method, plant residues are known to increase organic carbon content.

    Figure 1.  Impact of different fertilization regimes on abundance of the microbial biomarker groups . Error bars represent the standard error of the means and different letters indicate significant differences at p < 0.05 among treatments. Source: Li et al.[60].
    Figure 2.  Soil organic carbon (SOC) dynamics in the global carbon cycle.

    Katkar et al.[98] reported a higher soil quality index under conjunctive nutrient management strategies comprising addition of compost and green leaves along with mineral nutrients. Mazumdar et al.[99] investigated the impact of crop residue (CR), FYM, and leguminous green manure (GM) on SOC in continuous rice-wheat cropping sequence over a 25-year period. At the surface layer, the maximum SOC content was recorded under NPK + FYM than NPK + CR and NPK + GM treatments. SOC was significantly lower under sole application of INFs (NPK) than the mixed application of organic and inorganic treatments. A higher range of SOC content was recorded at a depth of 0.6 m in the rice-wheat system (1.8–6.2 g kg−1) in farmyard manure (FYM)-treated plots than 1.7–5.3 g kg−1 under NPK, and 0.9–3.0 g kg−1 in case of unfertilized plots[100]. In a research study Dutta et al.[101] reported that rice residue had a higher decomposition rate (k¼ 0.121 and 0.076 day−1) followed by wheat (0.073 and 0.042 day−1) and maize residues (0.041 day−1) when their respective residues placed on soil surface than incorporated in the soils. Naresh et al.[102] found FYM and dhaincha as GM/ sulphitation press mud (SPM) treatments are potent enough to enhance the SOC. Maximum SOC content was noted in 0–5 cm depth that reduced gradually along the profile. In surface soil, the total organic content (TOC) under different treatments varied with source used to supply a recommended dose of nitrogen (RDN) along with conventional fertilizer (CF).

    Cai et al.[103] ascertained that long-term manure application significantly improved SOC content in different size fractions which followed the sequence: 2,000–250 μm > 250–53 μm > 53 μm fraction. Naresh et al.[22] determined that mean SOC content increased from 0.54% in control to 0.65% in RDF and 0.82% in RDF + FYM treatment and improved enzyme activity; thus, ultimately influenced nutrient dynamics under field conditions. The treatments RDF + FYM and NPK resulted in 0.28 Mg C ha−1 yr−1 and 0.13 Mg C ha−1 yr−1, respectively and thus higher sequestration than control. Zhao et al.[104] determined that in the surface layer, significant increase in SOC content in each soil aggregate was noticed under straw incorporation treatments over no straw incorporated treatments (Fig. 3). Moreover, the aggregate associated OC was significantly higher in the surface layer than the sub-surface layer. The highest increment in aggregate-associated OC was noted in both maize and wheat straw (MR-WR) added plots followed by MR and least in WR. Besides, all of the three straw-incorporated treatments exhibited notable increase in SOC stock in each aggregate fraction in the surface layer of the soil. In the subsurface (20−40 cm) layer under MR-WR, significant rise in SOC stock of small macro-aggregates was observed, whereas there was a reduction in SOC stock in the silt + clay fraction than other treatments. The straw-incorporated treatments increased the quantity of mineral-associated organic matter (mSOM) and intra-aggregate particulate organic matter, (iPOM) within small macro-aggregates and micro-aggregates especially in the topmost layer of the soil.

    Figure 3.  Distribution of OC in coarse iPOM (intra-aggregate particulate organic matter) fine iPOM, mSOM (mineral-associated matter), and free LF (free light fraction) of small macro-aggregates and micro-aggregates in the 0–20 cm and 20–40 cm soil layers under MR-WR (return of both maize and wheat straw), MR (maize straw return), WR (wheat straw return). Different lowercase and uppercase letters indicate significant differences at p < 0.05 among treatments and depths respectively[104].

    Srinivasarao et al.[105] reported that SOC content was reduced with the addition of INFs (100% RDN) alone as compared to the conjunctive application of inorganic and organic or sole FYM treatments. Earlier, Srinivasarao et al.[106] reported that FYM treated plots exhibited greater per cent increase in SOC stock than mineral fertilized plots and control. Tong et al.[107] ascertained that the application of NP and NPK significantly improved SOC stocks. On the contrary, fertilized soils could also exhibit decrease in carbon content than control. Naresh et al.[108] determined that higher biomass C input significantly resulted in greater particulate organic carbon (POC) content. Zhang et al.[109] ascertained that long-term addition of NPK and animal manures significantly improved SOC stocks by a magnitude of 32%−87% whereas NPK and wheat/ and or maize straw incorporation enhanced the C stocks by 26%−38% than control. Kamp et al.[110] determined that continuous cultivation without fertilization decreased SOC content by 14% than uncultivated soil. However, super optimum dose of NPK, balanced NPK fertilization and integration of NPK with FYM not only improved SOC content but also SOC stocks over the first year. In conventionally tilled cotton-growing soils of southern USA, Franzluebbers et al.[111] estimated that carbon sequestration averaged 0.31 ± 0.19 Mg C ha−1 yr−1. Mandal et al.[112] reported maximum SOC stock in the surface layer of the soil (0–15 cm) which progressively diminished with depth in each land use system. A significant decrease in SOC stock along the profile depth was also observed by Dhaliwal et al.[47] in both croplands and agroforestry. In the topmost soil layer, highest SOC stock was recorded in rice–fallow system while the lowest was in the guava orchard[112].

    Nath et al.[113] determined that there was accrual of higher TOC in surface layers as compared to lower layers of soil under paddy cultivation. This accrual could be adduced to left-over crop residues and remnant root biomass which exhibited a decreasing trend with soil depth. Das et al.[114] determined that integrated use of fertilizers and organic sources resulted in greater TOC as compared to control or sole fertilizer application. Fang et al.[115] observed that the cumulative carbon mineralization differed with aggregate size in top soils of broad-leaved forests (BF) and coniferous forests (CF). However, in deep soil it was greater in macro-aggregates as compared to micro-aggregates in BF but not in CF (Fig. 4). By and large, the percent SOC mineralized was greater in macro-aggregates as compared to micro-aggregates. Dhaliwal et al.[100] ascertained that SOC accrual was considerably influenced by residue levels and tillage in surface soil (0−20 cm); albeit no variation was observed at lower depth (20−40 cm). The SOC content was greater in zero-tilled and permanently raised beds incorporated with residues as compared to puddled transplanted rice and conventionally planted wheat. Pandey et al.[116] reported that no-tillage prior to sowing of rice and wheat increased soil organic carbon by 0.6 Mg C ha–1 yr–1. The carbon sequestration rate on account of no-tillage or reduced tillage ranged between 0−2,114 kg ha–1 yr–1 in the predominant cropping system of South Asia, Xue et al.[117] observed that the long-term conventional tillage, by and large, exhibited a significant decline in SOC owing to degradation of soil structure, exposing protected soil organic matter (intra-soil aggregates) to microbes. Therefore, the adoption of no-tillage could hamper the loss of SOC thereby resulting in a greater or equivalent quantity of carbon in comparison to CT (Fig. 5).

    Figure 4.  (a) Soil aggregate fractions of two depths in two restored plantations of subtropical China, (b) organic carbon and (c) its mineralization from various soil aggregates within 71 d at various soil depths in two restored plantations of subtropical China. Error bars show the standard error of the mean. The different letters represent significant differences among the different soil aggregate fractions within a depth at p < 0.05[115].
    Figure 5.  The concentrations of (a) SOC, (b) total nitrogen (TN), and (c) soil C:N ratio for 0–50 cm profile under different tillage treatments in 2012 and 2013. NT = no-till with residue retention; RT = rotary tillage with residue incorporation; PT = plow tillage with residue incorporation; and PT0 = plow tillage with residue removed. The lowercase letters indicate statistical difference among treatments at p < 0.05[117].

    Singh et al.[118] determined that carbon stock in the 0-40 cm layer increased by 39, 35 and 19% in zero-tilled clay loam, loam, and sandy loam soils, respectively as compared to conventional tilled soils over a period of 15 years. Kuhn et al.[119] also apprised about the advantages of NT over CT vis-a-vis SOC stocks across soil depths. In the surface layer (0−20 cm) NT, by and large, resulted in higher SOC stocks as compared to CT; however, SOC stocks exhibited a declining trend with soil depth, in fact, became negative at depths lower than 20 cm. Sapkota et al.[120] observed that over a period of seven years, direct dry-seeded rice proceeded by wheat cultivation with residue retention enhanced SOC at 0-60 cm depth by a magnitude of 4.7 and 3.0 t C ha−1 in zero-tillage (ZTDSR-ZTW + R) and without tillage (PBDSR-PBW + R), respectively. On the contrary, the conventional tillage rice-wheat cropping system (CTR-CTW) decreased the SOC up to 0.9 t C ha−1 (Table 2).

    Table 2.  Influence of tillage and crop establishment methods on SOC stock and its temporal variation under rice–wheat system[120].
    Tillage and crop establishment methodsDepths (m)
    0–0.050.05–0.150.15–0.30.3–0.60–0.6
    Total SOC (t/ha)
    CTR-CTW3.5e7.1c8.77.026.2c
    CTR-ZTW3.9d7.6bc8.86.526.7c
    ZTDSR-CTW4.2d7.5bc9.26.327.3c
    ZTDSR-ZTW4.9c8.9ab8.26.228.2bc
    ZTDSR-ZTW+R6.1a9.0ab9.86.831.8a
    PBDSR-PBW+R5.5b9.3a9.36.030.1ab
    MSD0.41.72.01.42.49
    Treatment effect
    (p value)
    < 0.0010.040.1580.267< 0.001
    Initial SOC content3.6 ±
    0.15
    8.1 ±
    1.39
    8.78 ±
    1.07
    6.7 ±
    0.73
    27.1 ±
    1.21
    Change in SOC over seven years (t/ha)
    CTR-CTW−0.16−0.99−0.040.28−0.90
    CTR-ZTW0.28−0.500.01−0.20−0.41
    ZTDSR-CTW0.62−0.570.45−0.340.16
    ZTDSR-ZTW1.340.84−0.62−0.461.09
    ZTDSR-ZTW+R2.490.961.040.164.66
    PBDSR-PBW+R1.891.220.51−0.642.98
    CTR-CTW = Conventionally tilled puddled transplanted rice followed by conventionally tilled wheat, CTR-ZTW = Conventionally tilled puddled transplanted rice followed by zero-tilled wheat, ZTDSR-CTW = Zero-tilled direct dry-seeded rice followed by conventionally tilled wheat, ZTDSR-ZTW = Zero-tilled direct dry-seeded rice followed by zero-tilled wheat, ZTDSR-ZTW+R = Zero-tilled direct dry-seeded rice followed by zero-tilled wheat with residue retention, PBDSR-PBW+R = Direct dry-seeded rice followed by direct drilling of wheat both on permanent beds with residue retention, MSD, minimum significant difference. Significant different letters indicate significant differences at p < 0.05.
     | Show Table
    DownLoad: CSV

    Labile organic carbon (LC) is that fraction of SOC that is rapidly degraded by soil microbes, therefore, having the highest turnover rate. This fraction can turn over quickly on account of the change in land use and management strategies. From the crop production perspective, this fraction is crucial as it sustains the soil food cycle and, hence, considerably impacts nutrient cycling thereby altering soil quality and productivity. Short-term management could influence the labile fraction of carbon[121]. However, some site-specific problems and regional factors may influence their distribution in soil layers[102].

    Banger et al.[122] observed significant alteration in labile pools of C, for instance, particulate organic matter (POM), water-soluble C (WSC) and light fraction of C (LFC) because of the addition of fertilizers and/or FYM over a 16-year period. Particulate organic matter, LFC and WSC contributed 24%–35%, 12%–14% and 0.6%–0.8%, respectively, towards SOC. The increase in concentration of SOC including its pools like POC and the sequestration rate due to integrated nutrient management was also reported by Nayak et al.[123]. Gu et al.[124] observed that mulch-treated soils (straw and grass mulch) had significantly greater levels of LOC, POC, DOC and EOC as compared to no mulch-treated soils which could be adduced to the addition of straw, root and its sections into the soil. The content of labile C fractions across all treatments exhibited a decreasing trend with soil depth[23, 102, 125].

    In a long-term experiment, Anantha et al.[126] observed that the total organic carbon apportioned into labile carbon, non-labile, less labile, and very labile carbon constituted around 18.7%, 19.3%, 20.6% and 41.4% of the TOC, respectively (Table 3). Zhu et al.[20] determined that straw incorporation had a substantial impact on TOC and labile C fractions of the soil which were greater in straw incorporated treatments as compared to non-straw treatments across all the depths. Wang et al.[127] reported that the light fraction organic carbon (LFOC) and DOC were significantly greater in the straw-applied treatments than the control by a magnitude of 7%–129% for both the early and late season rice. The treatments NPK + FYM or NPK + GR + FYM resulted in greater content of very labile and labile C fractions whereas non-labile and less labile fractions were greater in control and NPK + CR treatment. There was 40.5% and 16.2% higher C build-up in sole FYM treated plots and 100% NPK + FYM, respectively over control. On the other hand, a net depletion of 1.2 and 1.8 Mg ha−1 in carbon stock was recorded under 50% NPK and control treatments, respectively. Out of the total C added through FYM, only 28.9% was stabilized as SOC, though an external supply of OM is a significant source of soil organic carbon[69]. Hence, to sustain the optimum SOC level at least an input of 2.3 Mg C ha−1 y−1 is required. A comparatively greater quantity of soil C in passive pools was observed in 100% NPK + FYM treatment. The increase in allocation of C into the passive pool was about 33%, 35%, 41% and 39% of TOC in control, suboptimal dose, optimal dose and super optimal dose of NPK which indicates that the concentration of passive pools increased with an increase in fertilization doses. Water-soluble carbon (WSC) was 5.48% greater in the upper soil layer as compared to lower layer of soil. In surface soil (0−15 cm), the values of light fraction carbon (LFC) were 81.3, 107.8, 155.2, 95.7, 128.8, 177.8 and 52.7 mg kg−1 in ZT without residue retention, ZT with 4 t ha−1 residue retention, ZT with 6 t ha−1 residue retention, FIRB without residue addition and FIRB with 4 and 6 t ha−1 residue addition and CT, respectively (Table 4). Tiwari et al.[128] determined that the decrease in POC was due to reduction in fine particulate organic matter in topsoil whereas decrement in dissolved organic carbon was observed largely in subsoil. Therefore, in surface soils fine POC and LFOC might be regarded as preliminary evidence of organic C alteration more precisely, while DOC could be considered as a useful indicator for subsoil. Reduction in allocations of fine POC, LFOC and DOC to SOC caused by tillage and straw management strategies indicated the decline in quality of SOC. A higher SOC concentration was recorded in the conjoint application of INF + FYM (0.82%) and sole application of INF (0.65%) than control (0.54%). Kumar et al.[83] reported that the CT without residue retention had significantly lower labile carbon fractions (27%–48%) than zero-tillage with 6-ton residue retention. Moreover, residue-retained fertilized treatments had significantly greater labile fractions of C than sole fertilized treatments[125]. Kumar et al.[83] reported highest change in DOC in zero-till with residue retention (28.2%) in comparison to conventional tillage practices. In ZT, absence of soil perturbations resulted in sustained supply of organic substrata for soil microbes which increases their activity. On the contrary, CT practices resulted in higher losses of C as CO2 due to frequent disturbances.

    Table 3.  Oxidisable organic carbon fractions in soils (g kg−1) at different layers[126].
    TreatmentDepths (cm)
    0−1515−3030−45Total
    Very Labile C
    Control3.6 ± 0.5c1.4 ± 0.3b1.3 ± 0.2a6.3 ± 0.4b
    50% NPK4.6 ± 0.3bc2.1 ± 0.7ab1.5 ± 0.1a8.1 ± 0.9a
    100% NPK4.4 ± 0.3bc2.3 ± 0.2a1.4 ± 0.5a8.0 ± 0.7a
    150% NPK5.0 ± 0.2ab2.6 ± 0.2a1.5 ± 0.1a9.0 ± 0.3a
    100% NPK + FYM4.8 ± 0.2ab2.0 ± 0.2ab1.3 ± 0.3a8.1 ± 0.2a
    FYM5.9 ± 1.3a2.2 ± 0.2a1.4 ± 0.3a9.5 ± 1.6a
    Fallow4.2 ± 0.7bc1.5 ± 0.5b0.7 ± 0.3b6.3 ± 0.8b
    Lbile C
    Control2.4 ± 0.3a1.0 ± 0.2a0.8 ± 0.4a4.2 ± 0.6a
    50% NPK1.7 ± 0.4ab0.9 ± 0.5a0.7 ± 0.2a3.3 ± 0.7a
    100% NPK1.8 ± 0.4ab0.8 ± 0.5a0.6 ± 0.3a3.2 ± 0.8a
    150% NPK1.2 ± 0.3b0.7 ± 0.2a0.9 ± 0.2a2.8 ± 0.4a
    100% NPK + FYM1.9 ± 0.3ab0.7 ± 0.2a0.7 ± 0.3a3.4 ± 0.2a
    FYM2.5 ± 0.9a0.7 ± 0.3a0.7 ± 0.2a3.9 ± 0.9a
    Fallow2.2 ± 1.0ab1.0 ± 0.3a1.0 ± 0.4a4.1 ± 1.1a
    Less labile C
    Control1.5 ± 0.3c0.6 ± 0.4c0.4 ± 0.0c2.6 ± 0.7d
    50% NPK1.8 ± 0.1c0.4 ± 0.1c0.5 ± 0.2c2.7 ± 0.1cd
    100% NPK2.5 ± 0.3ab0.8 ± 0.1bc1.1 ± 0.2ab4.4 ± 0.1b
    150% NPK2.6 ± 0.2a0.9 ± 0.1bc0.4 ± 0.2c3.9 ± 0.1b
    100% NPK + FYM2.7 ± 0.6a1.5 ± 0.2a1.4 ± 0.1a5.6 ± 0.7a
    FYM1.9 ± 0.7bc1.7 ± 0.2a1.0 ± 0.2b4.5 ± 0.7ab
    Fallow1.5 ± 0.3c1.3 ± 0.7ab0.9 ± 0.4b3.8 ± 1.2bc
    Non labile C
    Control1.2 ± 0.5b1.2 ± 0.3a0.2 ± 0.2b2.6 ± 0.5b
    50% NPK1.2 ± 0.9b1.7 ± 0.8a0.7 ± 0.4ab3.5 ± 1.8ab
    100% NPK1.3 ± 0.6b1.5 ± 0.6a0.5 ± 0.2ab3.3 ± 1.0ab
    150% NPK1.4 ± 0.3b1.5 ± 0.2a0.8 ± 0.1a3.7 ± 0.3ab
    100% NPK + FYM2.0 ± 0.8b1.3 ± 0.1a0.3 ± 0.3ab3.5 ± 0.7ab
    FYM3.7 ± 1.3a1.0 ± 0.2a0.5 ± 0.5ab5.1 ± 1.9a
    Fallow2.1 ± 0.2b1.4 ± 0.7a0.4 ± 0.2ab3.9 ± 0.9ab
    Values in the same column followed by different letters are significantly different at p < 0.001, ± indicates the standard deviation values of the means.
     | Show Table
    DownLoad: CSV
    Table 4.  Influence of tillage and nitrogen management on distribution of carbon fractions in soil[83].
    TreatmentsWSOC
    (g kg−1)
    SOC
    (g kg−1)
    OC
    (g kg−1)
    BC
    (g kg−1)
    POC
    (mg kg)
    PON
    (mg kg−1)
    LFOC
    (mg kg−1)
    LFON
    (mg kg−1)
    Depths (cm)
    0−1515−300−1515−300−1515−300−1515−300−1515−300−1515−300−1515−300−1515−30
    Tillage practices
    ZTR28.826.223.119.39.619.134.694.281342.8967.9119.5108.1194.7154.814.812.3
    ZTWR25.324.618.414.87.877.213.763.19981.1667.494.686.5120.5104.711.810.3
    RTR27.025.922.418.28.688.174.133.871230.2836.9109.797.8170.9144.913.711.6
    RTWR23.721.818.114.27.667.073.122.96869.4604.482.676.6107.197.39.78.6
    CTR26.124.421.817.48.497.963.823.481099.1779.498.489.3143.8115.912.810.9
    CT21.820.916.113.16.215.642.892.63617.5481.869.257.690.873.69.67.9
    Nitrogen management
    Control21.114.916.113.16.135.481.581.07709.7658.631.726.3123.9104.36.45.8
    80 kg N ha−128.321.217.814.76.466.162.461.75860.7785.668.456.2132.8116.17.66.9
    120 kg N ha−129.522.119.116.17.256.713.262.18952.2808.989.578.5150.6127.69.78.6
    160 kg N ha−130.223.120.818.27.757.283.822.661099.5823.896.883.4168.5145.710.29.8
    200 kg N ha−131.125.421.318.77.937.484.153.421153.1898.4103.997.3176.2152.911.710.6
    WSOC = Water soluble organic carbon, SOC = Total soil organic carbon, OC = Oxidizable organic carbon, BC =Black carbon, POC = particulate organic carbon, PON = particulate organic nitrogen, LFOC = labile fraction organic carbon, and LFON = labile fraction organic nitrogen. ZTR = Zero tillage with residue retention, ZTWR = Zero tillage without residue retention; RTR = Reduced tillage with residue retention, RTWR = Reduced tillage without residue retention, CTR = Conventional tillage with residue incorporation; CT = Conventional tillage without residue incorporation.
     | Show Table
    DownLoad: CSV

    The soil characteristics such as plant available nutrients, microbial diversity and soil organic carbon transformation are dwindling on account of intensive cultivation under conventional tillage practices, therefore, demand relevant management approaches for soil and crop sustainability. Long-term application of organic amendments significantly increases soil properties by increasing plant available macro, micro, secondary nutrients and soil organic C, whereas the increase in organic C by INF application is, by and large, due to increment in organic C content within macro-aggregates and in the silt + clay compartments. The soil organic carbon and other plant available nutrients were significantly greater in conservation tillage systems as compared to conventional tillage (CT) that conservation approaches could be an exemplary promoter of soil productivity by modifying soil structure thereby protecting SOM and maintaining higher nutrient content. The mean concentration of different fractions of carbon MBN, PMN and soil respiration under integrated nutrient management treatments was higher as compared with to control. Therefore, the conjoint use of organic manures or retention of crop residues with inorganic fertilizers is imperative to reduce the depletion of SOC while sustaining crop production as a realistic alternative. Future research should focus mainly on the usage of organic and mineral fertilizers in conjunction with conservation tillage approaches to sustain the soil environment.

    The authors confirm contribution to the paper as follows: study conception and design: Dhaliwal SS, Shukla AK, Randhawa MK, Behera SK; data collection: Sanddep S, Dhaliwal SS, Behera SK; analysis and interpretation of results: Dhaliwal SS, Gagandeep Kaur, Behera SK; draft manuscript preparation: Dhaliwal SS, walia, Shukla AK, Toor AS, Behera SK, Randhawa MK. All authors reviewed the results and approved the final version of the manuscript.

    Data sharing not applicable to this article as no datasets were generated or analyzed during the current study.

    The support rendered by the Departemnt of Soil Science, PAU, Ludhiana, RVSKVV, Gwailor, CSSRI, Karnal, IISS, Bhopal, School of Organic Farming, PAU Ludhiana and Washington State University, USA is fully acknowledged .

  • The authors declare that they have no conflict of interest.

  • Supplemental Table S1 Coded values of parameters for Box–Behnken design.
    Supplemental Table S2 The primers of GABA-T, GAD and actin.
    Supplemental Table S3 Response surface design and experimental results.
    Supplemental Table S4 Analysis of variance (ANOVA) for the response surface regression model to GABA content.
    Supplemental Fig. S1 Morphology changes of different cultivars of brown rice before and after germination.
    Supplemental Fig. S2 Effects of interaction between NaCl and KCl (A), CaCl2 and KCl (B) and NaCl and CaCl2 (C) on GABA content.
  • [1]

    Ravichanthiran K, Ma ZF, Zhang H, Cao Y, Wang CW, et al. 2018. Phytochemical profile of brown rice and its nutrigenomic implications. Antioxidant 7:71

    doi: 10.3390/antiox7060071

    CrossRef   Google Scholar

    [2]

    Kato T, Horibata A. 2021. Distribution of γ-oryzanol in the outer layers of brown rice and its variation among cultivars. Plant Production Science 24:256−65

    doi: 10.1080/1343943x.2020.1816139

    CrossRef   Google Scholar

    [3]

    Butsat S, Siriamornpun S. 2010. Antioxidant capacities and phenolic compounds of the husk bran and endosperm of Thai rice. Food Chemistry 119:606−13

    doi: 10.1016/j.foodchem.2009.07.001

    CrossRef   Google Scholar

    [4]

    Heiniö RL, Noort MWJ, Katina K, Alam SA, Sozer N, et al. 2016. Sensory characteristics of wholegrain and bran-rich cereal foods - A review. Trends in Food Science & Technology 47:25−38

    doi: 10.1016/j.jpgs.2015.11.002

    CrossRef   Google Scholar

    [5]

    Diez-Gutiérrez L, San Vicente L, Barrón LJR, Villarán MDC, Chávarri M. 2020. Gamma-aminobutyric acid and probiotics: Multiple health benefits and their future in the global functional food and nutraceuticals market. Journal of Functional Foods 64:103669

    doi: 10.1016/j.jff.2019.103669

    CrossRef   Google Scholar

    [6]

    Diana M, Quílez J, Rafecas M. 2014. Gamma-aminobutyric acid as a bioactive compound in foods: a review. Journal of Functional Foods 10:407−20

    doi: 10.1016/j.jff.2014.07.004

    CrossRef   Google Scholar

    [7]

    Xu N, Wei L, Liu J. 2017. Biotechnological advances and perspectives of γ-aminobutyric acid production. World Journal of Microbiology & Biotechnology 33:64

    doi: 10.1007/s11274-017-2234-5

    CrossRef   Google Scholar

    [8]

    Yang G, Xu J, Xu Y, Guan X, Ramaswamy HS, et al. 2023. Recent developments in applications of physical fields for microbial decontamination and enhancing nutritional properties of germinated edible seeds and sprouts: a review. Critical Reviews in Food Science and Nutritio Latest Article

    doi: 10.1080/10408398.2023.2255671

    CrossRef   Google Scholar

    [9]

    Cakmak T, Dumlupinar R, Erdal S. 2010. Acceleration of germination and early growth of wheat and bean seedlings grown under various magnetic field and osmotic conditions. Bioelectromagnetics 31:120−29

    doi: 10.1002/bem.20537

    CrossRef   Google Scholar

    [10]

    Luo X, Li D, Tao Y, Wang P, Yang R, et al. 2022. Effect of static magnetic field treatment on the germination of brown rice: Changes in α-amylase activity and structural and functional properties in starch. Food Chemistry 383:132392

    doi: 10.1016/j.foodchem.2022.132392

    CrossRef   Google Scholar

    [11]

    Chen C, Tao Y, Han Y, Ding Y, Jian X, et al. 2023. Preparation of germinated brown rice with high γ-aminobutyric acid content and short root by magnetic field treatment. Journal of Cereal Science 112:103720

    doi: 10.1016/j.jcs.2023.103720

    CrossRef   Google Scholar

    [12]

    Ureta-Leones D, García-Quintana Y, Vega-Rosete S, Pérez-Morell L, Bravo-Medina CA, et al. 2021. Effect of pre-germination treatment with direct magnetic field exposure: a systematic review and meta-analysis. European Journal of Forest Research 140:1029−38

    doi: 10.1007/s10342-021-01400-0

    CrossRef   Google Scholar

    [13]

    Chaiyasut C, Sivamaruthi BS, Pengkumsri N, Saelee M, Kesika P, et al. 2017. Optimization of conditions to achieve high content of gamma amino butyric acid in germinated black rice and changes in bioactivities. Food Science and Technology 37:83−93

    doi: 10.1590/1678-457x.33416

    CrossRef   Google Scholar

    [14]

    Miller G, Suzuki N, Ciftci-Yilmaz S, Mittler R. 2010. Reactive oxygen species homeostasis and signalling during drought and salinity stresses. Plant Cell & Environment 33:453−67

    doi: 10.1111/j.1365-3040.2009.02041.x

    CrossRef   Google Scholar

    [15]

    Choe H, Sung J, Lee J, Kim Y. 2021. Effects of calcium chloride treatment on bioactive compound accumulation and antioxidant capacity in germinated brown rice. Journal of Cereal Science 101:103294

    doi: 10.1016/j.jcs.2021.103294

    CrossRef   Google Scholar

    [16]

    Yin Y, Yang R, Guo Q, Gu Z. 2014. NaCl stress and supplemental CaCl2 regulating GABA metabolism pathways in germinating soybean. European Food Research and Technology 238:781−88

    doi: 10.1007/s00217-014-2156-5

    CrossRef   Google Scholar

    [17]

    Li W, Rao S, Du C, Liu L, Dai G, et al. 2022. Strategies used by two goji species, Lycium ruthenicum and Lycium barbarum, to defend against salt stress. Scientia Horticulturae 306:111430

    doi: 10.1016/j.scienta.2022.111430

    CrossRef   Google Scholar

    [18]

    Thomas S, Anand A, Chinnusamy V, Dahuja A, Basu S. 2013. Magnetopriming circumvents the effect of salinity stress on germination in chickpea seeds. Acta Physiologiae Plantarum 35:3401−11

    doi: 10.1007/s11738-013-1375-x

    CrossRef   Google Scholar

    [19]

    Samarah NH, Bany Hani MMY, Makhadmeh IM. 2021. Effect of magnetic treatment of water or seeds on germination and productivity of tomato plants under salinity stress. Horticulturae 7:220

    doi: 10.3390/horticulturae7080220

    CrossRef   Google Scholar

    [20]

    Zhang Q, Xiang J, Zhang L, Zhu X, Evers J, et al. 2014. Optimizing soaking and germination conditions to improve gamma-aminobutyric acid content in japonica and indica germinated brown rice. Journal of Functional Foods 10:283−91

    doi: 10.1016/j.jff.2014.06.009

    CrossRef   Google Scholar

    [21]

    Knutson CA. 1986. A simplified colorimetric procedure for determination of amylose of amylose in maize starches. Cereal Chemistry 63(2):89−92

    Google Scholar

    [22]

    Whiffen LK, Midgley DJ, McGee PA. 2007. Polyphenolic compounds interfere with quantification of protein in soil extracts using the Bradford method. Soil Biology & Biochemistry 39:691−94

    doi: 10.1016/j.soilbio.2006.08.012

    CrossRef   Google Scholar

    [23]

    Yue F, Zhang J, Xu J, Niu T, Lu X, et al. 2022. Effects of monosaccharide composition on quantitative analysis of total sugar content by phenol-sulfuric acid method. Frontiers in Nutrition 9:963318

    doi: 10.3389/fnut.2022.963318

    CrossRef   Google Scholar

    [24]

    Yu K, Hu S, Huang J, Mei LH. 2011. A high-throughput colorimetric assay to measure the activity of glutamate decarboxylase. Enzyme and Microbial Technology 49:272−76

    doi: 10.1016/j.enzmictec.2011.06.007

    CrossRef   Google Scholar

    [25]

    Ma Y, Wang P, Chen Z, Gu Z, Yang R. 2019. NaCl stress on physio-biochemical metabolism and antioxidant capacity in germinated hulless barley (Hordeum vulgare L.). Journal of the Science of Food and Agriculture 99:1755−64

    doi: 10.1002/jsfa.9365

    CrossRef   Google Scholar

    [26]

    Munarko H, Sitanggang AB, Kusnandar F, Budijanto S. 2022. Germination of five Indonesian brown rice: evaluation of antioxidant, bioactive compounds, fatty acids and pasting properties. Food Science and Technology 42:e19721

    doi: 10.1590/fst.19721

    CrossRef   Google Scholar

    [27]

    Liu LL, Zhai HQ, Wan JM. 2005. Accumulation of γ-aminobutyric acid in giant-embryo rice grain in relation to glutamate decarboxylase activity and its gene expression during water soaking. Cereal Chemistry 82:191−96

    doi: 10.1094/cc-82-0191

    CrossRef   Google Scholar

    [28]

    Akita S, Yoon BS, Kabaki N. 1998. Relationship between seedling emergence rate and embryo weight of rice under low-temperature and submerged soil condition. Japanese Journal of Crop Science 67:318−22

    doi: 10.1626/jcs.67.318

    CrossRef   Google Scholar

    [29]

    Yao S. 2008. Screening and application of germinated brown rice varieties with high γ-aminobutyric acid content. Thesis. Huazhong Agricultural University, Wuhan, China.

    [30]

    Kim K, Yoon H. 2023. Gamma-aminobutyric acid signaling in damage response, metabolism, and disease. International Journal of Molecular Sciences 24:4584

    doi: 10.3390/ijms24054584

    CrossRef   Google Scholar

    [31]

    Zakeri A, Khavari-Nejad RA, Saadatmand S, Kootanaee FN, Abbaszadeh R. 2021. Effects of static magnetic field on growth, some biochemical and antioxidant system in lemon balm (Melissa officinalis L.). Acta Scientiarum Polonorum-Hortorum Cultus 20:71−80

    doi: 10.24326/asphc.2021.1.7

    CrossRef   Google Scholar

    [32]

    Jin Y, Guo W, Hu X, Liu M, Xu X, et al. 2019. Static magnetic field regulates Arabidopsis root growth via auxin signaling. Scientific Reports 9:14384

    doi: 10.1038/s41598-019-50970-y

    CrossRef   Google Scholar

    [33]

    Luo X, Tao Y, Han Y, Li D. 2023. Effect of static magnetic field treatment on γ-aminobutyric acid content and sensory characteristics of germinated brown rice cake. Food Chemistry 404:134709

    doi: 10.1016/j.foodchem.2022.134709

    CrossRef   Google Scholar

    [34]

    Anand A, Nagarajan S, Verma APS, Joshi DK, Pathak PC, et al. 2012. Pre-treatment of seeds with static magnetic field ameliorates soil water stress in seedlings of maize (Zea mays L.). Indian Journal of Biochemistry & Biophysics 49:63−70

    Google Scholar

    [35]

    Saletnik B, Saletnik A, Słysz E, Zaguła G, Bajcar M, et al. 2022. The static magnetic field regulates the structure, biochemical activity, and gene expression of plants. Molecules 27:5823

    doi: 10.3390/molecules27185823

    CrossRef   Google Scholar

    [36]

    Xie C, Sun M, Wang P, Yang R. 2022. Interaction of gamma-aminobutyric acid and Ca2+ on phenolic compounds bioaccumulation in soybean sprouts under NaCl stress. Plants-Basel 11:3503

    doi: 10.3390/plants11243503

    CrossRef   Google Scholar

    [37]

    Xing SG, Jun YB, Hau ZW, Liang LY. 2007. Higher accumulation of γ-aminobutyric acid induced by salt stress through stimulating the activity of diamine oxidases in Glycine max (L.) Merr. roots. Plant Physiology and Biochemistry 45:560−66

    doi: 10.1016/j.plaphy.2007.05.007

    CrossRef   Google Scholar

    [38]

    Keshavkant S, Padhan J, Parkhey S, Naithani SC. 2012. Physiological and antioxidant responses of germinating Cicer arietinum seeds to salt stress. Russian Journal of Plant Physiology 59:206−11

    doi: 10.1134/s1021443712010116

    CrossRef   Google Scholar

    [39]

    Khan MSA, Hamid A, Karim MA. 1997. Effect of sodium chloride on germination and seedling characters of different types of rice (Oryza sativa L.). Journal of Agronomy and Crop Science 179:163−69

    doi: 10.1111/j.1439-037x.1997.tb00512.x

    CrossRef   Google Scholar

    [40]

    Farooq M, Asif S, Jang YH, Park JR, Zhao DD, et al. 2022. Effect of different salts on nutrients uptake, gene expression, antioxidant, and growth pattern of selected rice genotypes. Frontiers in Plant Science 13:895282

    doi: 10.3389/fpls.2022.895282

    CrossRef   Google Scholar

    [41]

    Bam RK, Kumaga FK, Ofori K, Asiedu EA. 2006. Germination, vigour and dehydrogenase activity of naturally aged rice (Oryza sativa L.) seeds soaked in potassium and phosphorus salts. Asian Journal of Plant Sciences 5:948−55

    doi: 10.3923/ajps.2006.948.955

    CrossRef   Google Scholar

    [42]

    Kumari S, Nazir F, Jain K, Khan MIR. 2023. GABA and potassium modulates defence systems, assimilation of nitrogen and carbon, and yield traits under salt stress in wheat. Journal of Plant Growth Regulation 42:6721−40

    doi: 10.1007/s00344-023-10992-3

    CrossRef   Google Scholar

    [43]

    Bauréus Koch CLM, Sommarin M, Persson BRR, Salford LG, Eberhardt JL. 2003. Interaction between weak low frequency magnetic fields and cell membranes. Bioelectromagnetics 24:395−402

    doi: 10.1002/bem.10136

    CrossRef   Google Scholar

  • Cite this article

    Zhu Y, Tan S, Xie C, Li D, Wang P, et al. 2024. Effects of magnetic field pretreatment and chloride salt stress on physio-biochemical changes and γ-aminobutyric acid accumulation in germinated brown rice. Food Materials Research 4: e015 doi: 10.48130/fmr-0024-0006
    Zhu Y, Tan S, Xie C, Li D, Wang P, et al. 2024. Effects of magnetic field pretreatment and chloride salt stress on physio-biochemical changes and γ-aminobutyric acid accumulation in germinated brown rice. Food Materials Research 4: e015 doi: 10.48130/fmr-0024-0006

Figures(6)  /  Tables(2)

Article Metrics

Article views(3071) PDF downloads(404)

ARTICLE   Open Access    

Effects of magnetic field pretreatment and chloride salt stress on physio-biochemical changes and γ-aminobutyric acid accumulation in germinated brown rice

Food Materials Research  4 Article number: e015  (2024)  |  Cite this article

Abstract: Germinated brown rice is a staple food with high nutritional value and market prospects. Gamma-Aminobutyric Acid (GABA), abundantly present in germinated brown rice, has attracted significant attention due to its multiple active functions on the human body. This study aimed to enrich GABA in germinated brown rice by using static magnetic field pretreatment and NaCl, CaCl2 and KCl stress. After selecting Nanjing9108, which had the highest GABA content among the nine cultivars, a single-factor experiment was conducted and optimized the pretreatment condition as 10 mT static magnetic field for 40 min. Under this condition, the GABA content in brown rice germinated for 36 h was 66.35 mg/100 g, which was 13.88% higher than the control group. Simultaneously, the germination rate and early growth of germinated brown rice were also promoted. The optimal combination of culture medium for GABA enrichment obtained by response surface experimental design was NaCl 37.23 mmol/L, CaCl2 4.71 mmol/L, and KCl 5.75 mmol/L, with a GABA content of 69.783 mg/100 g. Under this condition, the changes in nutrients and the expression of glutamic acid decarboxylase (GAD) and GABA transaminase (GABA-T) related genes during the 0-48 h germination process of brown rice were studied. The relative expression of GAD was promoted and the relative expression of GABA-T was inhibited, resulting in the accumulation of GABA. This indicates that the combination of static magnetic field and salt treatment is an effective method to increase the GABA content in germinated brown rice.

    • Rice (Oryza sativa L.) is a popular staple food worldwide, especially in east and southeast Asia, due to its palatability and availability[1]. There are significant differences in nutritional value among different cultivars of rice[2]. Compared with polished rice, brown rice contains abundant proteins, lipids, fiber, trace elements, and bioactive components, which are mainly present in the germ and bran layers[3]. However, the adhesion of bran layers can result in poor texture, unpleasant bran odor, low digestibility and long cooking time, thereby reducing consumer satisfaction[4]. Germination is a traditional and widely accepted method to improve the palatability and nutritional quality of brown rice.

      During germination, beneficial bioactive compounds, including polyphenols, flavonoids, vitamins, and non-protein amino acids such as γ-aminobutyric acid (GABA), are synthesized and accumulated due to the activation of endogenous enzymes. GABA, a four-carbon non-protein amino acid widely present in organisms, serves as a major inhibitory neurotransmitter in the central nervous system of mammals[5]. In many countries, it is permitted as a food additive due to its safety, stability and physiological functions of alleviating anxiety, enhancing memory, regulating sleep, and activating immune cells[6]. For plants, external stresses such as drought, salinity, abnormal temperatures, and pathogen infection can promote its synthesis[7].

      Germinated grains are widely recognized as a safe and sustainable source of GABA. In recent years, there has been growing interest in utilizing physical fields, such as low temperature plasma, high pressure treatment, pulsed electric field, microwave, radio frequency, and ultrasonic wave, to enhance nutrient enrichment during seeds germination and sprouts growth[8]. Magnetic field (MF) treatment, in particular, has emerged as a promising green and efficient method for improving germination rates and promoting sprout growth[9]. For instance, pretreating brown rice with a 10 mT static magnetic field (SMF) for 60 min was able to enhance the germination index, including the germination rate (158.8%), bud length (87.3%), and fresh weight (16.5%), as well as facilitate the hydrolysis of starch into reducing sugar (8.2%)[10]. Moreover, this SMF pretreatment resulted in a significant increase in GABA content from 16.43 to 25.64 mg/100 g, thereby improving its nutritional quality[11]. Chemical treatment has been extensively utilized in research on seed germination due to its stability and efficiency[12]. Among these treatments, salt stress is a commonly employed technique for enriching GABA. In germinated black rice, 50−200 mmol/L NaCl treatment has been found to increase the levels of phytochemicals, particularly GABA and anthocyanin[13]. However, it is important to note that salt stress can have negative effects on germination rate, leading to ionic toxicity and oxidative damage caused by the excessive accumulation of reactive oxygen species (ROS)[14]. Conversely, in germinated brown rice, treatment with 0−200 mmol/L CaCl2 could enhance the content of GABA, total phenolics, and other bioactive substances, as well as increase the antioxidant activity of the rice kernels[15]. Furthermore, CaCl2 treatment was able to mitigate the detrimental effects of NaCl stress on the membrane structure of soybeans and promote their growth. The combined usage of CaCl2 and NaCl was found to improve the activity of GABA synthetase in soybeans and increase the GABA content[16]. Additionally, KCl, an important plant growth regulator, was able to alleviate the inhibitory effects of NaCl on growth and significantly increase the germination rate in Lycium barbarum L.[17]. In conclusion, NaCl treatment can inhibit the growth of plants, while CaCl2 and NaCl treatments may promote the growth. All of them have the potential to enhance GABA content in germinated brown rice. Moreover, studies have demonstrated that SMF treatment could alleviate the adverse effects of NaCl treatment on the germination and growth processes of chickpeas and tomatoes, leading to improved seed germination rate, seedling growth speed, and fruit yield[18,19]. Therefore, SMF pretreatment and its combination with chloride salt treatment may offer a more effective means of accumulating GABA and other nutrients, while also preventing damage caused by salt stress on rice and maintaining its vitality.

      The present study aimed to choose one rice cultivar with higher GABA contents both before and after germination from nine common rice cultivars. Additionally, the study investigated the impacts of a 10 mT SMF treatment with varying durations and different concentrations of NaCl, CaCl2, and KCl culture solutions on the physiological metabolism and GABA content of germinated brown rice. The GABA content served as the ultimate indicator for optimizing the germination conditions. And the changes in physiological metabolism, key nutrients, and enzyme activities related to GABA synthesis during the 0−48 h germination process were studied. The objective of this study was to establish a theoretical foundation for improving the yield and GABA content of germinated brown rice by optimizing the germination conditions.

    • There were nine cultivars of brown rice for testing, harvested in 2021 and stored at −20 °C. Cultivars of Zhennuo29 (I), SimiaoZayou (II), and Huarun2 (III) were provided by Anhui Muma Lake Agricultural Group Co., Ltd. Nanjing3908 (IV), Nanjing9108 (V), Nanjing46 (VI), NanjingJinggu (VII), Huaidao5 (VIII), and Ningxiangjing9 (IX) were provided by Jiangsu Academy of Agricultural Sciences. Suitable brown rice cultivars are selected based on germination and GABA content. The morphology of brown rice before and after germination is shown in Supplemental Fig. S1. GABA reagents were purchased from Yuan Ye Biotechnology Co., Ltd. (Shanghai, China). The reagents for sodium hypochlorite, calcium chloride, sodium chloride, potassium chloride, phenol, and sodium tetraborate decahydrate were all of analytical grade.

    • Intact brown rice seeds with germ were chosen and washed with distilled water to remove impurities, before being soaked in a 1% NaClO solution for 15 min to sterilize. Subsequently, brown rice seeds were thoroughly rinsed with distilled water until pH was neutral and soaked in deionized water at 30 °C for 6 h to absorb moisture. They were taken out and exposed to a 10 mT SMF for varying durations (0, 20, 40, and 60 min) before being laid flat on a sprouting tray.

      Seeds were germinated in a dark environment controlled at 25 °C and sprayed with 10 mL of differing concentrations of NaCl (0, 20, 40, 60, and 80 mmol/L), CaCl2 (0, 2, 4, 6, and 8 mmol/L), and KCl (0, 2, 4, 6, and 8 mmol/L) solutions every 8 h for 36 h. After germination, some seeds were preserved at −80 °C, while others were freeze-dried (LGJ-12A; Jipu Electronics Technology Co., LTD., Shanghai, China) and ground into powder for further analysis. The study also used response surface methodology (RSM) with a Box-Behnken design to assess the impacts of NaCl concentration (A), CaCl2 concentration (B), and KCl concentration (C) on the germination process (Supplemental Table S1).

    • One hundred brown rice seeds were randomly selected. Samples with bud length over 0.2 mm were recorded as germinated. Germination rate (%) = Number of germinated brown rice /100 × 100%.

    • Fresh weight was measured by a precision electronic balance and 100 grains were taken as a parallel group.

    • Dry weight was measured by drying seeds at 105 °C until constant weight and 100 grains were taken as a parallel group.

    • The colorimetric method was employed for the determination of GABA content[20]. Initially, 1.0 mg/mL GABA solution was prepared and diluted to concentrations of 0.01, 0.02, 0.05, 0.10, 0.15, and 0.2 mg/mL to serve as the standard solutions for measurement. Then, 1.00 g of germinated brown rice flour was precisely weighed and placed into a 10 mL centrifuge tube, to which 5 mL of distilled water was added. The mixture was then shaken for 4 h at 60 °C and 150 r/min followed by centrifugation at 4 °C for 15 min at 8,000 r/min. 0.5 mL of the supernatant was taken, 0.2 mL of 0.2 mol/L borate buffer (pH = 9.0) was added, followed by 1.0 mL of 6% phenol, and 0.4 mL of NaClO with an effective chlorine content of 5.5%. After shaking well, the solution was heated in a 60 °C water bath for 5 min, followed by a 10-min ice bath. Finally, 2.0 mL of 60% ethanol was added to the mixture, and the sample analyzed at a wavelength of 640 nm using a UV-visible spectrophotometer (UV-2802, Unicore Shanghai Instruments Co., Ltd., Shanghai, China).

    • Using kit, obtained from Shanghai Macklin Biochemical Co., Ltd (Shanghai, China). The soluble sugar and starch in the sample can be separated by 80% ethanol, and the starch can be decomposed into glucose by acid hydrolysis. The glucose content was determined by anthrone colorimetric method.

    • Fifty mg of the germinated brown rice power was weighed and 0.5 mL of 95% ethanol solution was added, followed by the addition of 4.5 mL of 1 mol/L NaOH solution. The mixture was then thoroughly shaken, heated in 100 °C for 10 min and 45 mL water was added. This resulting solution was referred to as the test solution. 0.5 mL test solution was taken and 9 mL water, 0.1 mL acetic acid and 0.2 mL reagent (0.2 g of I2 and 2 g of KI and making up to 100 mL by water). The mixture was shaken and placed for 10 min before the absorbancy at 620 nm was measured[21].

    • One gram fresh germinated brown rice flour was taken 10 ml water added and ground until homogenized. The mixture was then shaken for 2 h at 30 °C and 150 r/min, followed by centrifugation at 4 °C for 15 min at 8,000 r/min. After extration, water soluble protein content was determined using the Coomassie brilliant blue method[22]. Water soluble sugar content was determined by phenol-sulfuric acid method[23].

    • One g germinated brown rice was taken and 5.0 mL 0.07 mol/L potassium phosphate buffer with pH 5.8 added, containing 2.0 mol/L β-mercaptoethanol, 2.0 mmol/L EDTA, 0.2 mmol/L PLP, then ground into homogenate in an ice bath, and centrifuged at 4 °C, 10,000 r/min for 20 min. The supernatant was the crude enzyme extract. Two hundred μL crude enzyme solution was added to 100 μL substrate solution (l% Glu, pH 5.8). After a 2 h reaction at 40 °C, the enzyme activity was halted by placing it in a 90 °C water bath for 5 min. The sample was then centrifuged and the supernatant taken to measure the GABA content after passing through a 0.45 µm filter (water phase). The 1.0 mg GABA generated every 1 h was determined as an enzyme activity unit[24].

    • The rice samples were pre-cooled in liquid nitrogen, ground to a fine powder in liquid nitrogen, and immediately transferred to enzyme-free tubes. RNA extraction was performed using the TAKARA Plant RNA Extraction Kit (Catalog No. 9769). cDNA synthesis was carried out using the TAKARA RT-PCR Mater Mix Kit (Catalog No. RR036A). The samples were analyzed using the SYBR Premix Ex TaqTM kit (TAKARA Catalog No. RR420A). The primers used in this study are listed in Supplemental Table S2. Following the method described by Ma et al.[25], the samples were subjected to 40 cycles of denaturation at 95 °C for 30 s, followed by annealing and extension at 95 °C for 3 s and 60 °C for 30 s, respectively.

    • Results were presented as the means ± standard deviations (SD) with at least three replicates. Data was analyzed with SPSS Statistics 25 software at a 0.05 level of significance. Graphs were drawn with Origin 2021 software.

    • Table 1 presents the changes in physiological indexes before and after germination of brown rice, including germination rate, sprout length, fresh weight, and dry weight. After 36 h of germination, the sprout length of brown rice ranged from 1.27−2.25 mm, with all cultivars, except for cultivar I (glutinous rice) having a sprout length of over 1.5 mm and a germination rate of over 98%. The sprout length of the indica rice cultivars (II and III) measured at 2.25 and 2.18 mm, respectively, exhibiting a statistically significant increase compared with the tested japonica rice cultivars (IV−IX), which ranged from approximately 1.52 to 1.89 mm. Additionally, the sprout length of the indica rice cultivars surpassed that of the glutinous rice, which measured approximately 1.27 mm. Furthermore, the fresh weight and dry weight per 100 grains of the indica rice cultivars were significantly lower when compared to the other rice cultivars. The germination rate, sprout length, fresh weight, and dry weight of variations IV−VII and IX exhibited similar values, however cultivar VIII had larger grains (Supplemental Fig. S1) and significantly higher fresh weight and dry weight compared to other japonica rice cultivars.

      Table 1.  Germination rate, sprout length, fresh weight and dry weight of different cultivars.

      CultivarGermination rate (%)Sprout length (mm)Fresh weight (g/100 grain)Dry weight (g/100 grain)
      IZhennuo2987.33 ± 2.51b1.27 ± 0.07d3.26 ± 0.07b1.95 ± 0.01bc
      IISimiaozayou98.33 ± 1.53a2.25 ± 0.24a2.48 ± 0.05f1.78 ± 0.02d
      IIIHuarun298.67 ± 1.15a2.18 ± 0.19a2.47 ± 0.04f1.79 ± 0.02d
      IVNanjing390898.00 ± 1.00a1.66 ± 0.24bc3.15 ± 0.04cd1.92 ± 0.02c
      VNanjing910898.33 ± 1.53a1.61 ± 0.11c3.06 ± 0.04e1.92 ± 0.01c
      VINanjing4698.67 ± 0.58a1.68 ± 0.13bc3.21 ± 0.03bc1.98 ± 0.02b
      VIINanjingjinggu98.33 ± 1.53a1.52 ± 0.10c3.12 ± 0.03de1.93 ± 0.02c
      VIIIHuaidao598.00 ± 1.00a1.89 ± 0.14b3.51 ± 0.04a2.29 ± 0.02a
      IXNingxiangjing999.00 ± 1.00a1.53 ± 0.10c3.10 ± 0.04de1.94 ± 0.02c
      Different lowercase letters in the same column represent significant difference between cultivars (p < 0.05).

      The GABA content of nine different types of brown rice (before germination) was illustrated (Fig. 1), ranging from 11.54 to 21.66 mg/100 g . The GABA content of japonica rice (average 17.91 mg/100 g) was found to be higher compared to glutinous rice (11.54 mg/100 g) and indica rice (average 14.58 mg/100 g). After germination, the GABA content increased significantly, ranging from 23.64 to 49.20 mg/100 g. Specifically, cultivar V exhibited notably higher GABA content both before and after germination, with values of 21.66 mg/100 g and 49.20 mg/100 g, respectively. Moreover, the increase in GABA content for cultivar V was substantially greater than that observed in other cultivars, with an increase of 27.53 mg/100 g, representing a 127.10% increase. Consequently, Nanjing9108 (V) was selected as the subsequent experimental cultivar.
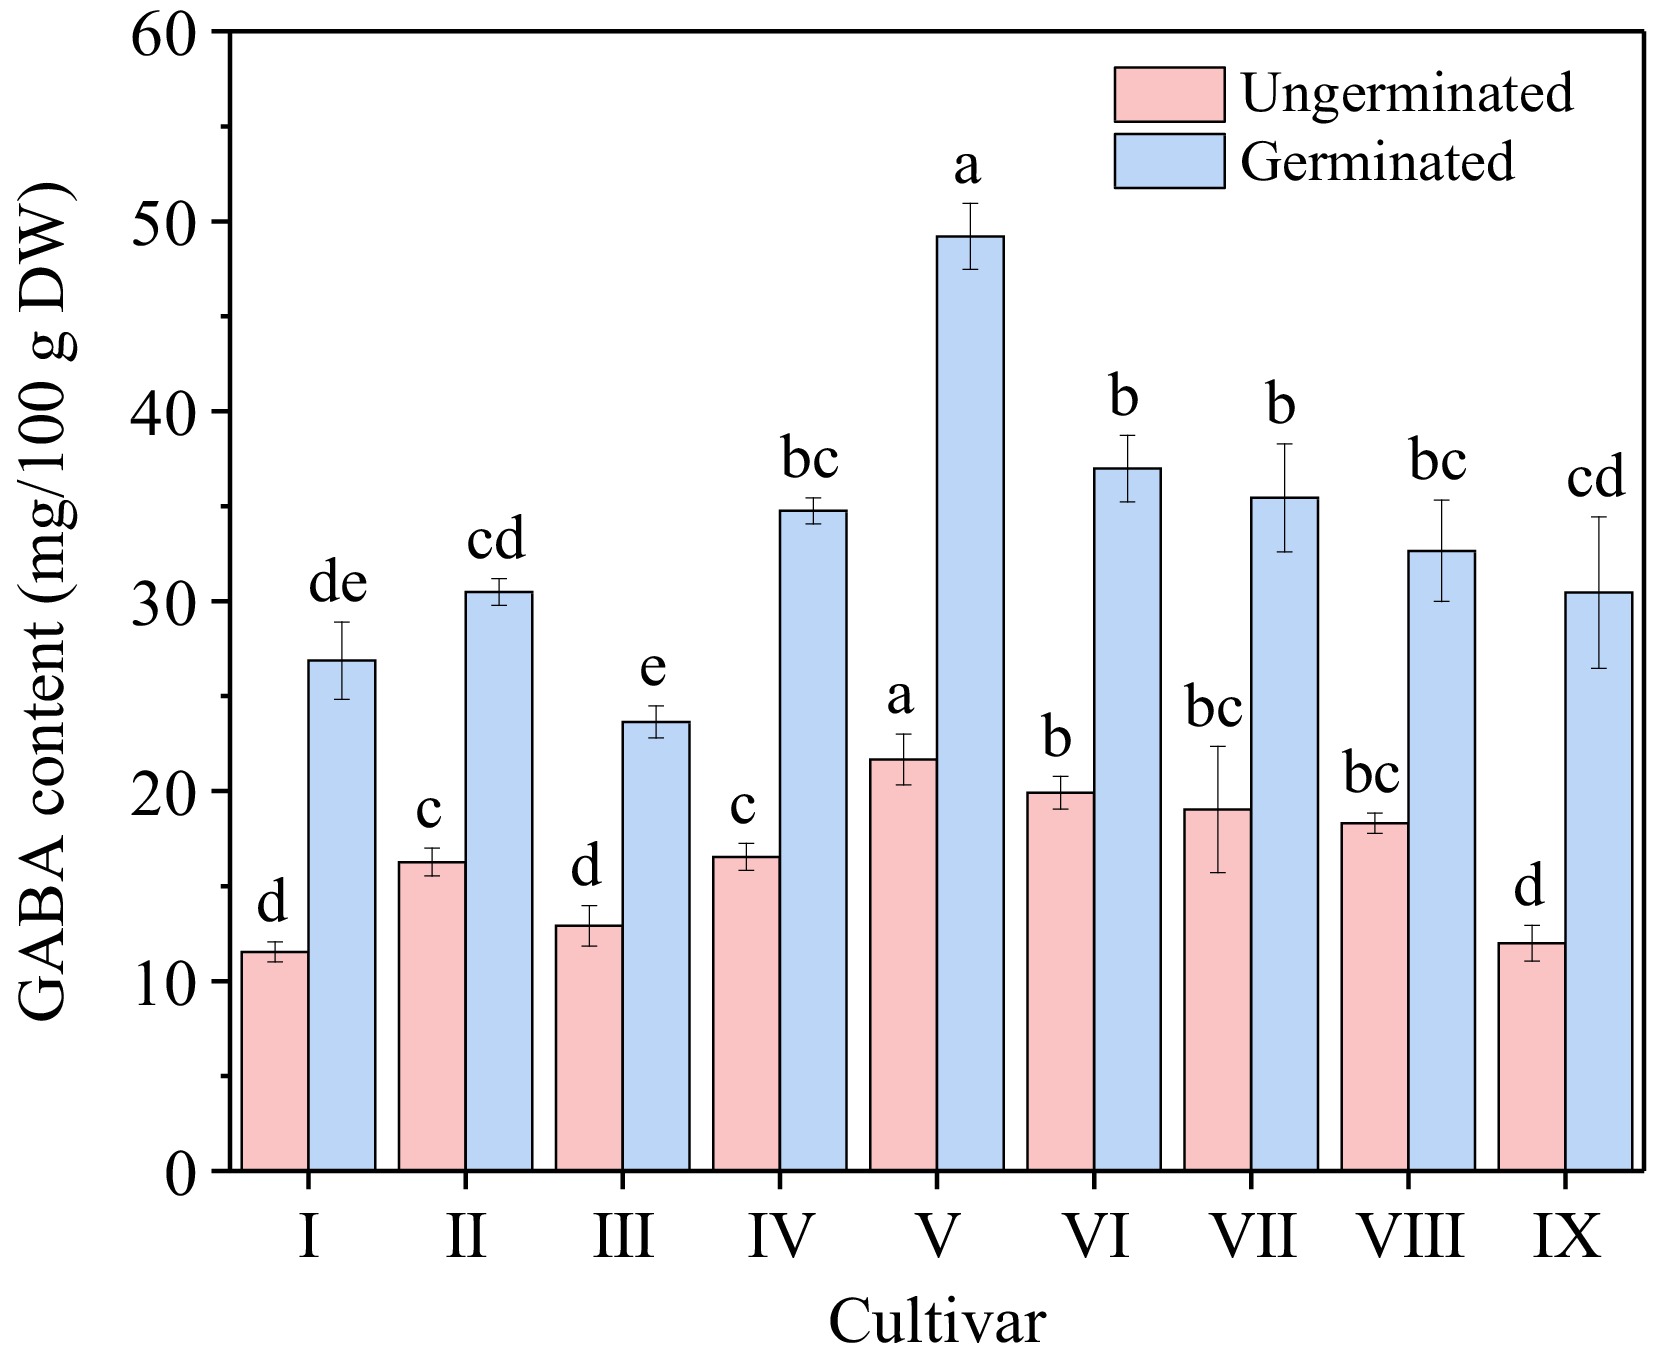
      Figure 1. 

      GABA content of different cultivars before and after germination. Cultivar I to IX refers to Zhennuo29, Simiaozayou, Huarun2, Nanjing3908, Nanjing9108, Nanjing46, Nanjingjinggu, Huaidao5 and Ningxiangjing9, respectively. Different lowercase letters in the columns with same color represent significant difference between cultivars (p < 0.05).

    • The germination rate of brown rice exhibited a substantial rise with the extension of SMF treatment duration, as seen in Fig. 2b. Additionally, the sprout length (Fig. 2c) and the fresh weight (Fig. 2d) were observed to be positively correlated with the prolonged treatment time. Conversely, a decrease in dry weight was observed (Fig. 2e). The early growth of brown rice was accelerated, the consumption of nutrients was raised, and water absorption was improved. GABA content in germinated brown rice, as depicted in Fig. 2f, showed an initial increase followed by a subsequent decrease with the prolongation of SMF pretreatment duration. Following treatment durations of 20, 40, and 60 min, there was an increase in GABA content of 9.43%, 13.88%, and 4.63%, respectively, in comparison with the control group (Fig. 2f). Hence, by considering GABA content as the primary criterion, a 40 min duration of SMF pretreatment was chosen. Under these conditions, the germination rate, sprout length, and fresh weight of brown rice exhibited respective increments of 2.67%, 15.87%, and 7.69% compared with the control group, while the dry weight decreased by 4.35%.
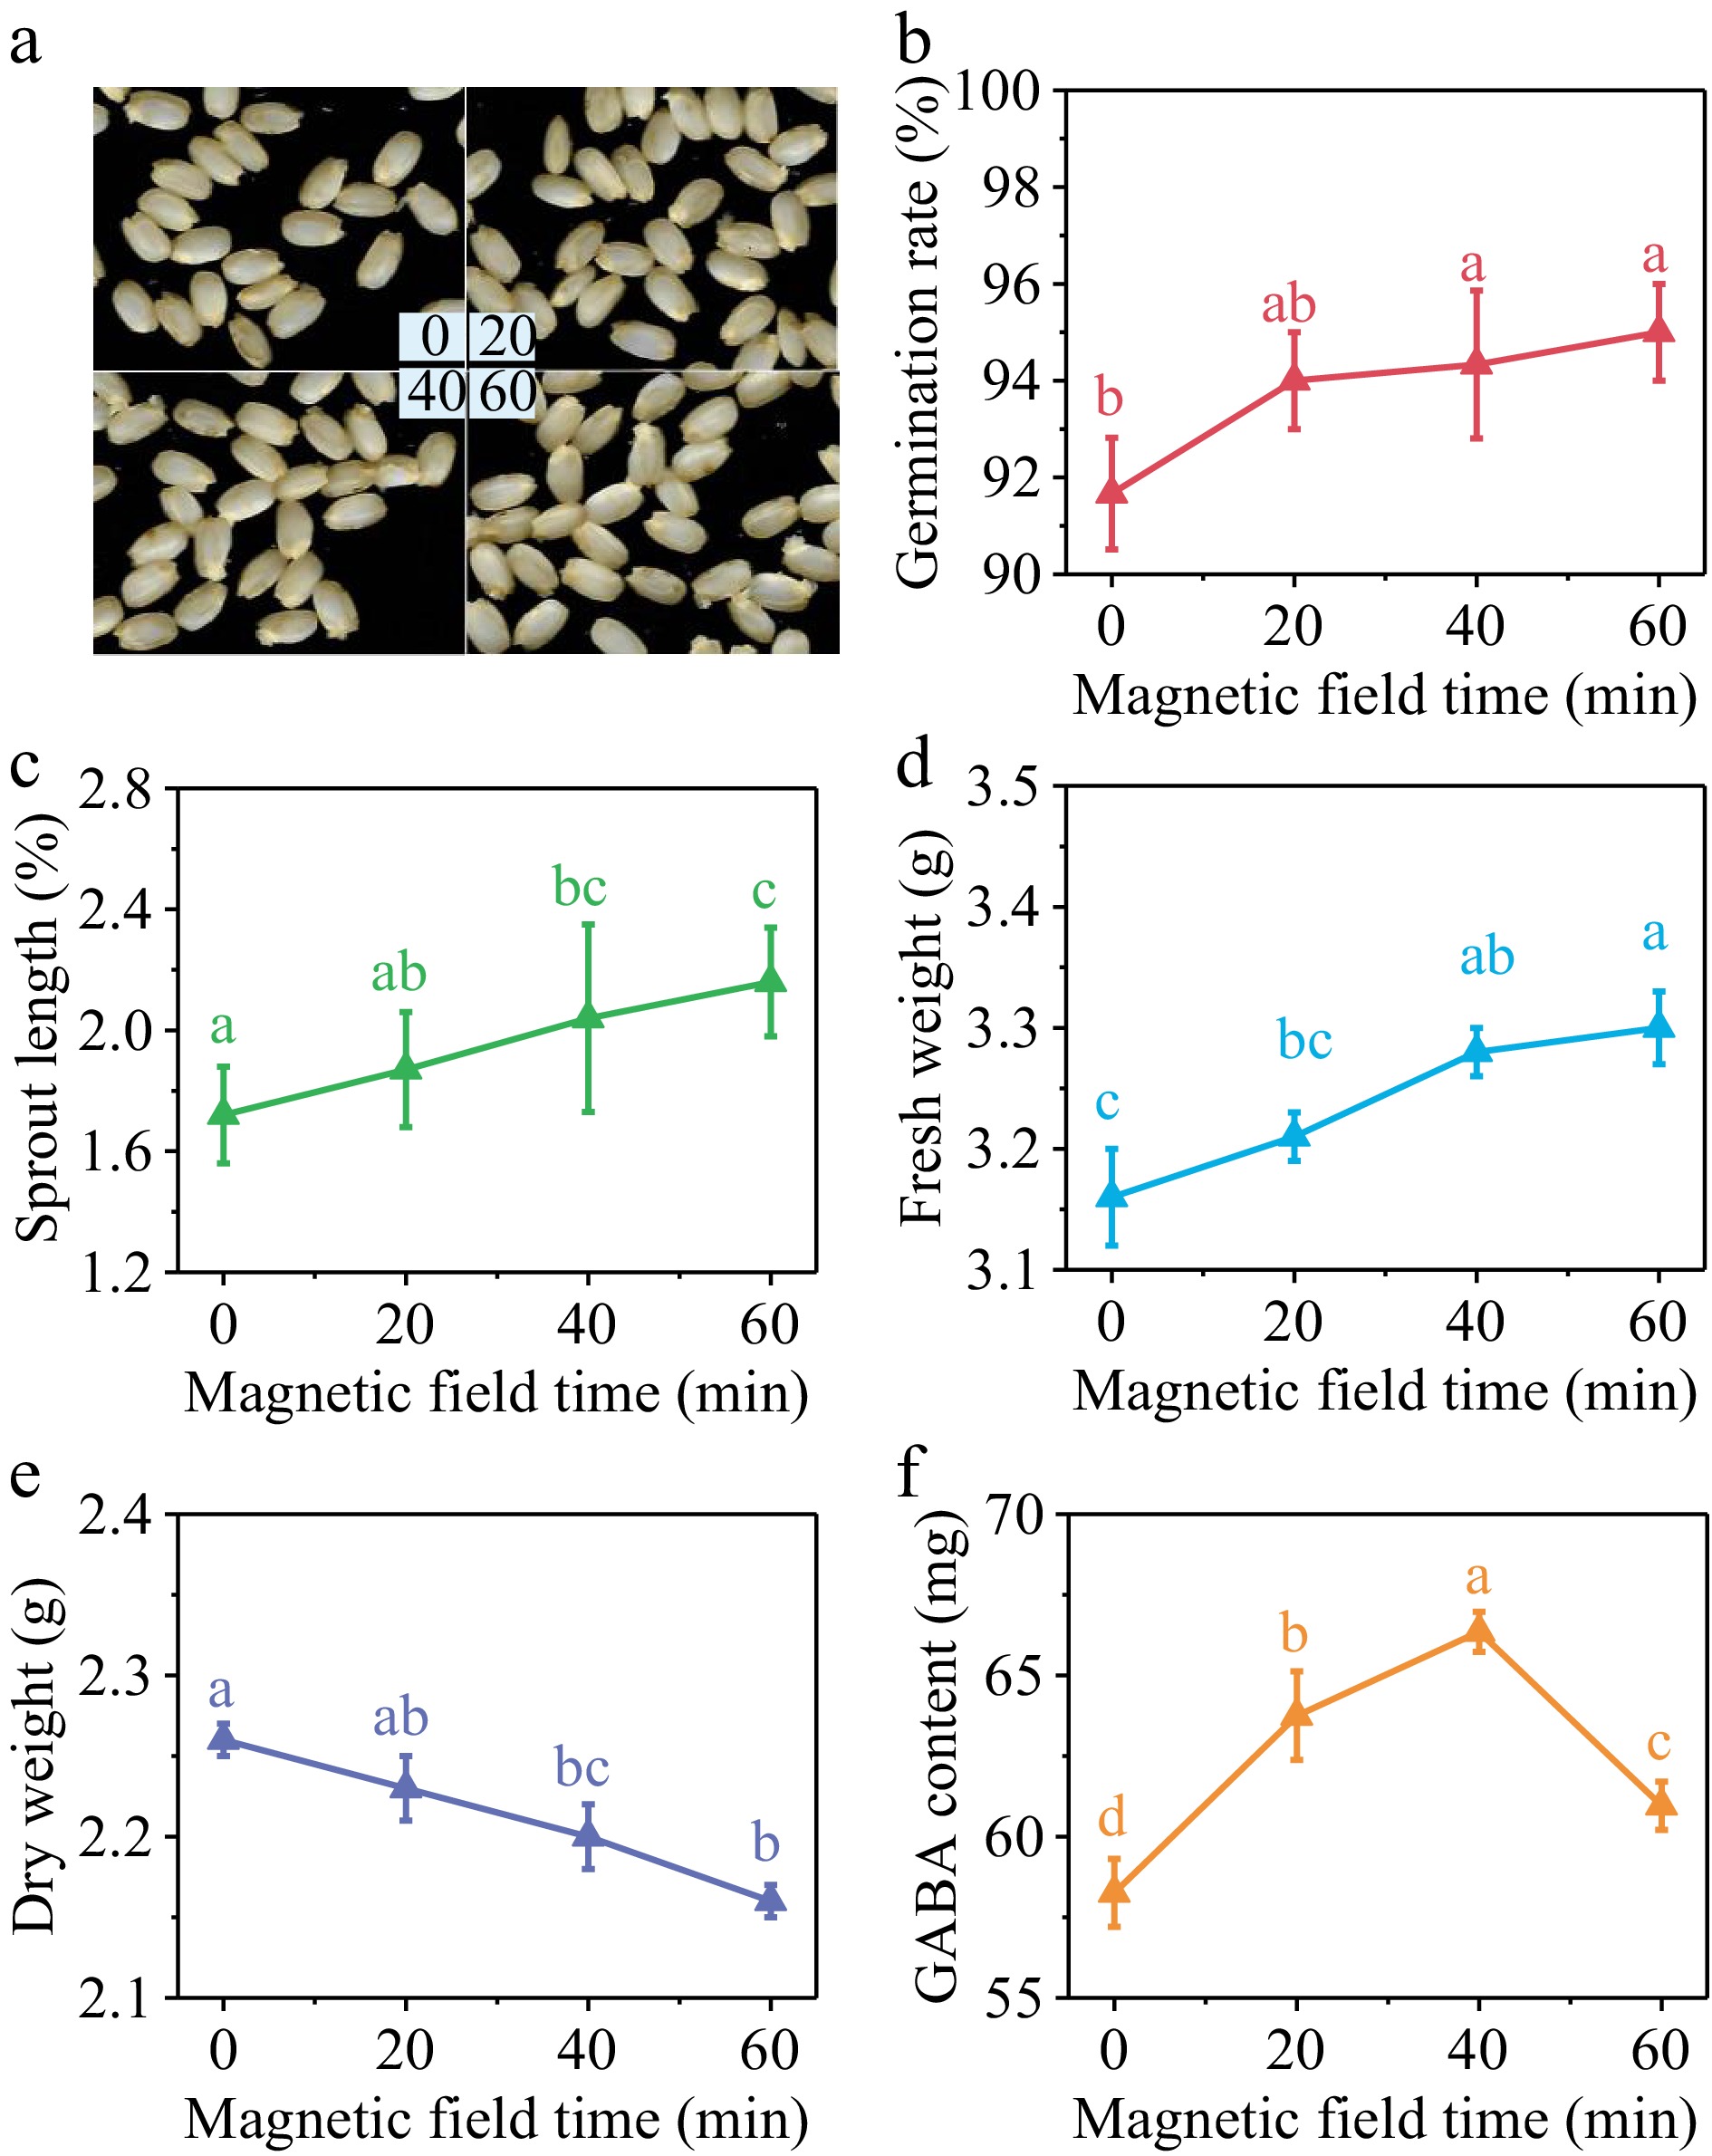
      Figure 2. 

      (a) Photos, (b) germination rate, (c) sprout length, (d) fresh weight, (e) dry weight and (f) GABA content in germinated brown rice treated by 10 mT SMF for 0, 20, 40, and 60 min. Different lowercase letters represent significant difference between treatments (p < 0.05).

    • With the increase of NaCl concentration, germination rate (Fig. 3b) and sprout length (Fig. 3c) showed a decreasing trend. Both germination rate and sprout length reached the lowest value when NaCl concentration was 80 mmol/L, decreasing by 4.3% and 19.8% compared with the control group. Specifically, the fresh weight reached its highest value at the NaCl concentration of 80 mmol/L, representing a 2.5% increase compared to the control group. the dry weight reached its peak at the NaCl concentration of 40 mmol/L, measuring 2.17 g/100 grains, which corresponds to a 2.2% increase compared with the control group. Exposure to NaCl stress had a modest inhibitory effect on the germination and initial growth of brown rice.
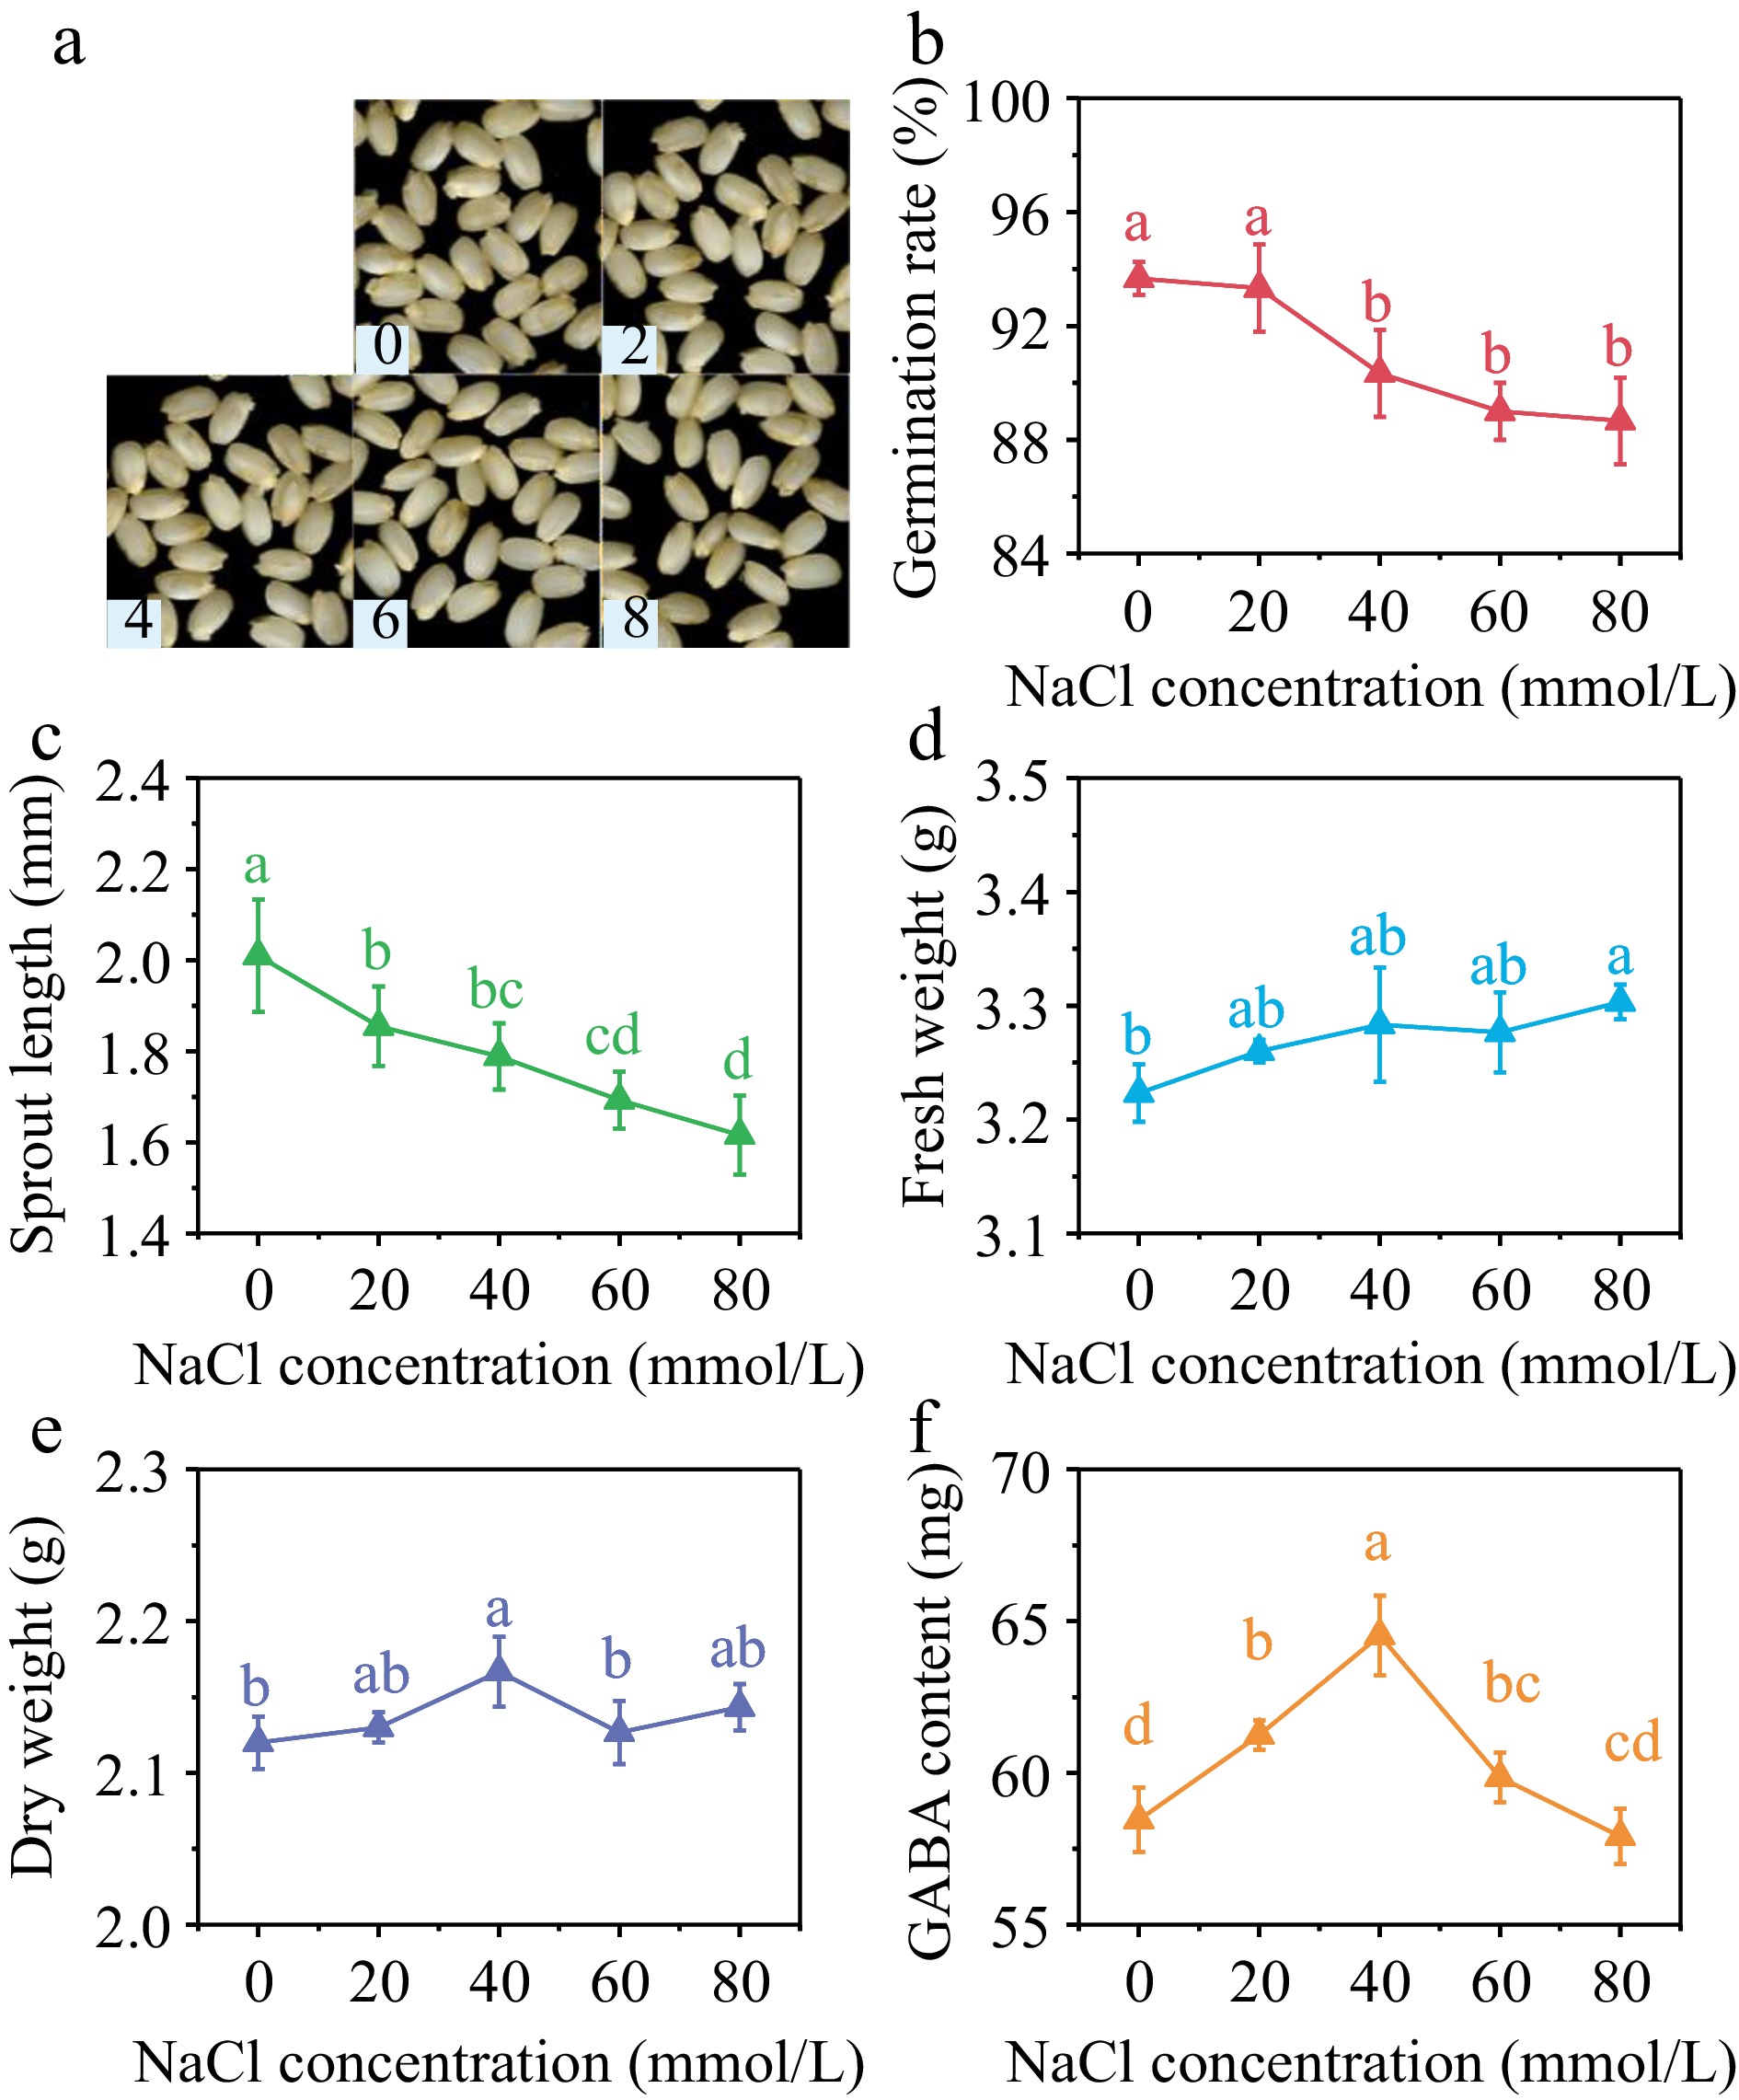
      Figure 3. 

      (a) Photos, (b) germination rate, (c) sprout length, (d) fresh weight, (e) dry weight and (f) GABA content in germinated brown rice cultivated by 0, 20, 40, 60, and 80 mmol/L NaCl under 40 min, 10 mT SMF pretreatment for 40 min. Different lowercase letters represent significant difference between treatments (p < 0.05).

      As can be seen from Fig. 3f, GABA content in germinated brown rice showed a trend of first increasing and then decreasing with the increase of NaCl concentration. When NaCl concentration was 20, 40, and 60 mmol/L, GABA content in brown rice after 36 h of germination reached 61.25, 64.53, and 59.8 mg/100 g, respectively. Compared with the control group, the increase was 4.78%, 10.39%, and 2.39%, respectively.

    • The addition of CaCl2 at various concentrations did not result in significant impact (p > 0.05) on the germination rate (Fig. 4b), sprout length (Fig. 4c), and fresh weight (Fig. 4d) of brown rice after 36 h germination. The dry weight reached its lowest level at the CaCl2 concentration of 6 mmol/L, which was 2.16 g per 100 grains (Fig. 4e), representing a 2.70% decrease compared to the control group. This indicates that under this treatment, brown rice had a higher water absorption rate, faster growth, and greater consumption of dry matter such as starch. However, overall, the low concentration of CaCl2 had a smaller impact on the germination and early growth of brown rice under SMF pretreatment.
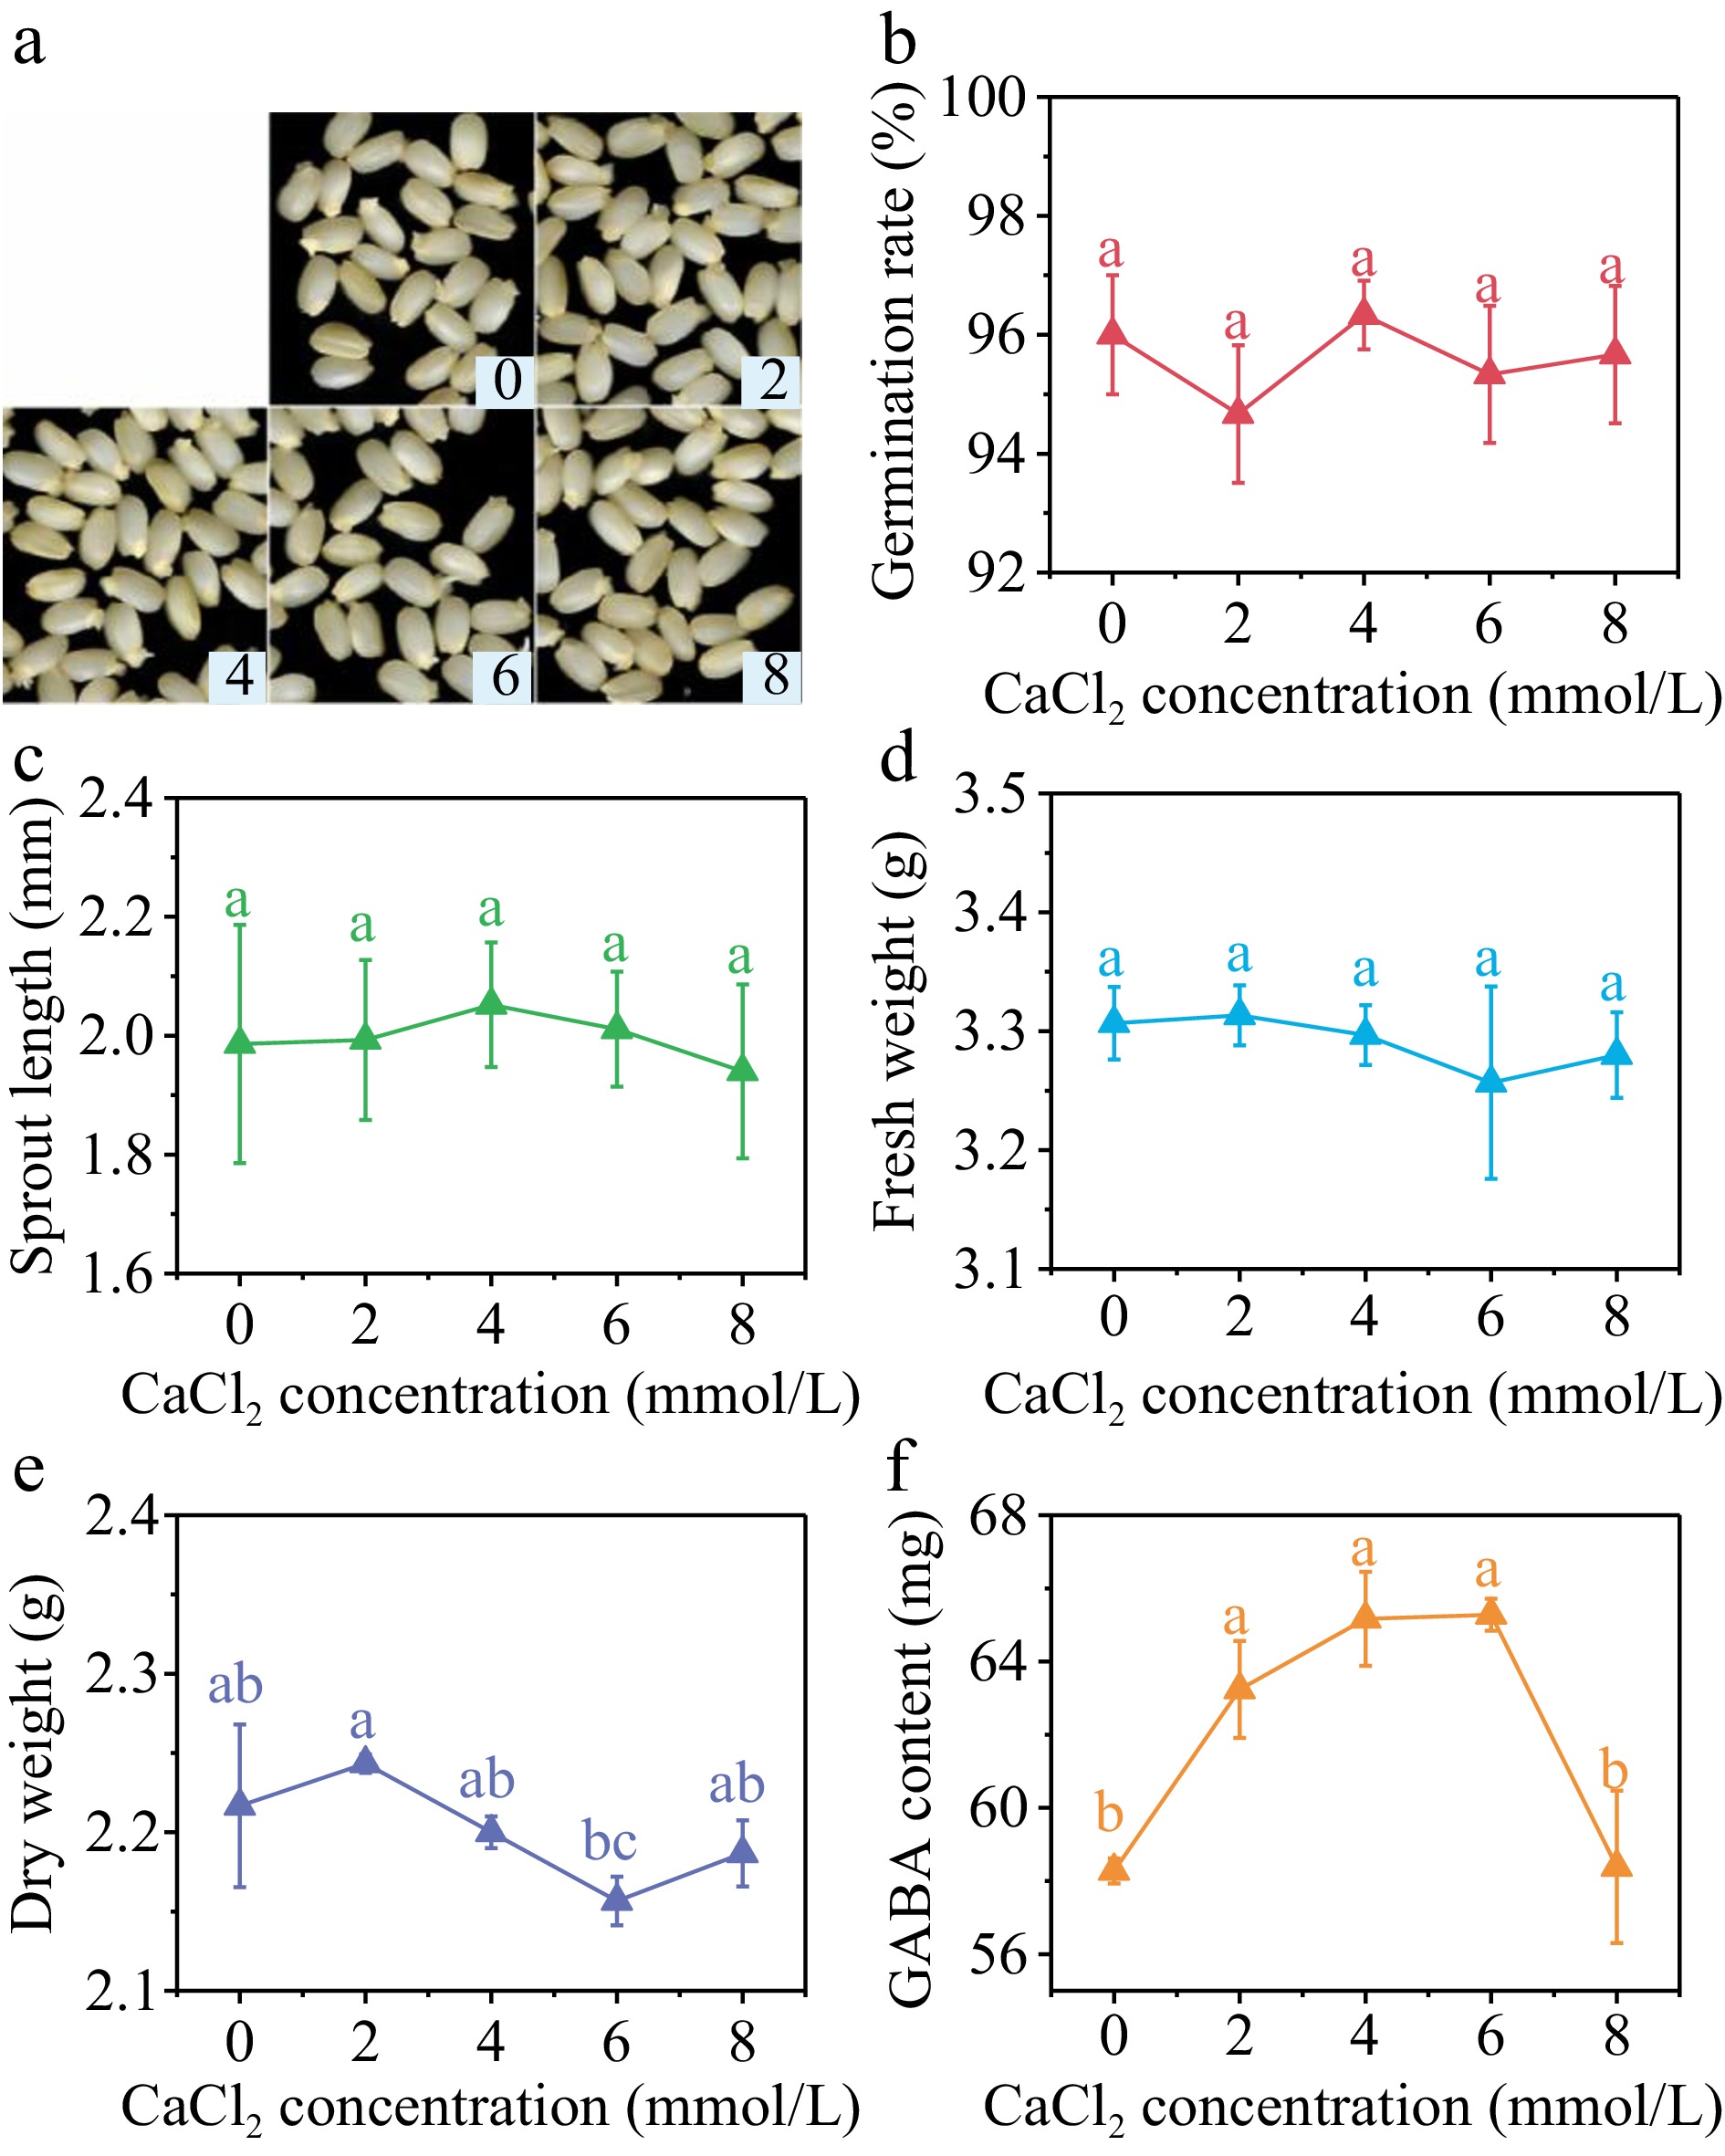
      Figure 4. 

      (a) Photos, (b) germination rate, (c) sprout length, (d) fresh weight, (e) dry weight and (f) GABA content in germinated brown rice cultivated by 0, 2, 4, 6, and 8 mmol/L CaCl2 under 40 min, 10 mT SMF pretreatment for 40 min. Different lowercase letters represent significant difference between treatments (p < 0.05).

      The GABA content in germinated brown rice exhibited a pattern of initial increase followed by subsequent decrease with the rise in CaCl2 concentration. The GABA content of brown rice was found to be significantly higher than that of the control group at CaCl2 concentrations of 2, 4, and 6 mmol/L. Specifically, the GABA content rose by 8.52%, 11.83%, and 12.02% at these respective concentrations. Nevertheless, no statistically significant disparity in GABA levels was seen when comparing the control group with the CaCl2 concentration of 8 mmol/L.

    • Different concentrations of KCl did not have a significant impact on the germination rate of brown rice (Fig. 5b). However, the sprout length (Fig. 5c) and fresh weight (Fig. 5d), as well as the GABA content (Fig. 5f), showed a trend of initial increase followed by decrease. The sprout length reached its maximum value when the KCl concentration was 4 mmol/L, increasing 11.83% compared with the control group. In contrast, the fresh weight reached its peak at the KCl concentration of 2 mmol/L, showing a 3.83% increase compared with the control group. Additionally, the dry weight reached its minimum value at the KCl concentration of 2 mmol/L. Suitable concentration of KCl can enhance the absorption of water and facilitate the initial development of sprouts. Nevertheless, an excessive concentration could potentially result in ion toxicity within seeds, thereby impeding their growth.
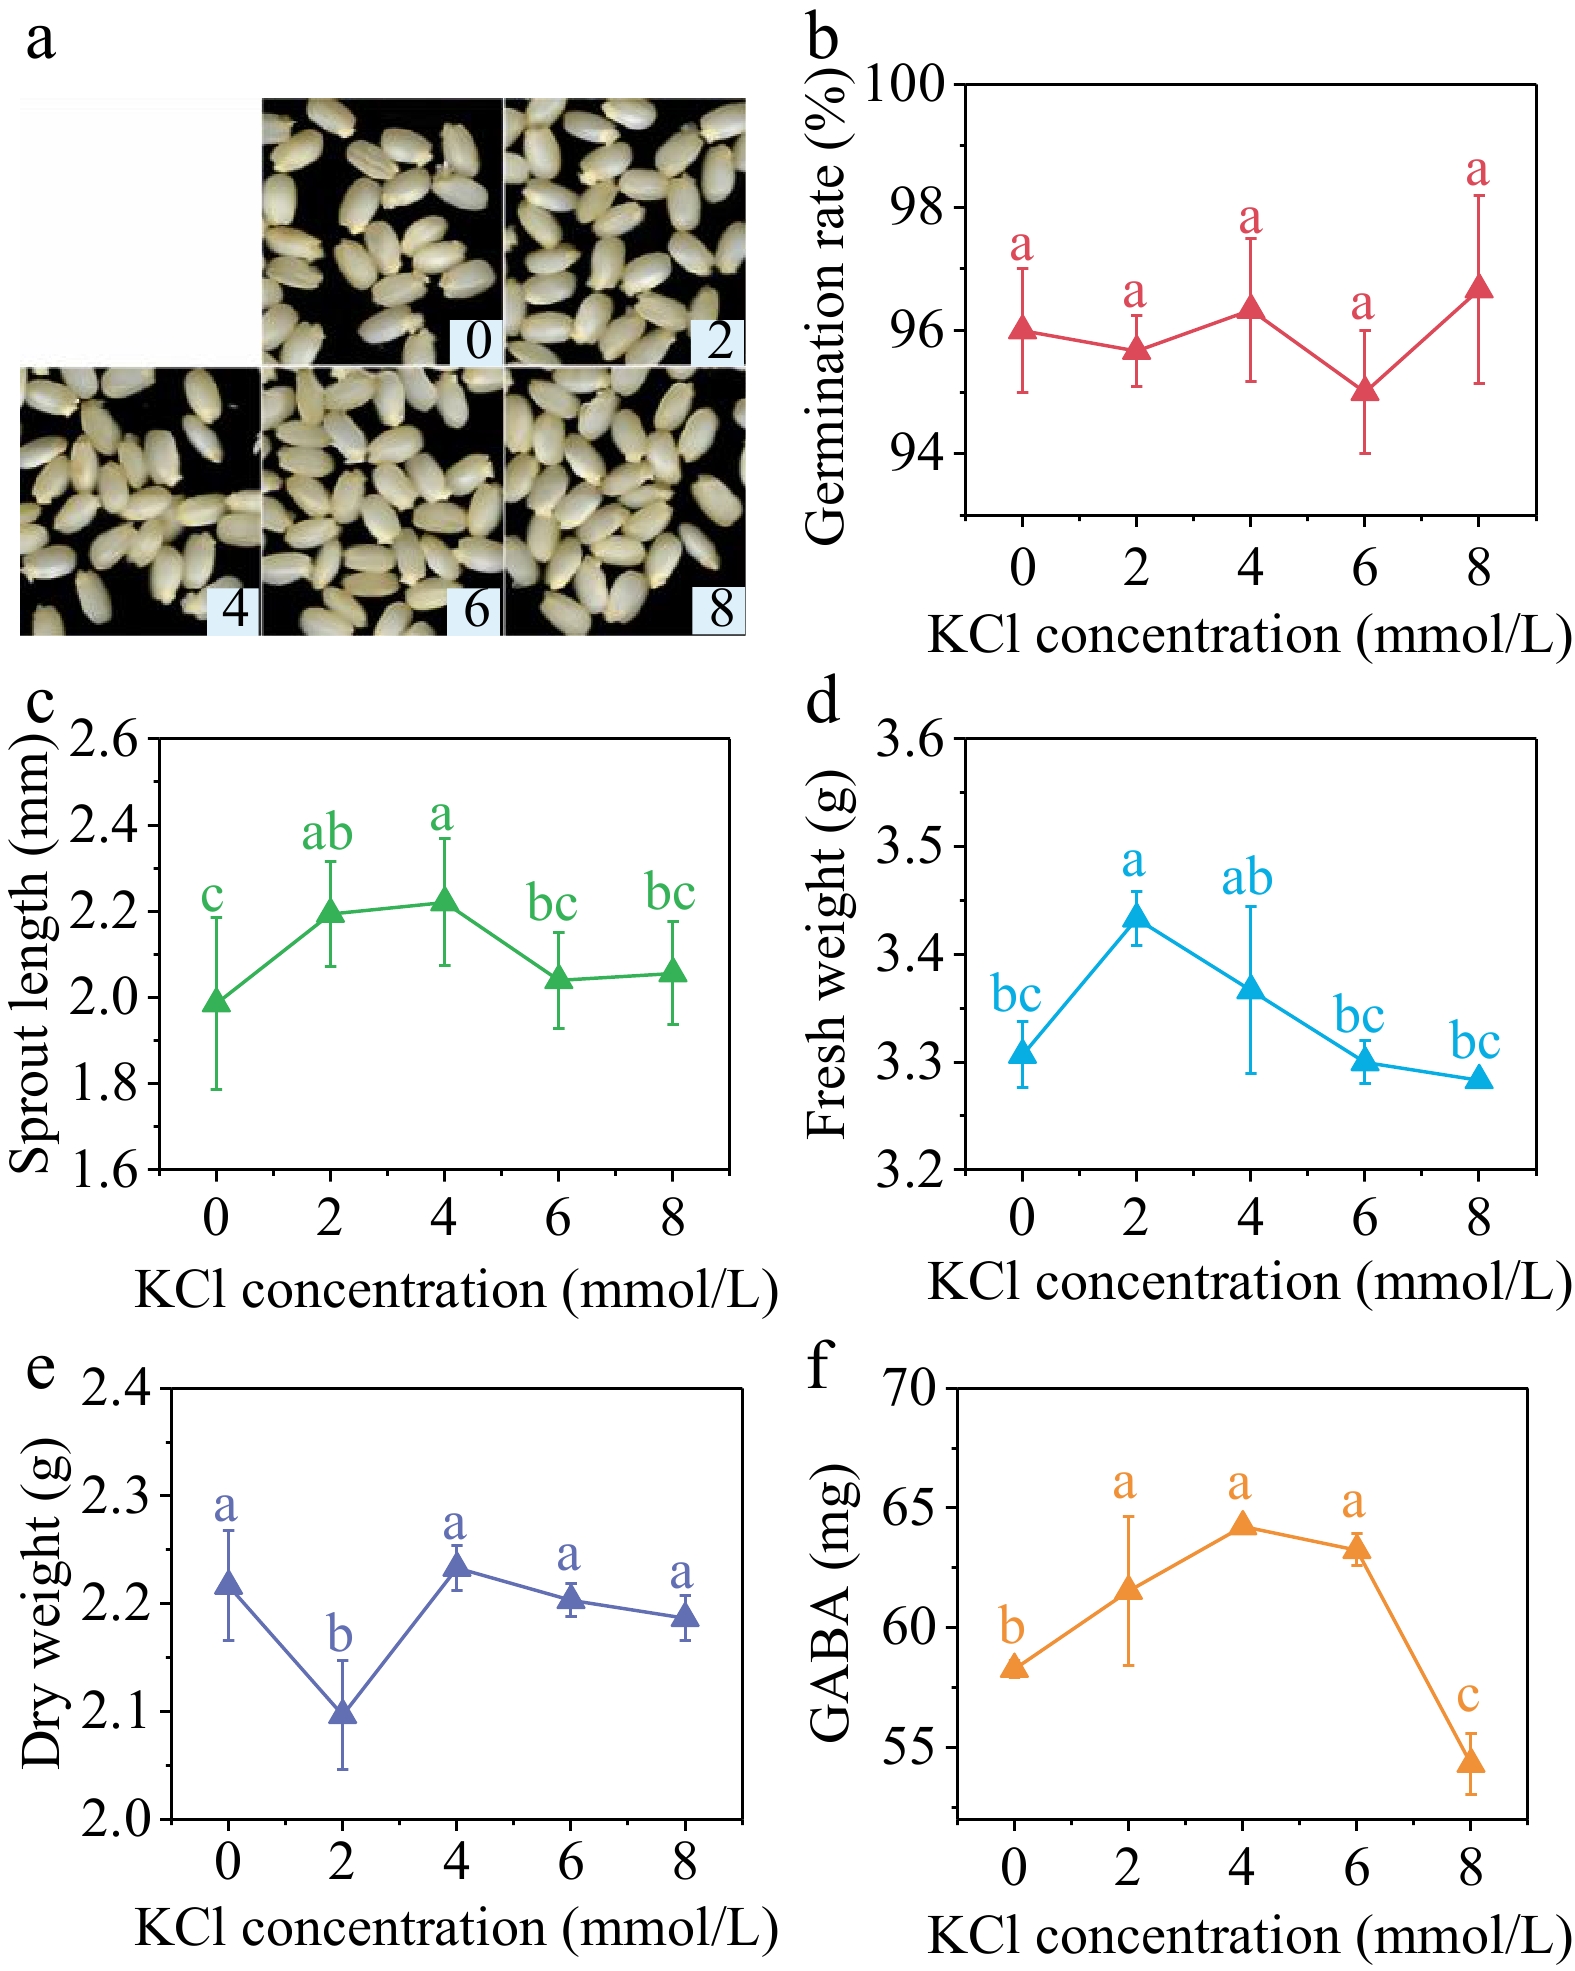
      Figure 5. 

      (a) Photos, (b) germination rate, (c) sprout length, (d) fresh weight, (e) dry weight and (f) GABA content in germinated brown rice cultivated by 0, 2, 4, 6, and 8 mmol/L KCl under 40 min, 10 mT SMF pretreatment for 40 min. Different lowercase letters represent significant difference between treatments (p < 0.05).

      The GABA content of germinated brown rice was significantly higher than the control group at KCl concentrations of 2, 4, and 6 mmol/L, with increases of 5.58%, 10.22%, and 8.52% respectively. However, at a KCl concentration of 8 mmol/L, the GABA content was significantly lower than the control group.

    • The Box-Behnken design and results are shown in Supplemental Table S1. The codings of different levels (−1, 0, 1) are shown in Supplemental Table S1. A second-order polynomial regression model was used to fit the data in Supplemental Table S3, and the obtained second-order polynomial regression equation is Y = 68.69 − 0.8037A + 0.7150B + 1.08C − 1.17AB + 0.4850AC + 0.5175BC − 2.98A2 − 0.6325B2 + 0.0000C2.

      To test the validity of the model, variance analysis of the response surface regression model for the data in Supplemental Table S3 was conducted, and the results are shown in Supplemental Table S4. By analyzing the multivariate quadratic regression model obtained from the Box-Behnken experiment, response surface and contour maps for different factors were obtained (Supplemental Fig. S2). Using Design-Expert 8.0 software, the optimal combination of process parameters was determined, and the predicted optimal culture medium concentrations for GABA enrichment were found to be NaCl 37.23 mmol/L, CaCl2 4.71 mmol/L, and KCl 5.75 mmol/L, with a GABA content of 69.783 mg/100 g. To validate reliability of this model, verification experiments were conducted, and the GABA content in germinated brown rice was found to be 69.42 mg/100 g, with an error of 0.52%, which is consistent with the predicted value, indicating a high level of model reliability.

    • According to Table 2, it can be seen that during the germination process, SMF treatment (treatment 1) increased the germination rate and fresh weight of germinated brown rice compared to the control group. The group treated with SMF and combined salt medium (treatment 2) had a growth trend similar to the control group.

      Table 2.  Changes in growth index, starch, protein and sugar during germination.

      TreatmentGermination
      time (h)
      Germination
      rate (%)
      Fresh weight
      (g/100 grains)
      Dry weight
      (g/100 grains)
      Starch
      (g/100 g)
      Amylose
      (g/100 g)
      Soluble protein
      (g/100 g)
      Soluble sugar
      (g/100 g)
      Control00.00 ± 0.00aD3.17 ± 0.02bC2.13 ± 0.03aA68.04 ± 2.67aA11.65 ± 0.21aC3.41 ± 0.50bCD6.53 ± 0.65aA
      1212.33 ± 1.53aC3.23 ± 0.02aB2.07 ± 0.01aB61.58 ± 0.60aB13.23 ± 0.98aA3.90 ± 0.26bBC5.64 ± 0.13aB
      2454.67 ± 3.06aB3.22 ± 0.02bBC2.03 ± 0.03aBC57.49 ± 1.37abC13.04 ± 0.13aAB3.08 ± 0.22cD4.54 ± 0.17aC
      3686.33 ± 0.58bA3.32 ± 0.02aA2.03 ± 0.01aBC54.38 ± 2.03aC12.75 ± 0.26bABC4.02 ± 0.30bB3.66 ± 0.24aD
      4889.67 ± 2.08bA3.29 ± 0.05aA2.01 ± 0.02aC53.99 ± 1.66aC11.76 ± 1.05aBC5.36 ± 0.05aA3.85 ± 0.62aCD
      Treatment 100.00 ± 0.00aD3.21 ± 0.02aB2.12 ± 0.02aA68.82 ± 9.09aA7.50 ± 0.88bA5.05 ± 0.40aA7.01 ± 0.96aA
      1216.67 ± 2.52aC3.23 ± 0.01aAB2.05 ± 0.01bB61.08 ± 2.35aAB9.88 ± 1.11bB5.03 ± 0.43aA5.70 ± 0.59aAB
      2461.00 ± 3.61aB3.29 ± 0.05aAB2.03 ± 0.01aBC60.17 ± 2.63aAB11.77 ± 0.72aA4.14 ± 0.10bC5.24 ± 0.93aB
      3692.67 ± 1.15aA3.34 ± 0.03aA2.04 ± 0.01aBC56.68 ± 1.93aB11.60 ± 0.89bB4.29 ± 0.17abBC3.57 ± 0.31aC
      4896.33 ± 0.58aA3.34 ± 0.12aA2.01 ± 0.02aC53.51 ± 2.38abB12.72 ± 0.85aA4.74 ± 0.16bAB3.34 ± 0.16aC
      Treatment 200.00 ± 0.00aD3.21 ± 0.02aC2.12 ± 0.02aA68.82 ± 9.09aA7.50 ± 0.88bC5.05 ± 0.40aA7.01 ± 0.96aA
      1212.00 ± 3.00aC3.26 ± 0.02aB2.09 ± 0.02aAB57.22 ± 0.41bB11.96 ± 0.97abB5.42 ± 0.04aA5.53 ± 0.24aB
      2456.33 ± 3.21aB3.32 ± 0.02aA2.05 ± 0.03aBC55.83 ± 0.8bB12.58 ± 1.19aAB5.23 ± 0.37aA4.92 ± 0.29aBC
      3686.67 ± 2.52bA3.34 ± 0.03aA2.03 ± 0.02aC53.94 ± 1.12aB13.93 ± 0.31aA4.50 ± 0.17aB3.97 ± 0.24aC
      4892.33 ± 1.15bA3.27 ± 0.02aB2.01 ± 0.01aC49.77 ± 1.78bB12.65 ± 0.91aAB4.11 ± 0.09cB4.05 ± 0.27aC
      Control: brown rice seeds were soaked for 6 h at 30 °C, not exposed to SMF and culture medium was DI water. Treatment 1: brown rice seeds were exposed to 10 mT SMF for 40 min and culture medium was DI water. Treatment 2: brown rice seeds were exposed to 10 mT SMF for 40 min and culture medium was combined salt solution. Different lowercase letters in the same column represent significant difference between treatments (p < 0.05). Different uppercase letters in the same column among the same treatment represent significant difference between different germination time (p < 0.05).

      The total amount of starch exhibited a consistent decline throughout the process of germination. During the 0−36 h germination stage, the starch content in the control group decreased from 68.04 to 54.38 g/100 g, with a faster rate of decrease compared with the 36−48 h stage (54.38 to 53.99 g/100 g). In treatment 1 group, there was no significant change (p > 0.05) in the total starch content when compared with the control group at 48 h. However, in the treatment 2 group it reduced by 7.83%. After SMF treatment, the content of amylose in brown rice decreased significantly by 55.33% immediately. Throughout the 0−36 h germination period, there was a noticeable upward trend in the ratio of amylose to dry weight. In the control group, the content of water-soluble protein generally increased during the 0−48 h germination period. In treatment 1 and treatment 2 groups, the water-soluble protein content was 48.09% higher after SMF treatment but decreased by 11.57% and 23.32% compared with the control group after 48 h of germination. The content of water-soluble sugars gradually decreased by 41.04%, 52.35%, and 42.23% after 48 h germination in contol, treatment 1 and treatment 2 group, respectively.

      The GABA content of three different treatment groups showed a rapid enrichment during 0−36 h of germination, with an increase of 33.45%, 34.70%, and 51.27% at 36 h compared with 0 h, respectively. However, there was no significant difference (p > 0.05) in GABA content between 36 and 48 h of germination in the same group. At 12 h of germination, the GABA content in the salt treatment group was lower than that in SMF treatment group, while at 36 h, the GABA content in treatment 2 group was significantly higher than that in treatment 1 group.

      The glutamic acid decarboxylase (GAD) activity of the salt-treated group reached its peak at 36 h and then declined. Meanwhile, the SMF treatment up-regulated the gene expression of GAD and GABA transaminase (GABA-T), with the gene expression of GABA-T reaching the highest level at 48 h of germination. The addition of salt treatment down-regulated the gene expression of GABA-T in the late stage of germination, effectively reducing the decomposition of GABA.

    • Germination is an environmentally friendly way to enrich GABA in brown rice, and it can also improve the edible quality[26]. The GABA content in different varieties of brown rice varies, with generally lower content in indica and glutinous rice, and higher content in japonica rice. The GABA content significantly increases after 36 h of germination, with japonica rice showing a higher increase compared to indica and glutinous rice (Fig. 1). The accumulation of GABA in brown rice, as well as the change of activity and gene expression of GAD, primarily occurs in the embryo of the grain, and rice with larger embryos typically have higher GABA content[27]. Akita et al.[28] studied 158 rice varieties, with embryo weights ranging from 0.28 to 0.76 mg for indica rice and 0.41 to 0.81 mg for japonica rice. The overall higher embryo weight in japonica rice may be the reason for its higher GABA content. However, Yao[29] studied 181 rice varieties and found no significant difference in GABA content between japonica and indica rice. However, it was observed that the GABA content in early-maturing rice was significantly greater than that in both medium-maturing and late-maturing rice. These results suggest that the duration and conditions of growth play a crucial role in influencing the GABA content in rice. Furthermore, it is noteworthy that this experiment revealed a notable disparity in GABA levels among cultivars within the same series (IV and V), potentially attributable to the distinct growth conditions specific to each variety.

      This study found that the GABA content in germinated brown rice can be further increased under the treatment of SMF and combined salt culture medium. In rice and other grain plants, the main metabolic pathway of GABA is known as the GABA shunt: Glutamic acid (GA) is conversed to GABA through the catalytic action of glutamic acid decarboxylase (GAD), which is then catalyzed by GABA-T to produce succinic acid[30]. The enrichment of GABA in brown rice by SMF may be mainly due to its ability to promote seed growth and regulate the activity of related synthetic enzymes in the early stages of germination and growth (Fig. 6). Studies suggest that SMF can activate the antioxidant defense system of plants and enhance early seed vitality by altering plant metabolism[31]. This study found that SMF treatment effectively promotes germination and early growth of brown rice, increasing germination rate, shoot length, and fresh weight, while reducing dry matter (Fig. 2). It has also been reported that SMF has no significant effect on the antioxidant enzyme activity of brown rice[11]. A study conducted by Jin et al.[32] demonstrates that SMF modulates the growth of Arabidopsis roots through its involvement in the auxin signaling system. At the same time, SMF can enhance GAD activity and inhibit GABA-T gene expression to promote GABA enrichment, which has also been verified in germinated brown rice[33] and maize[34]. In addition, the magnetic field can affect the synthesis and cell proliferation of DNA and RNA, activating the cellular stress response as a protective mechanism that induces gene expression in the stress response[35].
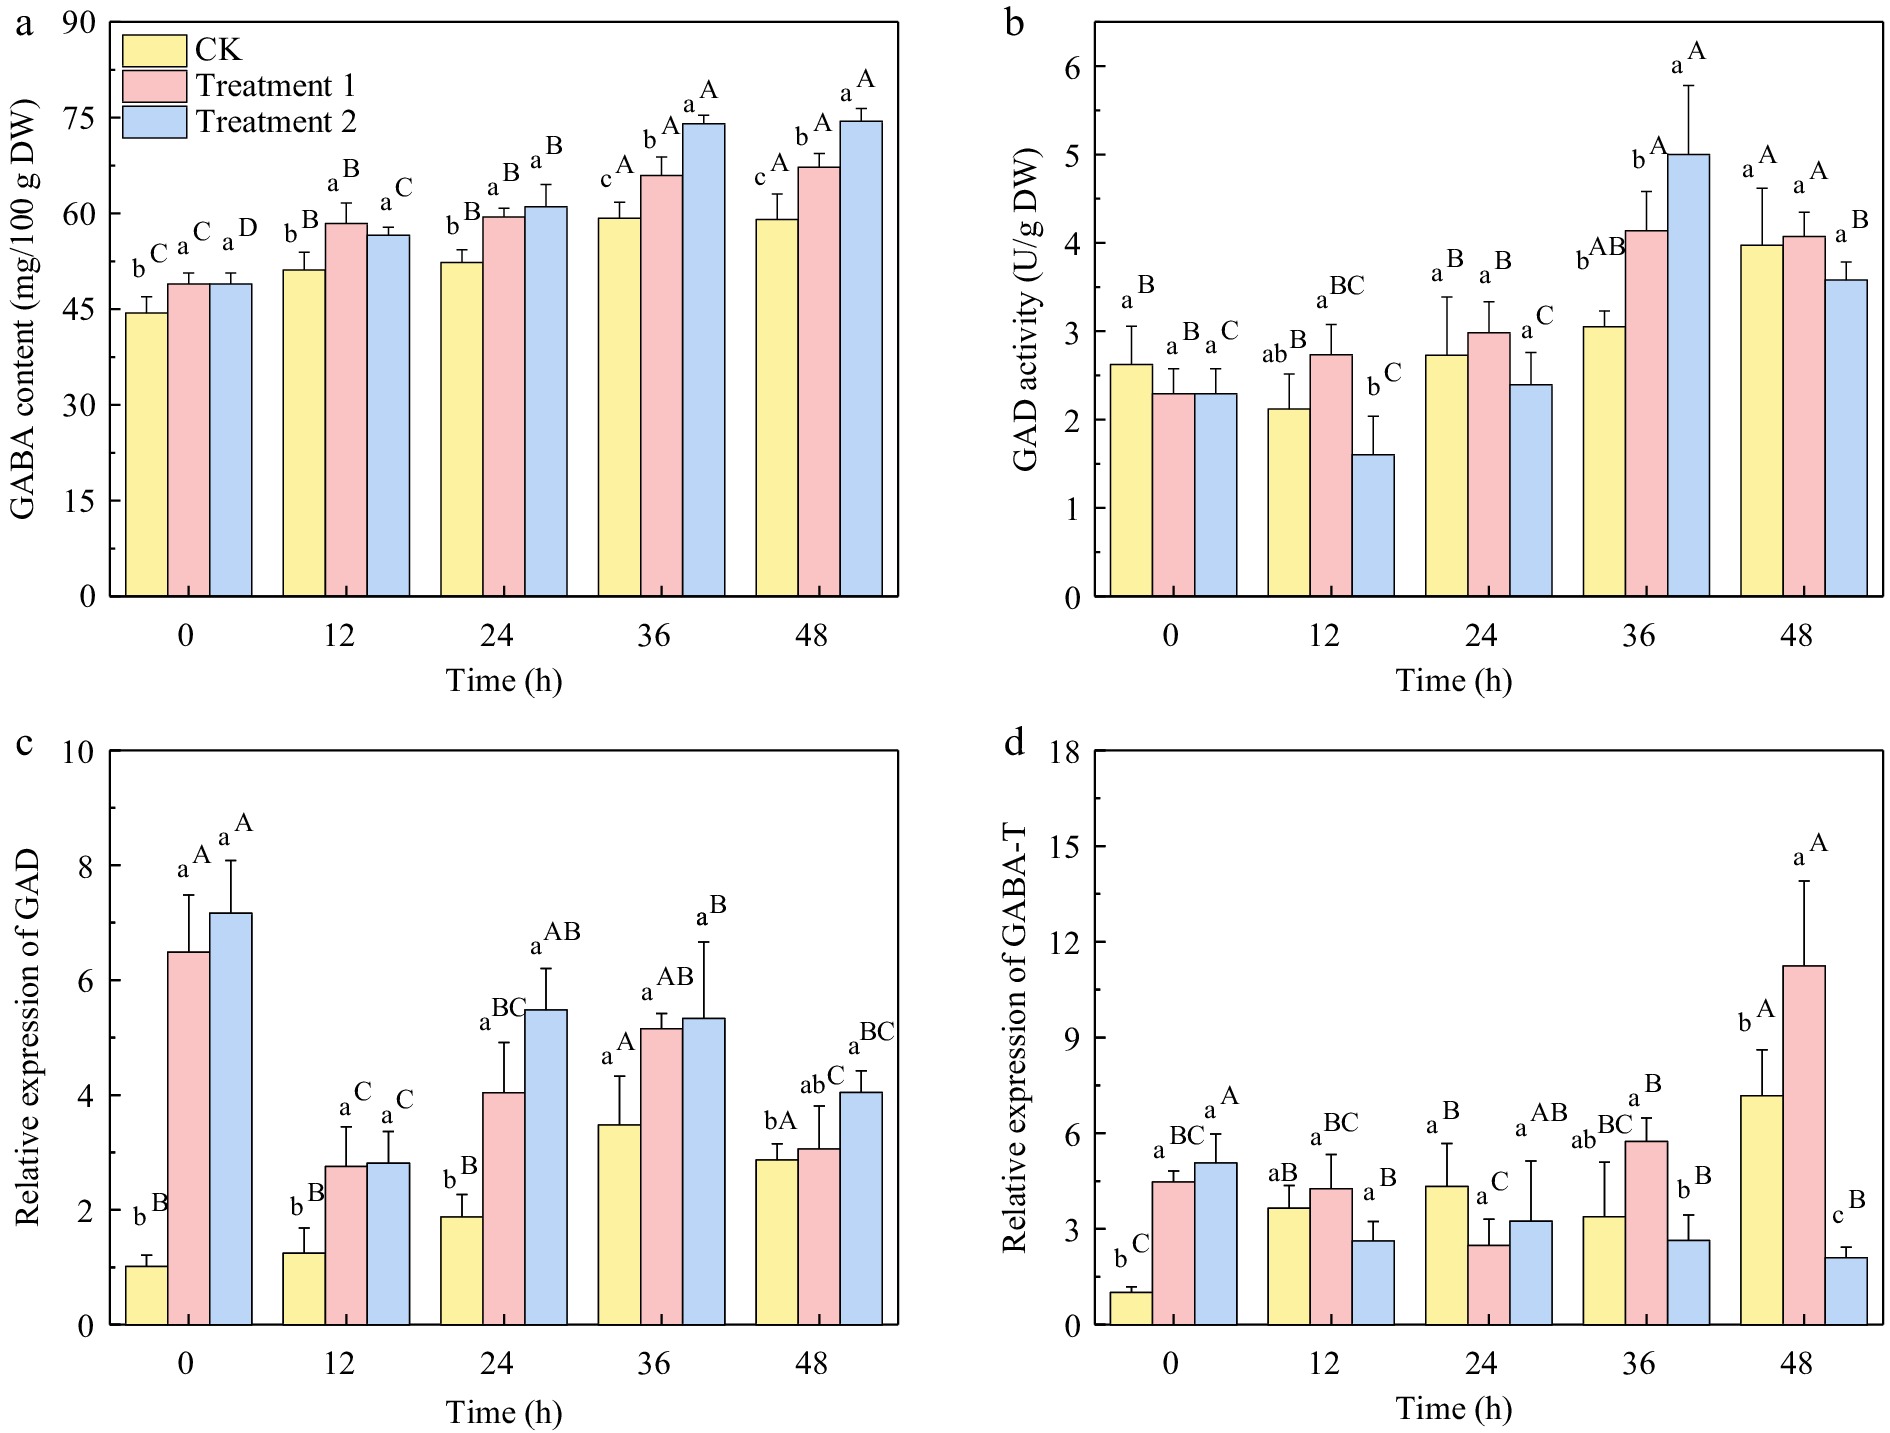
      Figure 6. 

      (a) GABA content, (b) GAD activity, (c) relative gene expression of GAD, and (d) GABA-T under different treatments of brown rice germinated for 0−48 h. CK: brown rice seeds were soaked for 6 h at 30 °C, not exposed to SMF and culture medium was DI water. Treatment 1: brown rice seeds were exposed to 10 mT SMF for 40 min and culture medium was DI water. Treatment 2: brown rice seeds were exposed to 10 mT SMF for 40 min and culture medium was combined salt solution. Different lowercase letters represent significant difference between treatments (p < 0.05). Different upper letters represent significant difference between different germination time among the same treatment (p < 0.05).

      The treatment of salt can further enrich GABA on the basis of SMF. NaCl is a widely distributed salt in nature and is also used as a seasoning in daily life. The appropriate salt concentration helps to enrich nutrients in the process of plant growth[36]. In soybeans, NaCl treatment can increase the content of GABA and phenolic substances[37]. NaCl at a concentration of 60 mM can cause accumulation of ROS and reduction of antioxidant enzyme activities in Cicer arietinum[38]. NaCl at concentrations more than 100 mM can decrease germination index, speed of germination and dry weight of rice[39]. A concentration between 20−60 mM was chosen in this resarch. In this study, SMF pretreatment promoted growth metabolism, while NaCl inhibited growth. The combined use of NaCl and SMF treatment resulted in a stress state and activated the GABA synthesis pathway. Thus, the GABA content was increased and no significant adverse effects on germination rate and appearance of brown rice were caused (Fig. 3). Ca2+ is an important second messenger that can be combined with calcium-modulated protein (CaM) to change the composition and activity of CaM, activate proteinases in plants, and regulate related physiological activity. GAD, which regulates GABA synthesis in the GABA shunt, is a CaM. The presence of Cl in soil is extensive, thereby many researches put efforts to investigate the impact of CaCl2 on plant growth. Some studies focused on higher concentrations (> 100 mmol/L) of CaCl2, and found that it slightly improved the germination and growth of brown rice[40]. Germinated brown rice is a kind of food product. In order to reduce the presence of additives, treatments with a lower concentration of CaCl2 was chosen. Potassium, an element with high reactivity, is abundantly found in nature in the form of various salts. The K+ has the ability to initiate the activation of enzymes that are essential for many plant growth processes. Additionally, K+ plays a crucial role in safeguarding seeds by regulating the antioxidant defense system[41]. This study employed a diluted solution of potassium chloride (KCl) to facilitate the growth of the subject and enhance the process of synthesizing metabolic compounds. Low concentration KCl was used in this study, which can promote growth and anabolism of brown rice.

      Researchers also discovered that the addition of Ca2+[16] or K+[42] can impede the excessive buildup of reactive oxygen species (ROS) by activating protective mechanisms like the AsA-GSH pathway and the acetaldehyde enzyme system. As a result, this effectively alleviates the harm caused by salt stress and restores the adverse effects of NaCl on plant growth and yield attributes. Furthermore, previous studies have demonstrated that the application of SMF enhances the transmembrane flux of Ca2+ and enhances the permeability of cellular membranes[43]. Hence, the use of SMF combined salt treatment has the potential to reduce the use of salt in production and save resources. This study innovatively combined three chloride salt culture medium and introduced SMF pretreatment. It was found that GABA content was significantly increased and GABA-T gene expression was significantly down-regulated under the optimized condition , indicating that the combined culture medium of different chloride salts would not lead to excessive ion concentration and inhibit GABA synthesis.

    • In brief, among nine rice cultivars, cultivar V exhibits the highest GABA content both before and after germination. This particular characteristic renders variety V a potential candidate for the purpose of GABA enrichment. The application of SMF treatment has been found to facilitate the early germination of brown rice, enhance the activity of GAD and promote the enrichment of GABA. The addition of combined salt solution can further increase the GABA content of brown rice treated with SMF by salt stress, and can down-regulate the activity of GABA-T in the late germination stage, inhibiting GABA degradation. Furthermore, the combined use of these two treatments did not impede the synthesis of GABA or the growth of germinated brown rice related to the presence of elevated ion concentrations. Magnetic field treatment could also enhance the carbon framework structure of starch and reduce the content of amylose, but during the germination process, the content of amylose gradually returns to normal, indicating that the change in starch structure caused by the magnetic field is reversible.

    • The authors confirm contribution to the paper as follows: study conception and design: Zhu Y ,Yang R; data collection: Xie C, Wang P, Li D; analysis and interpretation of results: Zhu Y, Tan S; draft manuscript preparation: Zhu Y, Yang R. All authors reviewed the results and approved the final version of the manuscript.

    • The datasets generated during and/or analyzed during the current study are available from the corresponding author on reasonable request.

      • This work was supported by Anhui Provincial Key Research and Development Plan (2023n06020001) and a Project Funded by the Priority Academic Program Development of Jiangsu Higher Education Institutions (PAPD).

      • The authors declare that they have no conflict of interest.

      • Copyright: © 2024 by the author(s). Published by Maximum Academic Press on behalf of Nanjing Agricultural University. This article is an open access article distributed under Creative Commons Attribution License (CC BY 4.0), visit https://creativecommons.org/licenses/by/4.0/.
    Figure (6)  Table (2) References (43)
  • About this article
    Cite this article
    Zhu Y, Tan S, Xie C, Li D, Wang P, et al. 2024. Effects of magnetic field pretreatment and chloride salt stress on physio-biochemical changes and γ-aminobutyric acid accumulation in germinated brown rice. Food Materials Research 4: e015 doi: 10.48130/fmr-0024-0006
    Zhu Y, Tan S, Xie C, Li D, Wang P, et al. 2024. Effects of magnetic field pretreatment and chloride salt stress on physio-biochemical changes and γ-aminobutyric acid accumulation in germinated brown rice. Food Materials Research 4: e015 doi: 10.48130/fmr-0024-0006

Catalog

  • About this article

/

DownLoad:  Full-Size Img  PowerPoint
Return
Return