ARTICLE   Open Access    

CRISPR/Cas9 ribonucleoprotein mediated DNA-free genome editing in larch

More Information
  • Received: 04 September 2024
    Revised: 07 October 2024
    Accepted: 24 October 2024
    Published online: 31 October 2024
    Forestry Research  4 Article number: e036 (2024)  |  Cite this article
  • Here, a DNA-free genetic editing approach is presented for larch by delivering ribonucleoprotein complexes (RNPs) of CRISPR/Cas9 through particle bombardment. The detailed procedure encompasses creating a transgenic system via particle bombardment for the transformation of embryogenic callus, validating the functionality of RNPs, optimizing coating and delivery techniques, enhancing somatic embryo maturation, regenerating plantlets, and precisely identifying mutants. The optimal particle bombardment parameters were determined at 1,100 psi and a distance of 9 cm and the editing efficiency of the targets was verified in vitro. Subsequently, the RNPs were transferred into the embryogenic callus. Mutant plants were obtained in targets 1 and target 2. The efficiencies of obtaining albino somatic embryos were 1.423% and 2.136%, respectively. A DNA-free particle bombardment transformation method suitable for larch has been established. The present study demonstrates that the DNA-free editing technology has been successfully implemented in larch. This method can achieve targeted genome editing in the larch genome, avoiding the risks of genomic integration and the lengthy breeding cycles associated with traditional transgenic methods. Moreover, it may be widely applicable for producing genome-edited conifer plants and holds great promise for commercialization.
  • Sweet cherries (Prunus avium L.) are a major focus of agriculture in the Okanagan region of British Columbia (BC), Canada. A large portion of the cherries grown in BC are exported and undergo up to four weeks of storage during transportation before delivery and consumption[1]. In 2022, sweet cherries accounted for 11.6% of the revenue of exported fruit from Canada and have an export value of nearly CAD$130 million[2]. As such, sweet cherry is an important fruit with high commercial importance for Canada. Although the application of cold storage is a necessary postharvest tool to maintain fruit quality up to consumption, there are preharvest factors that impact quality after longer-term storage. The work of Serrano et al.[3] noted that the maturity stage at harvest determined the fruit quality of sweet cherries after storage. For this reason, producers use several parameters to establish the optimum time for harvesting. Producers have long used colour as a marker for maturity, yet the concept of fruit dry matter (DM) at harvest affecting post-storage quality has advanced[46]. In fact, Toivonen et al.[6] developed a predictive model for 'Lapins' sweet cherry DM content using a visible/near-infrared spectrometer and noted its potential application to other cultivars to provide a rapid and non-destructive means of determining DM linked to cherry fruit quality. If sweet cherries are harvested at the wrong time or stored improperly during transit the quality of the cherries at their final destination does not compare to that at the time of harvest. Therefore, it is of the utmost importance to harvest cherries at their optimal time to ensure quality retention. Cherry fruits have minimal reserve carbohydrates so respiration relies primarily upon organic acids[7]. Additionally, cherries have a high susceptibility to physical damage making them highly perishable, so it is imperative to store them properly to maintain their flavour profile and overall quality[811]. Lower respiration rates help to maintain higher titratable acidity (TA) levels, thereby retaining flavour quality[11,12]. Decreased respiration rates are achieved through low-temperature storage and shipping.

    Previous research linking cherry fruit maturity to flavour quality indicated early-harvested cherries with low soluble solids (SS) levels showed low consumer acceptance due to perceived low sweetness, while late-harvested cherries showed low consumer acceptance due to poor texture[13,14]. This information underscores the challenge growers face when determining picking date. Additionally, once cherries are harvested, quality changes occur which include changes in the balance of SS to TA levels. Previous work has shown that SS levels remain relatively constant while malic acid levels (the predominant acid in sweet cherries) decreased by 20% when stored for 4 d at 20 °C[8,14]. Further, SS, TA, and the SS/TA ratio are key parameters in defining flavour quality[15] and consumer acceptance[14] as SS and TA have been reported to be measures of the cherry fruit attributes of sweetness, and sourness, respectively. Additionally, the SS/TA ratio is regarded as an overall taste attribute determining sweet cherry acceptability[14,16,17].

    Depending on cultivar and growing location, SS values for sweet cherries have been reported to range from 12.3 to 23.7 °Brix[14]. Rootstock and storage conditions have also been reported to affect SS, TA, and SS/TA values[18]. Depending on rootstock, for 'Regina' sweet cherries, harvest SS values ranged from 14.8 to 16.6 °Brix and TA values ranged from 5.7 to 7.4 g·L−1, while SS values after storage ranged from 14.6 to 18.2 °Brix and TA values ranged from 4.4 to 6.0 g·L−1. The harvest SS/TA ratio ranged from 2.0 to 2.91 and the SS/TA ratio after storage ranged from 2.47 to 3.77 depending on rootstock. Based on sensory studies using various cherry cultivars and breeding selections to gauge flavour quality and consumer acceptance, the optimal SS/TA ratio was reported to be between 1.5 and 2.0, with SS values ranging between 17 and 19 °Brix[19].

    Unfortunately, members of British Columbia's sweet cherry industry have noted that while their cherries arrive at their export locations with good condition in terms of appearance (i.e. firm, shiny, with green stems), issues have been reported concerning flavour. Poor flavour has been associated with lower levels of TA and lower oxygen in the storage atmosphere. Our previous work noted that BC cherry growers tend to pick their cherries at lighter colours in an attempt to harvest the crop as soon as possible to avoid any weather or pest issues and achieve the highest yield possible[1]. Staccato (SC) is a late maturing economically important cultivar with little research data available. It has been reported that SC cherries have a respiration rate that is negatively correlated with colour when collected between a 2 to 6 colour level as determined with CTFIL (Centre Technique Interprofessionnel des Fruit et Legumes, Paris, France) colour chips[1], which have been typically used as a marker of maturity. For SC cultivars, data showed the lowest respiration levels with cherries harvested at CTFIL colour standards 4-5, and may potentially have better flavour quality retention due to these lower respiration rates[1]. The aim of the work was to: 1) examine indicators of maturity/readiness for harvest (colour, SS, DM, TA, and the ratio of soluble solids to titratable acidity (SS/TA)); and 2) determine whether colour at harvest or other parameters (SS, TA, SS/TA, and DM) better predict flavour quality retention after storage.

    Sweetheart (SH), Staccato (SC), and Sentennial (SL) sweet cherries were sourced from research plots located at the Summerland Research and Development Center (SuRDC, Summerland, BC, Canada) in the Okanagan Valley region of British Columbia over three growing seasons (2018, 2019, and 2021). In the 2018 growing season, two cherry cultivars (SH and SC were collected, in the 2019 growing season, in response to BC Cherry Association interest, three cherry cultivars (SH, SC, and SL) were collected. Due to COVID, data was not collected during the 2020 growing season. In the 2021 growing season, full data (SS, TA, DM, and respiration rate) was only collected on the SC cherry cultivar, while DM and respiration values at harvest were also collected for SH and SL cultivars.

    To collect fruit at different maturity levels, cherry fruits were collected at three different color levels using the CTFIL (Centre Technique Interprofessionnel des Fruit et Legumes, Paris, France) colour standard series at three harvest dates for each cultivar which corresponded to the 3-4, 4-5, and 5-6 colour levels.

    To collect environmental data, two trees were chosen in each orchard block and Onset HOBO (Bourne, MA, USA) temperature and humidity loggers were mounted in these trees as described by Ross et al.[1] and captured data at 10 min intervals. The temperature and humidity data were used to calculate average temperature (AT), average high temperature (AHT), average low temperature (ALT), and average relative humidity (ARH) for 28 d preceding the cherry harvest date.

    Cherries were generally harvested before 11:00 h on each harvest day. Harvested cherries were transported back to the lab for sorting, sampling, and storage. Upon arrival, cherries were placed into a walk-in cooler at 0.5 °C to mimic rapid hydro-cooling capabilities that the industry uses. In the afternoon of each harvest day, cherries were removed from the cooler and sorted following British Columbia Tree Fruits Company protocol: (i) size was greater than 25.4 mm (< 10.5 row size); (ii) stemless cherries were removed; and (iii) cherries with defects such as blemishes, splits, pitting, disease (rot, fungi), hail damage and insect damage were removed. Again, the colour of the cherries was assessed using the CTFIL colour standard series. Based on the harvest period, cherries were separated into different colour levels: 3-4, 4-5, and 5-6. For each colour category, quality assessments (DM, SS, TA, SS/TA ratio, firmness, size, stem pull force, stem shrivel, stem browning, pitting, and pebbling) were performed before and after storage.

    Maintaining the quality of sweet cherries undergoing long distance ocean container shipment (up to 28 d/4 weeks) is important for securing a successful export market for Canadian sweet cherries and for ensuring that current market demand is met[1]. For cherries to be marketable after storage, they must pass several quality attributes. Attributes of firmness, size, stem pull force, stem shrivel, stem browning, pitting, and pebbling were assessed using previously described methods[1,20] to assess fruit quality at harvest and after storage for 28 d at 0.5 °C, ideal refrigerated storage temperature, for all cherry cultivars, and also storage for 28 d at 3 °C, non-ideal refrigerated storage temperature, for SC cherries. The values of these parameters are provided in Supplementary Tables S1S6. As the focus of this work was to examine how maturity level at harvest influenced the flavour quality of SC, SH, and SL sweet cherry cultivars, SS, DM, TA, and respiration rate values were the focus for discussion. Respiration analysis was performed using methods described by Ross et al. on freshly harvested cherries[1]. Rates of CO2 production were expressed as mg CO2 kg−1·h−1.

    DM of the cherries was determined using a Felix F750 handheld spectrometer (Felix Instruments, Inc., Camas, WA, USA) loaded with a valid model developed at the Summerland Research and Development Centre for cherries[6]. DM was measured on 25 fruits that were randomly selected from each sample replicate (i.e. 50 cherries). For SS and TA analyses, the methods of Ross et al.[1,20] were used to test 25 fruits that were randomly selected from each sample replicate (i.e. 50 cherries). Briefly, de-stemmed cherries were transferred into a 15.2 cm × 22.9 cm polyethylene Ziplock bag. The bag was left partially open, and the cherries were pressed by hand to obtain juice. The juice was strained and collected into 60 mL polypropylene screw cap containers. The resulting filtrate was tested for SS (°Brix), and TA (g·L−1 malic acid). For SS determination, the refractive indices of the solutions were observed in °Brix temperature-corrected mode on a digital refractometer (Mettler-Toledo, Refracto 30PX, 13/02, LXC13237, Japan). An automated titrator (Metrohm 848 Tritrino Plus; Mississauga, ON, Canada) was used to measure the TA of 10 mL of the juice with 65 mL distilled water to an endpoint of 8.1 with 0.1 mol·L−1 NaOH.

    At each colour level (3-4, 4-5, or 5-6) 10 kg of cherry samples were cooled to either 0.5 or 3 °C (for SC in 2021) and then packed into cardboard boxes with a polyethylene liner, an absorbent pad, and an iButton (Thermodata, Whitewater, WI, USA), which measured temperatures experienced by the cherries in the cardboard boxes during storage. After 28 d, the same quality assessment tests were performed to see if values varied throughout storage time at each temperature.

    Statistical analysis was conducted using SAS Institute Inc. software version 9.3 (SAS Institute, Cary, NC, USA). Data were subjected to a four-way analysis of variance (ANOVA) using the SAS PROC GLM procedure. The four factors tested were colour level (3-4, 4-5, and 5-6), cultivar (SH, SC, and SL), growing year (2018, 2019, and 2021), and time (harvest or storage (0.5 °C)). The significance of the main effects and interaction of the four factors was determined using Type III sum of squares via the ANOVA test. Additionally, ANOVA using the SAS PROC GLM procedure was performed on data collected for SC cultivar in the 2021 growing year to assess the influence on storage temperature (0.5 and 3 °C) on quality parameters. Statistical significance was determined by least significant difference (LSD) Fisher's test at 5% significance level. Principal Component Analysis (PCA) was performed using SAS version 9.3 PROC PRINCOMP (SAS Institute Inc., Cary, NC, USA) on data collected from the three cultivars over the tested growing years at three colour levels (i.e., up to nine samples per cultivar) and 10 variables for each investigation. Variables included: AT, AHT, ALT, ARH, colour at harvest (ColourH), SS at harvest (SSH), SS after 28 d of storage at 0.5 °C (SS05), TA at harvest (TAH), TA after 28 d of storage at 0.5 °C (TA05), and DM of cherry fruit at harvest (DMH). Microsoft Excel was used to generate PCA plots from the data provided by SAS. Only data available for every growing year were included in the PCA. Correlation coefficients were determined using Pearson's correlation coefficient statistical function in Excel (version 2306, Microsoft, Redmond, WA, USA). Histograms and frequency data were generated using the statistical function in Excel (version 2306, Microsoft, Redmond, WA, USA). Dry matter bin sizes of 1.5% increments were used to present and analyze the histogram and frequency data.

    Tables 14 present data on flavour attributes via values of soluble solids (SS), titratable acidity (TA), SS/TA ratio, and dry matter (DM) as affected by cultivar, growing year, storage and colour level at harvest and after storage, respectively. The most influential parameters in sweet cherry flavour have been found to be SS, TA, and the SS/TA ratio[15]. Additionally, SS and TA values have been found to be related to DM values in kiwis[2124], apples[25], and cherries[6,26]. DM is a measure of solids which includes both soluble sugars and acids along with insoluble structural carbohydrates and starch. Crisosto et al.[4] proposed using DM as an additional quality parameter as DM was determined not to change during cold storage[22]. Toivonen et al.[6] have performed research linking dry matter measurements with sweet cherry quality. As cold storage is also used to maintain cherry quality, assessing DM at harvest and upon storage was of relevance, and a key aspect of this work was to examine how DM values relate to sweet cherry respiration rates and cherry quality parameters.

    Table 1.  Soluble solids values as affected by cultivar, growing year, storage, and colour level at harvest.
    Cultivar Colour level Soluble solids (SS, °Brix)
    2018 2019 2021
    Harvest Storage (0.5 °C) Harvest Storage (0.5 °C) Harvest Storage (0.5 °C) [3 °C]
    Sweetheart 3-4 18.1aA1 17.7aA1 18.1aA1 18.2aA1
    4-5 20.0bA1 19.8bA1 19.4bA1 18.8bA1
    5-6 21.9cA1* 21.1cA1* 19.9bA1* 19.6cA1*
    Staccato 3-4 17.2aA2 17.2aA1 17.1aA2 17.2aA1 18.8aA* 18.9aA*
    18.4a
    4-5 17.8aA2 17.9aA2 18.3bA23 18.1bA1 19.9bA* 18.6aB
    18.9ab
    5-6 20.2bA2 17.9aB2* 20.2cA1 20.3cA13 20.1bA 19.5aA
    19.7b
    Sentennial 3-4 18.1aA1 18.1aA1
    4-5 18.9bA13 18.5aA1
    5-6 20.8cA2 20.6bA23
    Main effects Significance F-value Degrees of freedom
    Cultivar p < 0.0001 36.90 2
    Colour level p < 0.0001 125.76 2
    Year p < 0.0001 9.26 2
    Time (harvest or storage at 0.5 °C) p = 0.0002 13.68 1
    Colour differences: within common time and cultivar, values followed by different lower case letters indicate significant differences (p ≤ 0.05); Cultivar differences: within common colour level and time, values followed by different numbers indicate significant differences (p ≤ 0.05); Growing year differences: within common time, colour level and cultivar, values followed by * indicate significant differences (p ≤ 0.05); Storage differences (Harvest versus 0.5 °C storage): within common cultivar, colour level and growing year, values followed by different uppercase letter indicate significant differences (p ≤ 0.05); Temperature differences: within Staccato cultivar at 28 d storage and at common colour level, bolded values indicate significant differences (p ≤ 0.05) between storage temperatures (0.5 °C vs 3 °C). (N.B. no bolded values appear in this table).
     | Show Table
    DownLoad: CSV
    Table 2.  Titratable acidity values as affected by cultivar, growing year, storage and colour level at harvest.
    Cultivar Colour level Titratable acidity (TA, g·L−1 malic acid)
    2018 2019 2021
    Harvest Storage (0.5 °C) Harvest Storage (0.5 °C) Harvest Storage (0.5 °C) [3 °C]
    Sweetheart 3-4 8.99aA1* 7.11aB1* 7.31aA1* 6.31aB1*
    4-5 9.55bA1* 7.57bB1* 7.14aA1* 6.13aB1*
    5-6 10.56cA1* 8.57cB1* 7.56aA1* 6.50aB1*
    Staccato 3-4 8.53aA2* 6.65aB2* 6.96aA1* 5.51aB2* 12.0aA* 10.5aB*
    9.7a
    4-5 8.87abA2* 7.04bB2* 7.30aA1* 6.21bB1* 12.8aA* 10.2aB*
    9.3a
    5-6 8.91bA2* 6.91abB2 7.18aA1* 6.46bB1 10.6bA* 9.5b*
    8.5b
    Sentennial 3-4 9.21acA2 7.60aB3
    4-5 9.33aA2 7.89aB2
    5-6 8.79bcA2 7.66aB2
    Main effects Significance F-value Degrees of freedom
    Cultivar p < 0.0001 193.58 2
    Colour level p = 0.0023 5.49 2
    Year p < 0.0001 1,007.20 2
    Time (harvest or storage at 0.5 °C) p < 0.0001 474.18 1
    Colour differences: within common time and cultivar, values followed by different lower case letters indicate significant differences (p ≤ 0.05); Cultivar differences: within common colour level and time, values followed by different numbers indicate significant differences (p ≤ 0.05); Growing year differences: within common time, colour level and cultivar, values followed by * indicate significant differences (p ≤ 0.05); Storage differences (Harvest versus 0.5 °C storage): within common cultivar, colour level and growing year, values followed by different uppercase letter indicate significant differences (p ≤ 0.05); Temperature differences: within Staccato cultivar at 28 d storage and at common colour level, bolded values indicate significant differences (p ≤ 0.05) between storage temperatures (0.5 °C vs 3 °C).
     | Show Table
    DownLoad: CSV
    Table 3.  Soluble solids to titratable acidity ratio values as affected by cultivar, growing year, storage and colour level at harvest.
    Cultivar Colour level Soluble solids to titratable acidity ratio (SS/TA)
    2018 2019 2021
    Harvest Storage (0.5 °C) Harvest Storage (0.5 °C) Harvest Storage (0.5 °C) [3 °C]
    Sweetheart 3-4 2.02a1A* 2.49a1B* 2.49a1A* 2.78a1B*
    4-5 2.09a1A* 2.61a1B* 2.71b1A* 3.06b1B*
    5-6 2.07a1A* 2.46a1B* 2.63b1A* 3.02b1B*
    Staccato 3-4 2.01a1A* 2.58a1B* 2.46a1A* 3.11a2B* 1.57aA* 1.79aB*
    1.89a
    4-5 2.0a1A* 2.54a1B* 2.51a2A* 2.91b1B* 1.55aA* 1.83aB*
    2.04a
    5-6 2.27b2A* 2.58a1B* 2.81b1A* 3.14a1B* 1.89bA* 2.06bB*
    2.32b
    Sentennial 3-4 1.97a2A 2.38a3B
    4-5 2.02a3A 2.34a2B
    5-6 2.37b2A 2.69b2B
    Main effects Significance F-value Degrees of freedom
    Cultivar p < 0.0001 94.79 2
    Colour level p < 0.0001 22.04 2
    Year p < 0.0001 361.13 2
    Time (harvest or storage at 0.5 °C) p < 0.0001 134.15 1
    Colour differences: within common time and cultivar, values followed by different lower case letters indicate significant differences (p ≤ 0.05); Cultivar differences: within common colour level and time, values followed by different numbers indicate significant differences (p ≤ 0.05); Growing year differences: within common time, colour level and cultivar, values followed by * indicate significant differences (p ≤ 0.05); Storage differences (Harvest versus 0.5 °C storage): within common cultivar, colour level and growing year, values followed by different uppercase letter indicate significant differences (p ≤ 0.05); Temperature differences: within Staccato cultivar at 28 d storage and at common colour level, bolded values indicate significant differences (p ≤ 0.05) between storage temperatures (0.5 °C vs 3 °C).
     | Show Table
    DownLoad: CSV
    Table 4.  Dry matter values as affected by cultivar, growing year, storage and colour level at harvest.
    Cultivar Colour level Dry matter (DM, %)
    2018 2019 2021
    Harvest Storage (0.5 °C) Harvest Storage (0.5 °C) Harvest Storage (0.5 °C) [3 °C]
    Sweetheart 3-4 20.9aA1* 20.6aA1* 18.6aA1* 18.6aA1* 22.1aA1*
    4-5 21.9bA1 22.0bA1* 19.9bA1* 19.8acA1* 22.5bA1
    5-6 25.2cA1* 23.5cB1* 21.1cA1* 20.6bcA1* 23.6cA1*
    Staccato 3-4 20.2aA1* 19.5aA2* 18.4aA2* 18.1aA23* 21.0aA2* 20.6aA*
    19.8a
    4-5 20.4aA2* 20.8bA2* 19.1aA1* 18.8aA2* 22.0bA2* 21.6bA*
    21.9b
    5-6 22.4bA2 22.3cA2 22.9bA2* 21.6bA23 23.0cA2 22.2bA
    22.4b
    Sentennial 3-4 18.2aA2 18.4aA13 20.5aA2*
    4-5 19.3bA1 18.8bA2 22.6bA12*
    5-6 22.9cA2 20.9bA13 23.5cA12
    Main effects Significance F-value Degrees of freedom
    Cultivar p < 0.0001 11.36 2
    Colour level p < 0.0001 130.99 2
    Year p < 0.0001 56.64 2
    Time (harvest or storage at 0.5 °C) Not significant, p = 0.0922 2.97 1
    Colour differences: within common time and cultivar, values followed by different lower case letters indicate significant differences (p ≤ 0.05); Cultivar differences: within common colour level and time, values followed by different numbers indicate significant differences (p ≤ 0.05); Growing year differences: within common time, colour level and cultivar, values followed by * indicate significant differences (p ≤ 0.05); Storage differences (Harvest versus 0.5 °C storage): within common cultivar, colour level and growing year, values followed by different uppercase letter indicate significant differences (p ≤ 0.05); Temperature differences: within Staccato cultivar at 28 d storage and at common colour level, bolded values indicate significant differences (p ≤ 0.05) between storage temperatures (0.5 °C vs 3 °C). (N.B. no bolded values appear in this table).
     | Show Table
    DownLoad: CSV

    Data in Table 1 shows the SS levels at each colour level for each sweet cherry cultivar. Overall, SH cherries at harvest had ranges of 18.1%−21.9% over the 2018 and 2019 growing seasons. SC cherries at harvest had levels between 17.1%−20.2% over the three growing years (2018, 2019, and 2021), while SL cherries at harvest had levels of 18.1%−20.8% in 2019. Statistical analysis showed that the main effects of Cultivar (p < 0.0001; F-value = 36.90; degrees of freedom (df) = 2), Colour (p < 0.0001; F-value = 125.76, df = 2), Time (p = 0.0007; F-value = 13.68; df = 1), and Year (p < 0.0001; F-value = 9.26; df = 2) were all significant. Additionally, the interactions of Cultivar * Year (p < 0.0001, F-value = 26.37; df = 1), Colour * Year (p < 0.0069; F-value = 4.19; df = 4), Cultivar * Colour * Year (p < 0.0003; F-value = 10.28; df = 2) and Colour * Time * Year (p < 0.0131; F-value = 3.67; df = 4) were all significant.

    With respect to growing year differences, in 2018, SS levels in SH were greater than those of SC at all colour levels. In 2019, again at the 3-4 colour level SC, cherries exhibited lower SS levels than SH and SL cherries. At the 4-5 colour level, SH cherries again showed higher SS levels compared to SC cherries. At the 5-6 colour level, SL cherries showed higher SS levels compared to SC and SH, while SC and SH cherries showed comparable SS levels at the 5-6 colour level. The SS values of SC cherries at 3-4 and 4-5 colour levels from the 2021 growing year were higher than values observed at the same colour levels in 2018 and 2019 growing year samples. There was no difference observed in SS levels of SC cherries at the 5-6 colour level between growing years. The data shows that colour level, cultivar, and growing year all affected SS levels.

    Within cultivars, for SH in the 2018 growing season, as colour level increased, SS level increased. An increase in SS as colour at harvest increased for SH cultivar was reported by Puniran et al.[27]. In the 2019 growing year for SH cherries and in the 2021 growing year for SC cherries, SS levels plateaued at the 4-5 colour level. For SC (2018 and 2019 growing year) and SL cherries (2019 growing year) as colour level increased, SS level increased. Ross et al.[1] reported this same trend for SC cultivar on data collected from 2015, 2016, and 2017 growing years. This data demonstrates the influence of growing conditions on SS levels.

    In general the SS levels at each colour level for each sweet cherry cultivar did not change over the 28 d storage at 0.5 °C. It should be noted that SC cherries from the 2018 growing year at the 5-6 colour level and SC cherries from the 2021 growing year at the 4-5 colour level did show a significant (p ≤ 0.05) decrease in soluble solids after 28 d of storage at 0.5 °C. SS values for 2018 SC cherries at the 5-6 colour level harvest was 20.2 °Brix, while SS values after 28 day storage at 0.5 °C was 17.9 °Brix. SS values for 2021 SC cherries at the 4-5 colour level harvest was 19.9 °Brix, while SS values after 28 d of storage at 0.5 °C was 18.6 °Brix. In 2021 the effect of storage temperature (0.5 °C vs 3 °C) was investigated. SS levels in the SC cherries at the different colour levels were not affected by the different storage temperatures. This result was consistent with other findings[1,8,14], which suggested that under typical low temperature storage conditions and proper shipping conditions, the change in flavour profiles were likely not due to major changes in SS levels. It is important to note that Alique et al.[8] found that while SS values were consistent, the levels of glucose and fructose decreased by 13% and 10%, respectively, after 4 d under ambient conditions. It may be worth investigating if under a lower temperature environment, the levels of key monosaccharides would remain constant or change.

    This moves the focus of flavour retention to TA values. Table 2 shows the TA levels at each colour level for each sweet cherry cultivar. Statistical analysis showed that the main effects of Cultivar (p < 0.0001; F-value = 193.58; df = 2), Colour (p = 0.0023; F-value = 5.49, df = 2), Time (p < 0.0001; F-value = 474.18; df = 1), and Year (p < 0.0001; F-value = 1007.20; df = 2) were all significant. The interactions of Cultivar * Colour (p < 0.001; F-value = 5.81; df = 4); Cultivar * Year (p < 0.0001; F-value = 19.9; df = 1); Colour * Time (p = 0.0431; F-value = 3.44; df = 2); Colour * Year (p < 0.0001; F-value = 18.01; df = 4); Time * Year (p < 0.0001; F-value = 17.21; df = 2); Cultivar * Colour * Year (p = 0.0009; F-value = 8.63; df = 2); Colour * Time * Year (p = 0.0127; F-value = 3.70; df = 4) were all significant.

    SH cherries at harvest had TA value ranges of 8.99−10.56 g·L−1 in 2018, and 7.31−7.56 g·L−1 in 2019. In 2018, the highest TA value was at the 5-6 colour level for SH cherries, while for the 2019 SH cherries there was no difference between colour levels for the TA values. After storage SH cherries at the various colour levels showed TA levels of 7.11−8.57 g·L−1 and 6.31−6.50 g·L−1 for 2018 and 2019, respectively. Again the stored 2018 SH cherries at the 5-6 colour level showed the highest TA values, while the TA values for the stored 2019 SH cherries were not affected by colour level. SC cherries at harvest showed TA value ranges of 8.53−8.91 g·L−1 in 2018, 6.96−7.18 g·L−1 in 2019, and 10.6−12.8 g·L−1 in 2021. After storage SC cherries had lower TA values at all colour levels for all growing years. In 2018, 2019, and 2021, TA values for SC cherries after storage ranged from 6.65–7.04 g·L−1, 5.51−6.46 g·L−1 and 8.5−10.5 g·L−1, respectively. In 2021, for the SC cherries, the higher storage temperature (3 °C) resulted in a greater loss of TA values for all colour levels compared to the lower temperature of 0.5 °C. SL cherries at harvest had TA levels of 8.79−9.33 g·L−1 in 2019 and after storage at 0.5 C, TA values ranged from 7.60−7.89 g·L−1, with the highest value of TA at the 4-5 colour level. Therefore for all cultivars over all growing years, TA values decreased upon storage, which was expected. The data from Table 2 shows the magnitude of the decrease in TA values after storage varied by growing year. Additionally, trends for differences of TA magnitude change with respect to cultivar and colour level were not obvious. The magnitude of the decrease in TA values between harvest and storage was higher for the SC cherries stored at 3 °C compared to those stored at 0.5 °C.

    Comparing the effect of colour level on TA level within cultivar for SH cherries, TA values increased as colour level at harvest increased in 2018, but the trend did not continue in 2019, possibly due to different growing conditions such as orchard temperature and relative humidity values, which will be further discussed. For SC cherries, TA values peaked at the 4-5 colour level for 2018 and 2021 growing years, but were not significantly different between colour levels in 2019 (p ≤ 0.05). In the 2019 growing year, SL cherries also had the highest TA values at the 4-5 colour level. Comparing the effect of cultivar on TA level within comparable colour level, 2018 harvest SH cherries showed higher TA values than SC cherries. In the 2018 growing year, upon storage and at comparable colour level, SH cherries again showed higher TA values than SC cherries. In the 2019 harvest, SC cherries exhibited the same TA values as SH cherries, while SL cherries had higher TA values than SC and SH. In the 2019 growing year SL cherries harvested at the 3-4 colour level showed greater TA values after storage compared to SH and SC cherries; SC cherries had the lowest TA values at this colour level. When harvested at the 4-5 and 5-6 colour levels, SL cherries had higher TA values upon storage compared to SH and SC cherries.

    The data suggests that different cultivars tend to peak TA values, which may be affected by growing conditions/growing year and maturity level/colour level. This is further supported by the work of Miloševic & Miloševic[28] that indicated TA levels of sour cherries are affected by level of ripeness. Puniran et al.[27] also indicted that finding where peak TA values occur at harvest can help negate the decrease in values that occurs during storage and therefore promote flavour quality retention.

    In 2021 the effect of storage temperature (0.5 °C vs 3 °C) was investigated as 0.5 °C represents ideal storage temperature while 3 °C represents a storage temperature where quality deterioration would be promoted, and may be a more realistic temperature experienced during overseas/export shipping (personal communication, Dr. Peter Toivonen, May, 2021). TA levels in the SC cherries harvested at the different colour levels were affected by the different storage temperature as seen in Table 2. At common colour level, SC cherries from the 2021 growing season stored at 3 °C showed lower TA values than samples stored at 0.5 °C. The SC cherries at the 5-6 colour level stored at 3 °C showed the lowest TA values upon storage. As higher TA values are associated with flavour quality[11,12], the SC cherries harvested at the 5-6 colour level and stored at 3 °C would show poorer flavour quality.

    Table 3 shows the SS/TA ratio values as affected by cultivar, growing year, storage and colour level at harvest. Statistical analysis showed that the main effects of Cultivar (p = 0.0001; F-value = 94.79; df = 2), Colour (p < 0.0001; F-value = 22.04; df = 2), Time (p < 0.0001; F-value = 134.15; df = 1), and Year (p < 0.0001; F-value = 361.13; df = 2) were all significant. The interactions of Cultivar * Colour (p = 0.0009; F-value = 5.91; df = 4) and Time * Year (p = 0.0059; F-value = 5.95; df = 2) were significant. The SS/TA ratio values over all cultivars, colour levels and growing years ranged from 1.55 to 2.81 at harvest and 1.79 to 3.14 after storage at 0.5 °C for 28 d. SC cherries in the 2021 growing year were tested to determine the effect of storage temperature (0.5 or 3 °C) on flavour quality. The SS/TA ratio for the 2021 SC cherries stored at 0.5 °C for 28 d ranged from 1.79 to 2.06 while the SS/TA ratio for the 2021 SC cherries stored at 3 °C for 28 d ranged from 1.89 to 2.32. SS/TA ratios for the 3 °C stored cherries at the 4-5 and 5-6 colour levels were significantly higher (p ≤ 0.05) compared to corresponding SS/TA ratios for the 0.5 °C stored cherries at the 4-5 and 5-6 colour levels. Higher SS/TA ratio are due to lower TA values (data in Table 3) and impact flavour quality and therefore lower storage temperatures are preferable, which was expected.

    Comparing between growing years, for SH and SC cherries, the SS/TA ratio at harvest was higher in the 2019 growing year compared to the 2018 growing year. SC cherries from the 2021 growing year showed the lowest at harvest SS/TA ratio. Within cultivar, the SH cherries from the 2018 growing year showed no difference in harvest SS/TA ratio at the different colour levels. SH cherries from the 2019 growing year showed higher harvest SS/TA ratios at the 4-5 and 5-6 colour levels compared to the 3-4 colour level. The SC cherries at all growing years showed highest harvest SS/TA ratio levels at the 5-6 colour level and comparable harvest SS/TA ratio levels at the 3-4 and 4-5 colour levels. SL cherries also showed the highest harvest SS/TA ratio at the 5-6 colour level and comparable harvest SS/TA ratios at the 3-4 and 4-5 colour levels.

    Comparing cultivars at common colour level, in 2018 growing year SC cherries at the 5-6 colour level showed a higher harvest SS/TA ratio compared to SH cherries at the corresponding colour level. In the 2019 growing year SH and SC cherries showed higher harvest SS/TA ratios at the 3-4 colour level compared to SL cherries. At the 4-5 colour level, SH cherries showed the highest harvest SS/TA ratio value and SL cherries showed the lowest harvest SS/TA ratio value. At the 5-6 colour level, SH and SC cherries showed comparable SS/TA ratios while SL cherries showed the lowest SS/TA ratio.

    Overall, this data indicates that ensuring cherry flavour quality is complex as SS/TA ratio varied by growing year, colour level and cultivar. Comparing SS/TA ratio data for all cultivars over all growing years did not show an observable trend between colour level and SS/TA ratio. As such, colour is not a reliable indicator of flavor quality.

    Table 4 shows the DM values as affected by cultivar, growing year, storage and colour level at harvest. Statistical analysis showed that the main effects of Cultivar (p = 0.0001; F-value = 11.36; df = 2), Colour (p < 0.0001; F-value = 130.99; df = 2), and Year (p < 0.0001; F-value = 56.64; df = 2) were all significant. Notably, the main effect of Time (harvest vs stored) was not significant (p = 0.0922). The interactions of Cultivar * Year (p = 0.001; F-value = 6.45; df = 3); Colour * Year (p = 0.0004; F-value = 6.38; df = 4); Cultivar * Colour * Year (p = 0.0018; F-value = 4.64; df = 5) were all significant. Although SS and TA values were not obtained for all three cultivars in 2021, DM values at harvest were obtained for all three cultivars in 2021. Data in Table 4 show, in general, DM levels did not change over 28-d storage, which was expected. Additionally, data in Table 4 shows that in most cases, at common cultivar and colour level, DM values measured in 2021 were greater than DM values measured in 2018 and 2019 for all cultivars (SH, SC, and SL).

    Within each cultivar, over all growing years, the harvest DM values were significantly different (p < 0.05) at each colour level, except for SC cherries in the 2018 and 2019 growing years. 2018 and 2019 DM values were not significantly different from colour level 3-4 to colour level 4-5. At the 5-6 colour level, over all growing years, SH cherries showed higher DM values compared to dry matter values observed for SC cherries (p < 0.05). At the 3-4 colour level, over all growing seasons, the DM values for SL and SC cherries were not significantly different (p < 0.05). At the 4-5 colour level, over all growing seasons, the DM values for SL were not significantly different than the DM values exhibited by SH and SC cherries (p < 0.05). In 2021 the effect of storage temperature (0.5 °C vs 3 °C) was investigated. DM levels in the SC cherries at the different colour levels were not affected by the different storage temperature. Overall, DM levels ranged from 18.1 to 25.2 depending on cultivar, colour level, growing year, and storage.

    Figure 1ac shows the distribution of the three cherry cultivars relative to DM value ranges over all three growing years via histograms. Cherries at the same colour level did not all have the same DM; this was observed both within and between cultivars (Fig. 1ac). DM data, compiled over all available growing years, for each cultivar in the 3-4, 4-5, and 5-6 colour levels had considerable overlap. However, it is noted there is consistent shift to a higher DM at the 5-6 colour level.

    Figure 1.  Histogram representing distribution of dry matter data for: (a) Sweetheart (SH) cherries over the 2018, 2019, and 2021 growing years; (b) Staccato (SC) cherries over the 2018, 2019, and 2021 growing years; and (c) Sentennial (SL) cherries over the 2019 and 2021 growing years. For all parts, the 3-4 colour level is solid black, the 4-5 level is black stripes, and the 5-6 level is solid grey. On the horizontal axis different dry matter value (DM) ranges are shown via bins and on the vertical axis the frequency or proportion (%) of cherries within the DM bins/ranges are shown. Data was generated from two replicates of samples of 25 cherries (i.e. 50 cherries) from all available growing years.

    Over all growing years, DM values for SH cherries ranged from 14%−27%, 14%−28.5%, and 16.5%−33%, at the 3-4, 4-5, and 5-6 colour levels, respectively (Fig. 1a). SH cherries at the 3-4 and 4-5 colour levels showed the highest proportion (26% and 26%, respectively) of cherries resided in the 22.5 and 22.5% DM bins indicating the highest percentage of SH cherries in these colour levels exhibited a DM of 21% to 22.5%, while the highest proportion (21%) of cherries at the 5-6 colour level resided in the 24% DM bin indicating the highest percentage of SH cherries at this colour level exhibited a DM of 22.5% to 24% (Fig. 1a).

    For SC cherries over all growing years, DM values ranged from 14%−25.5%, 14%−30%, and 16.5%−30%, at the 3-4, 4-5, and 5-6 colour levels, respectively (Fig. 1b). SC cherries at the 3-4 colour level showed the highest proportion of cherries (27%) resided in the 19.5% DM bin which indicated the highest percentage of SC cherries at this colour level exhibited a DM of 18 to 19.5%. SC cherries at the 4-5 colour level showed the highest proportion of cherries (25%) resided in the in the 21% DM bin which indicated the highest percentage of SC cherries at this colour level exhibited a DM of 19.5% to 21 %. At the 5-6 colour level, the highest proportion (35%) of SC cherries resided in the 22.5% DM bin which indicated the highest percentage of SC cherries exhibited a DM of 21%−22.5% (Fig. 1b).

    Over the 2019 and 2021 growing years, SL cherries DM values ranged from 15%−25.5%, 15%−28.5%, and 16.5%−33% at the 3-4, 4-5 and 5-6 colour levels, respectively (Fig. 1c). SL cherries at the 3-4 colour level showed the highest proportion of cherries (36%) resided in the 21% DM bin which indicated the highest percentage of SL cherries at this colour level exhibited a DM of 19.5% to 21%. SL cherries at the 4-5 colour level showed the highest proportion of cherries (28%) resided in the in the 21% DM bin which indicated the highest percentage of SL cherries at this colour level exhibited a DM of 19.5% to 21 %. At the 5-6 colour level, the highest proportion (26%) of SC cherries resided in the 22.5% DM bin which indicated the highest percentage of SL cherries exhibited a DM of 21%−22.5% (Fig. 1c).

    In all, the data in Tables 14 and Fig. 1 indicate that colour is not a reliable indicator of maturity or flavor quality. Cherries of the same colour may differ in DM, SS, TA, and SS/TA ratio due to cultivar and growing conditions. The implication of these results are discussed in subsequent sections.

    Temperature, relative humidity and harvest date for the 2018, 2019, and 2021 growing years are detailed in Table 5. Environmental variations between years impacted colour development, which resulted in yearly variations in our harvest dates as cherry picks were based on cherry colour levels: 2018, July 16 to August 9; 2019, July 18 to August 6; and 2021, July 5 to July 27, nearly two weeks earlier than in previous years (Table 5). In terms of environmental data, the average temperature (AT), average high temperature (AHT), and average low temperature (ALT) values measured in 2021 were greater than the values determined in 2018 and 2019, while the average relative humidity (ARH) values determined in 2021 were lower than the values measured in 2018 and 2019 (Table 5). Depending on growing year and harvest date, average temperature values ranged from 17.17 to 24.28 °C, average high temperature values ranged from 28.59 to 50.68 °C, average low temperatures ranged from 7.17 to 10.68 °C, and average relative humidity values ranged from 40.68% to 66.16% (Table 5).

    Table 5.  Temperature and relative humidity environmental data for 2018, 2019, and 2021 growing years.
    Growing year Colour level Harvest date Average
    temperature
    (AT) (°C)
    Average relative humidity (ARH) Average low temperature (ALT) (°C) Average high temperature (AHT) (°C)
    2018 Sweetheart 3-4 July 16 18.96 61.5% 7.17 32.14
    4-5 July 23 18.85 59.8% 7.17 32.13
    5-6 July 30 20.45 56.85% 7.49 32.05
    Staccato 3-4 July 30 19.74 59.17% 7.42 32.04
    4-5 August 9 21.14 54.46% 7.42 32.77
    5-6 August 9 21.14 54.49% 7.42 32.77
    2018 overall average 20.05 57.71% 7.35 32.32
    2019 Sweetheart 3-4 July 18 17.86 66.04% 7.22 28.79
    4-5 July 24 18.39 66.1% 7.22 28.59
    5-6 July 24 18.39 66.1% 7.22 28.59
    Staccato 3-4 July 22 18.03 66.16% 7.22 28.59
    4-5 July 29 19.19 62.92% 8.67 29.39
    5-6 July 31 19.19 62.92% 8.67 29.39
    Sentennial 3-4 July 22 18.03 66.16% 7.22 28.59
    4-5 July 29 18.99 63.77% 8.67 29.39
    5-6 August 6 19.79 59.94% 8.67 29.39
    2019 overall average 18.87 63.65% 8.19 28.96
    2021 Sweetheart 3-4 July 5 24.01 40.68% 8.51 50.68
    4-5 July 12 24.28 40.68% 10.68 49.23
    5-6 July 20 24.10 40.68% 9.66 47.47
    Staccato 3-4 July 13 24.01 40.68% 8.51 50.68
    4-5 July 21 24.28 40.68% 10.68 49.23
    5-6 July 27 24.10 40.68% 9.66 47.47
    Sentennial 3-4 July 12 24.01 40.68% 8.51 50.68
    4-5 July 19 24.28 40.68% 10.68 49.23
    5-6 July 26 24.10 40.68% 9.66 47.47
    2021 overall average 24.12 40.68% 9.62 49.13
     | Show Table
    DownLoad: CSV

    Principal component analysis (PCA) was performed on all cultivars over all growing seasons to best resolve cultivar specific relationships between variables affecting flavour quality parameters: colour, DM, SS and TA (Fig. 2).

    Figure 2.  Principal component analysis (PCA) plot for: Sweetheart (SH) cherries with data from 2018 and 2019 growing years at the 3-4, 4-5, and 5-6 colours levels (SH34-2018, SH45-2018, SH56-2018, SH34-2019, SH45-2019, and SH56-2019; Staccato (SC) cherries with data from 2018, 2019 and 2021 growing years at the 3-4, 4-5, and 5-6 colour levels (SC34-2018, SC45-2018, SC56-2018, SC34-2019, SC45-2019, SC56-2019, SC34-2021, SC45-2021, and SC56-2021); and Sentennial (SL) cherries with data from 2019 growing year (SL34-2019, SL45-2019, and SL56-2019). PC1 and PC2 accounted for 84.75% variation. The variables include: average temperature (AT), average high temperature (AHT), average low temperature (ALT), average relative humidity (ARH), colour at harvest (ColourH), SS at harvest (SSH), SS after 28 d of storage at 0.5 °C (SS05), titratable acidity at harvest (TAH), titratable acidity after 28 d of storage at 0.5 °C (TA05) and dry matter of cherry fruit at harvest (DMH). Orchard growing factors, flavour quality attributes (loading factors), along with sweet cherry cultivars from each growing season (component scores) were presented as lines with arrows, lines with circles, and squares, respectively. Variables close to each other with small angles between them are strongly positively correlated; variables at right angles are likely not correlated; variables at large angles (close to 180°) are strongly negatively correlated.

    Figure 2 shows that principal components 1 and 2 described most of the variation (84.75%) in the model. SS at harvest (SSH) and SS at 28-d storage at 0.5 °C (SS05) along with DM at harvest (DMH) were positively correlated with colour at harvest (ColourH). TA at harvest (TAH) and TA at 28-d storage at 0.5 °C (TA05) were positively correlated with average high temperature (ATH). AHT, average low temperature (ALT) and average temperature (AT). DMH was more strongly correlated with TAH and TA05 compared to ColourH. TAH and TA05 were positively correlated, yet negatively correlated with average relative humidity (ARH). The 2021 SC samples at the 3-4, 4-5, and 5-6 colour levels (SC34-2021, SC45-2021, and SC56-2021) were clustered with TAH, TA05, ALT, AHT, and AT variables and located in a quadrant opposite of ARH. In late June 2021 a heatwave of unprecedented magnitude impacted the Pacific Northwest region of Canada and the United States; the Canadian national temperature record was broken with a new record temperature of 49.6 °C[29]. Also, the relative humidity levels during this period were also extremely low[30]. As the location of this study was impacted by this heatwave, the data shown in Table 6 shows higher temperatures and lower relative humidity values for the 2021 growing year. The TA values measured in the 2021 growing year were nearly two times the levels measured in the 2018 and 2019 growing years (Table 2). This shows an impact of growing conditions on flavor quality; both the negative correlation between ARH and TA and positive correlations of AT, AHT, and ALT with TA are notable. However, it is noted that correlation does not mean causation. The SH and SC cultivars from the 2018 growing year at the 5-6 colour level were clustered together, and were located in the same quadrant as ColourH, SSH, SS05, and DMH variables (Fig. 2). This indicates these samples were characterized by high values of SSH, SS05, and DMH. All cultivars at the 3-4 colour level from the 2018 (SH and SC), and 2019 (SH, SC, and SL) growing years along with all cultivars at the 4-5 colour level from the 2019 (SH, SC, and SL) growing year were clustered in quadrants opposite of the SSH, SS05, DMH, ColourH, TAH, and TA05 variables while near the ARH variable. The clustering of the samples indicates similarity and lower levels of SSH, SS05, DMH, TAH, and TA05.

    Table 6.  Average colour level and respiration rate of sweet cherries at harvest.
    Growing year Colour
    level
    Average colour measured at harvest
    [average dry matter at harvest]
    Dry matter bin (%), highest
    proportions of cherries
    Respiration rate (mg CO2 kg−1·h−1)
    assessed at 0.5, 5 or 10 °C
    0.5 °C 5 °C 10 °C
    2018 Sweetheart 3-4 3.74a1 [20.9%] 21, 38% 2.87a1 * 5.99a1* 9.75a1*
    4-5 4.66b1 [21.9%] 22.5, 38% 3.57b1* 5.53b1* 9.06a1*
    5-6 5.54c1 [25.2%] 25.5, 26% 3.50b1* 5.18b1* 9.58a1*
    Staccato 3-4 3.58a1 [20.2%] 19.5, 44% 4.43a2* 7.08a2* 9.90a1*
    4-5 4.62b1 [20.4%] 21, 36% 4.58a2* 8.05b2* 11.22b2*
    5-6 5.64c1 [22.4%] 22.5, 50% 4.12b2* 6.43c2* 9.78a1*
    2019 Sweetheart 3-4 3.76a1 [18.6%] 18, 26%; 19.5, 26% Nd 6.04 13.7
    4-5 4.42b1 [19.9%] 21, 32% Nd Nd 8.3
    5-6 5.42c1 [21.1%] 22.5, 28% Nd 6.95 13.5
    Staccato 3-4 3.46a1 [18.4%] 19.5, 32% Nd 5.8 12.47
    4-5 4.40b12 [19.1%] 19.5, 40% Nd 6.14 Nd
    5-6 5.40c1 [22.9%] 22.5, 26% Nd Nd Nd
    Sentennial 3-4 3.62a1 [18.2%] 18, 28% Nd 6.5 12.80
    4-5 4.22b2 [19.3%] 21, 40% Nd 3.76 Nd
    5-6 5.20c2 [22.9%] 22.5, 24% Nd Nd Nd
    2021 Sweetheart 3-4 Nd [22.1%] 22.5, 40% 3.18a1* 5.86a1* 8.8a1*
    4-5 Nd [22.5%] 22.5, 28% 2.78a1* 5.08b1* 8.1a1*
    5-6 Nd [23.6%] 24, 30% 2.65a1* 4.32c1* 9.19a1*
    Staccato 3-4 3.50a1 [21.0%] 19.5, 28% 2.72a1 4.65ab2 10.94a2*
    4-5 4.80b1 [22.0%] 21, 24%; 22.5, 20% 3.27a1* 4.38a2* 8.22b1*
    5-6 5.60c1 [23.0%] 24, 30% 3.05a1* 5.07b2* 9.57ab1*
    Sentennial 3-4 Nd [20.5%] 21, 48% 2.71a1* 4.77a2* 7.84a1*
    4-5 Nd [22.6%] 22.5, 28%; 24, 24% 2.78a1* 4.81a12* 8.28ab1*
    5-6 Nd [23.5%] 22.5, 28%; 24, 24% 4.23b2 4.47a12 9.88b1*
    Within common cultivar and growing year, values followed by different letters indicate significant differences (p ≤ 0.05)-shows colour differences; Within common colour level and growing year, values followed by different numbers indicate significant differences (p ≤ 0.05)-shows cultivar differences; Within common cultivar, growing year and colour level, values followed by * indicate significant differences (p ≤ 0.05)-shows respiration rate differences at the different temperatures. Due to incomplete data, statistical analysis was not performed on 2019 data. Nd = Actual colour was not calculated for Sweetheart and Sentennial cherries in 2021 although cherries were collected 3-4, 4-5, 5-6 colour levels as in previous years and can be considered to have colour levels of approximately 3.5, 4.5, and 5.5, respectively.
     | Show Table
    DownLoad: CSV

    High respiration rates have long been associated with rapid fruit quality deterioration[11]. Lower respiration rates help to maintain higher TA levels, thereby retaining flavour quality[11,12]. This work aimed to provide information on assessing whether rapid and non-invasive dry matter measurements can serve as a surrogate for respiration rate measurements and/or TA measurements to predict fruit quality as this information is essential for developing recommendations to optimize cherry quality retention upon long distance transport. Although it is well known that quality deteriorates more quickly in fruit with higher respiration rates, the respiration rate data for the SH, SC, and SL cherries was collected and analyzed with respect to the different colour levels and corresponding DM values to investigate a link between respiration rate and DM value. Examining the data with this perspective is very novel and additionally very little information on respiration rates is available for SC and SL sweet cherries cultivars in the literature.

    Table 6 shows the respiration rates for a) SH and b) SC cherries at different colour levels for the 2018 growing year and how they were affected by respiration rate assessment temperature (0.5, 5, and 10 °C). Table 6 also shows the respiration rates for a) SH, b) SC, and c) SL cherries at different colour levels for the 2021 growing year and how they are affected by respiration rate assessment temperature. Please note respiration data is incomplete for the 2019 growing year because of data constraints due to equipment difficulties and therefore no statistical analysis was performed on the available 2019 respiration data. As little information exists in the literature for SC and SL cherries, we have included the incomplete respiration data. Table 6 also shows average color data and average DM data for the cherries collected at the different colour levels. Additionally, Table 6 shows data on the DM (%) bins containing the highest proportion of cherries for each cultivar in each growing year at each colour level (histograms for each cultivar for individual growing year not shown).

    Table 6 shows the average colour measured for the cherries harvested at the 3-4, 4-5, and 5-6 colour levels all varied slightly depending on growing year and cultivar. In both the 2018 and 2019 growing years there was no difference in color levels between SH and SC at harvest. In the 2019 growing year, the SL cherries showed lower average colour values at the 4-5 and 5-6 colour levels compared to the average colour levels of SH and SC cherries at the same level. Nevertheless, results indicated the cherries were harvested and sorted to the desired colour levels. In 2021, average colour was not calculated for SH and SL cherries, although cherries were collected at the 3-4, 4-5, and 5-6 colour levels, as in previous years, and can be considered to have been within range. The average colour level was calculated for SC cherries in 2021, as SC cultivar received comprehensive study over all growing years (2018, 2019 and 2021). The calculated colour level values for SC cherries in the 2021 growing year at the 3-4, 4-5, and 5-6 colour levels were 3.5, 4.8, and 5.6, respectively.

    Table 6 shows the lower the respiration rate assessment temperature, the lower the respiration rate, which was expected as cherries are recommended to be stored at 0.5 °C to ensure quality retention due to this fact[1]. In 2018, SH respiration rate values were consistently lower than SC cherries at 0.5 and 5 °C. However, at 10 °C the respiration rate values become comparable between cultivars (Table 6). Comparing between colour level, SH at colour level 3-4 showed the lowest respiration rate at 0.5 °C but had the highest respiration rate when assessed at 5 °C (Table 6). While SC 5-6 cherries at the 5 °C respiration rate assessment temperature showed a significantly lower respiration rate compared to respiration rates measured for SC 3-4 and SC 4-5 cherries at 5 °C (Table 6).

    In 2021, SH and SC respiration rates were more comparable at 0.5 and 10 °C, but at 5 °C, SH respiration rates were higher than SC at the 3-4 and 4-5 colour levels while SC cherries showed a higher respiration rate when assessed at 5 °C compared to the SH cherries at the 5-6 colour level (Table 6). SH respiration rates in 2021 were consistent at 0.5 and 10 °C for all colour levels (Table 6). However, at 5 °C SH cherries at the 5-6 colour level had the lowest respiration rate for all three of the colour levels and the SH cherries at the 3-4 colour level showed the highest respiration rate. This occurred in both 2018 and 2021 (Table 6). The respiration rates of SC cherries were not affected by colour level when assessed at 0.5 °C, but at the 5 °C respiration rate assessment temperature, 2018 SC cherries at 5-6 colour level had lower respiration values (Table 6), while 2021 SC cherries at the 4-5 colour level showed a lower respiration rate value (Table 6). Comparing colour levels, SL cherries at the 5-6 colour level had the highest respiration rates at 0.5 and 10 °C (Table 6). However, at 5 °C, all SL colour levels had comparable respiration values (Table 6). Further, in 2021, all cultivars at 0.5 °C assessment temperature showed respiration rates that were comparable between all colour levels except for SL 5-6. This respiration rate value was significantly higher than the respiration rates measured for the SL 3-4 and 4-5 colour levels and was also higher than the respiration rates determined for SH and SC at the 5-6 colour level. Interestingly, the respiration rate assessed at 0.5 °C for SL at the 5-6 colour level was not significantly different than the respiration rate assessed at 5 °C for SL at the 5-6 colour level (Table 6).

    To further discuss the results presented above, a main source of decreasing TA values in cherries is high respiratory activity[11]. Therefore, linking flavour quality, which is affected by TA levels, to differences in respiration rates is reasonable. Higher respiration rate assessment temperatures were related to higher respiration rates of cherries as seen in Table 6, which was not unexpected and again points to the importance of keeping temperature near 0.5 °C during storage. Additionally, the temperature cherries experience during a growing season affects the respiration rate of the harvested fruit, as Ross et al.[1] found the average temperature and the average high temperature measured in an orchard was positively correlated with the cherry respiration rate at both 5 and 10 °C. Therefore, understanding factors that impact respiration rate, and ensuring cherries are harvested under conditions that ensure a low respiration rate is of significant importance. Table 6 (2021 data) suggests the colour level with the lowest respiration rates for SC cherries is 4-5, which is supported by previous work[1]. While Table 6 (2018 data) suggests the 5-6 colour level gives the lowest respiration rates for SC cherries. When this information is combined with the TA value data, the peak TA values for SC cherries occurs at the 4-5 level and 5-6 colour levels. SH cherries showed that for respiration rate assessed at 0.5 °C, the colour level with the consistently lowest respiration rate was 3-4, but at the 5 °C respiration rate assessment temperature, which is a more abusive temperature, the 5-6 colour level showed the lowest respiration rate in both 2018 and 2021. The highest TA values were seen at the 5-6 colour level for SH cherries. SL cherries show highest TA values at the 3-4 and 4-5 colour level in the 2019 growing year, but insufficient respiration rate data is available in 2019 to comment further. However, the data in Tables 14 indicate that colour is not a reliable indicator of maturity and/or flavor quality. Cherries of the same colour may differ in DM, SS and TA due to cultivar and growing conditions. Figure 1 shows that not all cherries at the same colour level are at the same DM both within and between cultivars. There is a range of DM values for each cultivar in the 3-4, 4-5, and 5-6 colour ranges. However, it is noted the distribution of DM shifted to the right (higher levels) in the 5-6 colour cherries. The work of Palmer et al.[25] and Toivonen et al.[6] have indicated the importance of DM as a fruit quality metric. The implications of colour, DM, and respiration rate results on flavour quality and DM standards are discussed below.

    Associations between colour and DM at harvest with sweet cherry flavour quality attributes and respiration rates were statistically examined using Pearson's correlation coefficient from all available data over all growing years to investigate whether there may be colour/DM levels that are associated with lower respiration rates (Table 7) and could be indicative of when harvest should be performed (i.e. maturity). It was found that colour at harvest was positively correlated with SS at harvest and SS after storage (r = 0.845, p ≤ 0.0005, and r = 0.684, p ≤ 0.005, respectively). Colour at harvest was also positively correlated with DM at harvest (r = 0.768, p ≤ 0.0005). This was expected as darker cherries of a certain cultivar are generally more developed or mature; sugar content (main contributor to DM) and TA increases upon fruit development[1,6,22]. Neither colour or DM at harvest were correlated with SS/TA ratio at harvest or after storage (Table 7). Over all cultivars, no correlation was seen between respiration rate at any assessment temperature and colour level (Table 7). No significant correlations were found between respiration rate assessed at 0.5 and 10 °C and DM (Table 7). A significant negative correlation (r = −0.514, p ≤ 0.025) was found between respiration rate at 5 °C and DM. It was speculated that a correlation between respiration rate and DM was not observed when assessed at 0.5 °C, as this temperature is very low and effectively slows metabolic activity regardless of physiological status of the cherry. No observed correlation between respiration rate assessed at 10 °C and DM was speculated to be due to 10 °C being such an abusive temperature that even physiologically healthy cherries show elevated respiration rates when stored at 10 °C, and likely experienced increased flavour quality deterioration, which could be tested by measuring SS and TA values. Over all cultivars at 5 °C, cherries with lower DM tended to have higher respiration rates, and may be susceptible to more rapid quality deterioration at non-ideal temperatures such as 3−5 °C, which can be encountered in the cherry industry, particularly during export shipping (personal communication, Dr. Peter Toivonen, May, 2021). This points to the importance of good temperature control during storage and diverting lower DM cherries to the domestic and/or rapid consumption market vs export market. Colour was not correlated with TA, while DM at harvest was positively correlated with TA at harvest and upon storage (Table 7), which is relevant for flavour quality. These results indicate that DM has a greater influence on flavour quality attributes than cherry colour.

    Table 7.  Correlations between colour and dry matter at harvest with sweet cherry flavour quality attributes and respiration rate.
    Relationship assessed for Sweetheart*,
    Staccato, and Sentennial**
    cultivars over 2018, 2019,
    and 2021 growing seasons
    Pearson's
    correlation
    coefficient
    Significance
    level
    (p value)
    Colour correlated with
    Soluble solids at harvest r = +0.845 p ≤ 0.0005
    Soluble solids at 28-d storage r = +0.684 p ≤ 0.005
    Dry matter at harvest r = +0.768 p ≤ 0.0005
    Dry matter correlated with
    Soluble solids at harvest r = +0.871 p ≤ 0.0005
    Soluble solids at 28-d storage r = +0.776 p ≤ 0.0005
    Colour at harvest r = +0.769 p ≤ 0.0005
    Titratable acidity at harvest r = +0.439 p ≤ 0.05
    Titratable acidity at 28 d storage r = +0.398 p ≤ 0.10
    Respiration rate at 5 °C r = −0.514 p ≤ 0.025
    Insignificant correlations
    Colour and titratable acidity at harvest r = +0.099 p = 0.696
    Colour and titratable acidity at 28 d storage r = +0.100 p = 0.692
    Colour and soluble solids to titratable
    acidity ratio at harvest
    r = +0.218 p = 0.383
    Colour and soluble solids to titratable
    acidity ratio at 28 d storage
    r = +0.073 p = 0.774
    Colour and respiration rate at 0.5 °C r = +0.252 p = 0.364
    Colour and respiration rate at 5 °C r = −0.206 p = 0.462
    Colour and respiration rate at 10 °C r = +0.084 p = 0.766
    Dry matter and soluble solids to titratable
    acidity ratio at harvest
    r = −0.135 p = 0.595
    Dry matter and soluble solids to titratable
    acidity ratio at 28 d storage
    r = −0.227 p = 0.365
    Dry matter and respiration rate at 0.5 °C r =−0.125 p = 0.657
    Dry matter and respiration rate at 10 °C r = −0.181 p = 0.519
    *Only 2018 and 2019 growing season data available; **only 2019 growing season data available.
     | Show Table
    DownLoad: CSV

    Further, specific cultivar respiration rate and DM relationships were also examined (data not shown). For SH cherries, a negative correlation was determined between respiration rate assessed at 5 °C and DM (p ≤ 0.1), yet this correlation was not seen for SL cherries. Based on statistical parameters SC cherries only showed a negative correlation between respiration rate assessed at 5 °C and DM if a higher p value > 0.1 was used which signifies evidence is not strong enough to suggest a relationship exists. Nevertheless, the statistically significant negative correlation between respiration rate assessed at 5 °C and DM over all cultivars was identified (Table 7).

    Although colour was positively correlated with DM (Table 7), a higher colour may not necessarily indicate a low respiration rate as no significant correlation was observed between colour and respiration rate at any assessment temperature when examined over all cultivars over the growing years tested. Although this highlights the importance of DM in overall quality rather than colour, the data presented thus far suggests certain cultivars achieve different optimal DM values or ranges at maturity that are related to quality retention. In general, higher DM is positive, but is there an upper limit/threshold in terms of higher respiration rate. The lack of correlation between respiration rate assessed at 5 °C and DM for SC and SL cherries seems to indicate a lower optimal DM level for these cultivars compared to SH cherries, as a negative correlation between respiration rate assessed at 5 °C and DM was observed for SH cherries. Again, non-ideal temperatures such as 3−5 °C, can be encountered in the cherry industry, particularly during export shipping, which makes these results extremely relevant to help ensure cherry growers deliver high quality fruit for the export market.

    In 2018, the respiration rate at 5 °C was lowest at the 4-5 and 5-6 colour levels for SH cherries, and the average DM values were ~22% and 25%, respectively. Information from Table 6 shows that 38% of SH fruit were in the 22.5% DM bin indicating the highest percentage of SH cherries at the 4-5 colour level had a DM of 21% to 22.5% while 26% of SH cherries at the 5-6 colour level resided in the 25.5% DM bin indicating the highest percentage of cherries at this colour level had a DM of 24% to 25.5%. For SH cherries in 2021, the lowest respiration rate at 5 °C was at the 5-6 colour level and average DM value was ~23.6%. Information from Table 6 shows that 30% of SH at the 5-6 colour level resided in 24% DM bin indicating the highest percentage of SH cherries at this colour level had a dry mater of 22.5% to 24%. For 2018 SH cherries, titratable acidity, which is important for flavour quality, was highest at the 5-6 colour level where respiration rate assessed at 5 °C was lower. These results imply, that at maturity, cherries tend to a certain DM value or range that corresponds to reduced respiratory activity and promotes quality retention, and would therefore be considered optimal. Based on this data (lower respiration rate (2018 and 2021) and peak TA (2018)), an optimal DM range for SH may be between 22.5%−25% DM or around 23% DM. This optimal DM corresponded to cherries in the 4-5 colour level (21.9%) in 2018, and in the 5-6 colour level (25.2%, 23.6% respectively) in 2018 and 2021.

    2018 respiration rate (assessed at 5 °C) was lowest at the 5-6 colour level for SC cherries and the average DM value was ~22%, respectively. Information from Table 6 shows that 50% of SC cherries resided in the 22.5% DM bin indicating the highest percentage of SC cherries at the 5-6 colour level had a DM of 21% to 22.5% The 2021 respiration rate (assessed at 5 °C) was lowest for SC cherries at the 4-5 colour level and average DM value was ~22% while the highest respiration rate was measured at the 5-6 colour level and the average DM value was ~23.0%. Information from Table 6 shows that 24% and 20% of SC cherries resided in each the 21% and 22.5% DM bins, respectively, indicating the highest percentage of SC cherries at the 4-5 colour level had a DM of 19.5% to 22.5%. For 2021 SC cherries, TA was higher at the 4-5 colour levels, where respiration rate assessed at 5 °C was lowest. Again, these results imply that at maturity cherries tends to a certain DM value or range (optimal) that corresponds to reduced respiratory activity and promotes quality retention. Based on this data (lower respiration rate (2018 and 2021) and peak TA (2018 and 2021)) an optimal DM range for SC may be between 19.5%−22.5% DM or around 22% DM. This optimal DM corresponded to cherries in the 4-5 colour level (22.0%) in 2021, and in the 5-6 colour level (22.4%) in 2018. The data also shows the optimal DM range for SH cherries is higher than the optimal DM range for SC cherries.

    In 2021, for the SL cherries, all colour levels showed the same respiration rate (assessed at 5 °C) and average DM values were 20.5%, 22.6% and 23.5% for the 3-4, 4-5 and 5-6 colour levels, respectively. Information from Table 6 shows that SL cherries at both the 4-5 and 5-6 colour levels, 28% and 24% of the cherries resided in the 22.5% and 24% DM bins indicting the highest percentage of cherries at these colour stages ranged from 21% to 24% DM. For SL, based on the one year of respiration data (2021), determining optimum DM was not as clear. At lower storage temperature (0.5 °C), lower average DM (20.5%−22.6% vs 23.5%) maintained lower respiration rates, but at higher storage temperature (5 and 10 °C) respiration rate did not appear to be affected by DM level. These lower DM values occurred at the 3-4 and 4-5 colour levels.

    Available DM, TA and respiration rate data as discussed suggests the optimal DM range for SH may be between 22.5%−25% DM or around 23% and an optimal dry matter range for SC may be between 19.5%−22.5% DM or around 22% DM, The histogram data over all growing years does further strengthen the justification for suggesting different optimal DM values for different cultivars (Fig. 1). The data over all growing years shows higher proportions of cherries in the 24 % DM bin for SH cherries at the 5-6 colour level which indicated highest proportion of cherries with a DM of 22.5% to 24%. The SC cherries at the 5-6 colour level showed the highest proportion of cherries in the 22.5% DM bin, which indicates the highest percentage of cherries have a DM of 21% to 22.5%; again these DM ranges have been suggested as optimal DM values based on previously discussed respiration data.

    In psychology self-actualization is a concept regarding the process by which an individual reaches their full potential[31]. The data suggests that sweet cherries self-actualize, with the majority of cherries reaching maturity with a DM range that promotes quality retention during storage when growing conditions are favourable. This optimal DM range is different for different cultivars, and growing conditions would be expected to influence the rate and/or ability of this 'self-actualization', as this work and our previous research has shown that environmental factors are correlated with these important quality characteristics[1]. Placing highest importance on distribution of DM levels at the 5-6 colour levels (Fig. 1) is justified as the cherries are the most physiologically mature and will likely exhibit the highest proportion of cherries with optimal DM; however, the optimal DM can occur at other colour ranges and should be used as the primary indicator of maturity. Maturity at harvest is the most important factor that determines storage-life and final fruit quality assweet cherries produce very small quantities of ethylene and do not respond to ethylene treatment; they need to be picked when fully ripe to ensure good flavour quality[32]. It is noted the CTFIL colour standard series goes up to colour level 7, yet a balance needs to be reached between flavour quality optimization vs other quality parameters such as firmness and stem pull force. Supplementary Tables S1S6 provide values of the quality parameters of firmness, stem pull force, stem shrivel, stem browning, pebbling and pitting levels at harvest and after storage for the SH, SC and SL cherries. All of these cherry cultivars exhibited good quality attributes at the 5-6 colour level, as well as lighter colour ranges.

    It is noted that the development of DM standards for different cultivars is a novel concept. This work was positioned as field work that collected cherry data for three cultivars over three growing years in adjacent orchards using the same management practices. Equipment constraints limited respiration rate data collection. As such absolute optimal DM values and/or ranges could not be determined nor was the goal of this study. The goal of this work was to further the concept that different cultivars may reach maturity at different DM levels, which would result in lower respiration rates and higher TA levels at harvest, and after storage, achieving enhanced quality retention. In this regard, absolute optimal DM would be the DM achievable by a cherry cultivar that maximizes flavour attributes and minimizes respiration under ideal conditions. In reality, the absolute optimal DM may or may not be reached during a growing season depending on environmental conditions and orchard management practices; however, cherry cultivars will reach a DM that will be optimal for the growing conditions at harvest maturity, as the present research demonstrates. Developing definitive DM standards to determine optimal harvest points for different cultivars under different environmental conditions should be a direction of research to be further pursued to ensure cherry quality, particularly for cherries subjected to longer term storage and/or cherries destined for the overseas export market.

    The present work is not the first to point to the importance of DM and cherry flavour retention, as an anecdotal report[33] indicated that SH cherries should be harvested at a DM of no higher than 20% or the fruit will lose both sugar and acidity more rapidly during shipping storage. Although this DM value is lower than the DM recommended for SH in the current work, it indicates the importance of DM level and flavour quality in relation to a specific cultivar. The differences between optimal DM for flavour retention in our work and the anecdotal report signifies the complexity of determining DM standards and the impact of growing year/environmental conditions and orchard management practices on optimal DM. Growers will continue to face these complex issues but the present work provides valuable information to growers regarding DM standards for three cultivars.

    It must be noted again that development of absolute DM standards for different cherry cultivars requires more study under rigorous controlled environmental conditions. Additionally, given the impact of environmental conditions on optimal DM, cultivars of interest must be studied over many growing years and orchard conditions to collect a robust data set. Nevertheless, the present research indicates that SH, SC, and SL cultivars have different dry matter values at maturity. The data also shows the DM range for SH cherries at maturity is higher than the DM range for SC cherries at maturity and that for SL, lower DM levels maintained lower respiration rates at lower temperatures, potentially improving ability to maintain quality after harvest.

    Overall, this research showed that DM was a better indicator of flavour quality than colour, as DM was related to both sugars and TA, while colour was only related to sugar. Therefore, this work identified that colour may not be a reliable indicator of maturity and/or flavor quality. This work indicated that cherries of the same colour may differ in DM, SS, and TA due to cultivar type and growing conditions as influenced by growing year. Relative humidity encountered by cherries during the growing season was negatively correlated with TA and higher growing temperatures were positively correlated with TA. This work discovered that sweet cherries may self-actualize, in that when growing conditions are favourable, DM levels may tend towards a certain level at maturity (optimal DM) resulting in superior flavour quality attributes and lower respiration, allowing cherries to reach their full quality potential and ensure quality retention in storage. Therefore, optimal DM can be reached at maturity despite colour. Remaining challenges include development of DM standards for various sweet cherry cultivars and further understanding the impact of growing conditions to better allow for self-actualization and prediction of the optimal DM under those conditions to optimize timing of harvest from year-to-year. Nevertheless, this research based on field work for three sweet cherry cultivars over three growing years, indicated an optimal DM range for SH between 22.5%−25% DM and an optimal DM range for SC between 19.5%−22.5% DM. Interestingly, under the same field conditions, the optimal DM range for SH cherries was higher than the optimal DM range for SC cherries. More analysis is required for determining optimal DM for SL, but the initial data indicates DM in the range of 20.5% to 22.6% maintained lower respiration rates at lower temperature potentially improving ability to maintain quality after harvest.

    The authors confirm contribution to the paper as follows: study conception and design: Ross KA, DeLury NC, Fukumoto L; data collection: Ross KA, DeLury NC, Fukumoto L; analysis and interpretation of results: Ross KA, DeLury NC, Fukumoto L; draft manuscript preparation: Ross KA, DeLury N, Fukumoto L, Forsyth JA. All authors reviewed the results and approved the final version of the manuscript.

    The datasets generated during and/or analysed during the current study are available from the corresponding author on reasonable request.

    We are grateful to the BC Cherry Association for financial support of this research project. We acknowledge Manon Gentes, Gillian Beaudry, and Duncan Robinson for their technical assistance. We are grateful to Brenda Lannard for providing her expertise on using the Felix F750 handheld spectrometer (Felix Instruments, Inc.) to obtain dry matter values and obtaining respiration data. Kelly A. Ross would like to thank and acknowledge Dr. Peter Toivonen for his mentorship, valuable scientific discussions and consistently kind support.

  • The authors declare that they have no conflict of interest.

  • Supplementary Table S1 Types of culture media used in the study.
    Supplementary Table S2 Primers used for GUS gene analyses.
    Supplementary Table S3 Primers used for LkPDS gene analysis.
    Supplementary Table S4 Sequences required for gRNA synthesis.
    Supplementary Table S5 Details of primer design and gRNA synthesis for the study.
    Supplementary Table S6 Instructions for preparing target DNA and Cas9 recombinant protein.
    Supplementary Table S7 Primer sequences for amplifying genomic fragments covering the target sites.
    Supplementary Fig. S1 Schematic representation of T-DNA region in pBI121-GUS plasmid. RB, right border; LB, left border; Hyg, hygromycin resistance; CaMV 35S promoter, cauliflower mosaic virus 35S promoter; GUS, coding region of the GUS gene. Hind III = unique Hind III restriction site within T-DNA; Sac I = two Sac I restriction site within T-DNA; EcoR = unique EcoR I restriction site within T-DNA; BamH = unique BamH I restriction site within T-DNA.
    Supplementary Fig. S2 The predicted structure of LkPDS genes in the genome region. And the distribution position of the five targets in exon 1. The gray boxes indicate exons; the black lines represent introns.
    Supplementary Fig. S3 Schematic illustration of the fiull-length plasmid pAbAi. MCS, multiple cloning site; AuR, aureobasidin A-resistant; AmpR, ampicillin resistance; Sac I = unique Sac I restriction site within the plasmid; Sal I = unique Sal I restriction site within the plasmid; BstB I = unique BstB I restriction site within the plasmid.
    Supplementary Fig. S4 Representation of the full-length plasmid PMJ915. Streptococcus pyogenes Cas9 with two C-terminal SV40 NLS for nuclear localization; MBP, maltose binding protein labels; AmpR, ampicillin resistance; Multiple cloning sites for efficient gene insertion.
  • [1]

    Voytas DF, Gao C. 2014. Precision genome engineering and agriculture: opportunities and regulatory challenges. PLoS Biology 12:e1001877

    doi: 10.1371/journal.pbio.1001877

    CrossRef   Google Scholar

    [2]

    Bortesi L, Fischer R. 2015. The CRISPR/Cas9 system for plant genome editing and beyond. Biotechnology Advances 33:41−52

    doi: 10.1016/j.biotechadv.2014.12.006

    CrossRef   Google Scholar

    [3]

    Zhang Y, Liang Z, Zong Y, Wang Y, Liu J, et al. 2016. Efficient and transgene-free genome editing in wheat through transient expression of CRISPR/Cas9 DNA or RNA. Nature Communications 7:12617

    doi: 10.1038/ncomms12617

    CrossRef   Google Scholar

    [4]

    Kim S, Kim D, Cho SW, Kim J, Kim JS. 2014. Highly efficient RNA-guided genome editing in human cells via delivery of purified Cas9 ribonucleoproteins. Genome Research 24:1012−19

    doi: 10.1101/gr.171322.113

    CrossRef   Google Scholar

    [5]

    Jones HD. 2015. Regulatory uncertainty over genome editing. Nature Plants 1:14011

    doi: 10.1038/nplants.2014.11

    CrossRef   Google Scholar

    [6]

    Woo JW, Kim J, Kwon SI, Corvalán C, Cho SW, et al. 2015. DNA-free genome editing in plants with preassembled CRISPR-Cas9 ribonucleoproteins. Nature Biotechnology 33:1162−64

    doi: 10.1038/nbt.3389

    CrossRef   Google Scholar

    [7]

    Kanchiswamy CN, Malnoy M, Velasco R, Kim JS, Viola R. 2015. Non-GMO genetically edited crop plants. Trends in Biotechnology 33:489−91

    doi: 10.1016/j.tibtech.2015.04.002

    CrossRef   Google Scholar

    [8]

    Sun C, Xie Y, Li Z, Liu Y, Sun X, et al. 2022. The Larix kaempferi genome reveals new insights into wood properties. Journal of Integrative Plant Biology 64:1364−73

    doi: 10.1111/jipb.13265

    CrossRef   Google Scholar

    [9]

    Pak S, Li C. 2022. Progress and challenges in applying CRISPR/Cas techniques to the genome editing of trees. Forestry Research 2:6

    doi: 10.48130/FR-2022-0006

    CrossRef   Google Scholar

    [10]

    Li B, Sun C, Li J, Gao C. 2024. Targeted genome-modification tools and their advanced applications in crop breeding. Nature Reviews Genetics 25:603−22

    doi: 10.1038/s41576-024-00720-2

    CrossRef   Google Scholar

    [11]

    Hooghvorst I, López-Cristoffanini C, Nogués S. 2019. Efficient knockout of phytoene desaturase gene using CRISPR/Cas9 in melon. Scientific Reports 9:17077

    doi: 10.1038/s41598-019-53710-4

    CrossRef   Google Scholar

    [12]

    Ma M, Wang X, Zhang C, Pak S, Wu H, et al. 2023. Enhancing the cryopreservation system of larch embryogenic culture by optimizing pre-culture, osmoprotectants, and rapid thawing. Forests 14:1621

    doi: 10.3390/f14081621

    CrossRef   Google Scholar

    [13]

    Wang W, Li C, Yang J, Zhang H, Zhang S. 2009. Somatic embryogenesis and plantlet regeneration from immature zygotic embryos of hybrid larch. Scientia Silvae Sinicae 12:34−38

    doi: 10.3321/j.issn:1001-7488.2009.08.006

    CrossRef   Google Scholar

    [14]

    Gupta PK, Durzan DJ. 1986. Plantlet regeneration via somatic embryogenesis from subcultured callus of mature embryos of Picea abies(Norway spruce). In Vitro Cellular & Developmental Biology 22:685−88

    doi: 10.1007/BF02623484

    CrossRef   Google Scholar

    [15]

    Murashige T, Skoog F. 1962. A revised medium for rapid growth and bio assays with tobacco tissue cultures. Physiologia Plantarum 15:473−97

    doi: 10.1111/j.1399-3054.1962.tb08052.x

    CrossRef   Google Scholar

    [16]

    Wang Y, Zeng J, Su P, Zhao H, Li L, et al. 2022. An established protocol for generating transgenic wheat for wheat functional genomics via particle bombardment. Frontiers in Plant Science 13:979540

    doi: 10.3389/fpls.2022.979540

    CrossRef   Google Scholar

    [17]

    Li M, Wang D, Long X, Hao Z, Lu Y, et al. 2022. Agrobacterium-mediated genetic transformation of embryogenic callus in a Liriodendron hybrid (L. Chinense × L. Tulipifera). Frontiers in Plant Science 13:802128

    doi: 10.3389/fpls.2022.802128

    CrossRef   Google Scholar

    [18]

    Allen GC, Flores-Vergara MA, Krasynanski S, Kumar S, Thompson WF. 2006. A modified protocol for rapid DNA isolation from plant tissues using cetyltrimethylammonium bromide. Nature Protocols 1:2320−25

    doi: 10.1038/nprot.2006.384

    CrossRef   Google Scholar

    [19]

    Li D, Yu S, Zeng M, Liu X, Yang J, et al. 2020. Selection and validation of appropriate reference genes for realtime quantitative PCR analysis in needles of Larix olgensis under abiotic stresses. Forests 11:193

    doi: 10.3390/f11020193

    CrossRef   Google Scholar

    [20]

    Liu H, Ding Y, Zhou Y, Jin W, Xie K, et al. 2017. CRISPR-P 2.0: an improved CRISPR-Cas9 tool for genome editing in plants. Molecular Plant 10:530−32

    doi: 10.1016/j.molp.2017.01.003

    CrossRef   Google Scholar

    [21]

    Gruber AR, Lorenz R, Bernhart SH, Neuböck R, Hofacker IL. 2008. The Vienna RNA Websuite. Nucleic Acids Research 36:W70−W74

    doi: 10.1093/nar/gkn188

    CrossRef   Google Scholar

    [22]

    Housden BE, Valvezan AJ, Kelley C, Sopko R, Hu Y, et al. 2015. Identification of potential drug targets for tuberous sclerosis complex by synthetic screens combining CRISPR-based knockouts with RNAi. Science Signaling 8:rs9

    doi: 10.1126/scisignal.aab3729

    CrossRef   Google Scholar

    [23]

    Doudna JA, Charpentier E. 2014. The new frontier of genome engineering with CRISPR-Cas9. Science 346:1258096

    doi: 10.1126/science.1258096

    CrossRef   Google Scholar

    [24]

    Liang Z, Chen K, Zhang Y, Liu J, Yin K, et al. 2018. Genome editing of bread wheat using biolistic delivery of CRISPR/Cas9 in vitro transcripts or ribonucleoproteins. Nature Protocols 13:413−30

    doi: 10.1038/nprot.2017.145

    CrossRef   Google Scholar

    [25]

    Subburaj S, Chung SJ, Lee C, Ryu SM, Kim DH, et al. 2016. Site-directed mutagenesis in Petunia × hybrida protoplast system using direct delivery of purified recombinant Cas9 ribonucleoproteins. Plant Cell Reports 35:1535−44

    doi: 10.1007/s00299-016-1937-7

    CrossRef   Google Scholar

    [26]

    Zhao H, Zhang J, Zhao J, Niu S. 2024. Genetic transformation in conifers: current status and future prospects. Forestry Research 4:e010

    doi: 10.48130/forres-0024-0007

    CrossRef   Google Scholar

    [27]

    Mahmoud LM, Kaur P, Stanton D, Grosser JW, Dutt M. 2022. A cationic lipid mediated CRISPR/Cas9 technique for the production of stable genome edited citrus plants. Plant Methods 18:33

    doi: 10.1186/s13007-022-00870-6

    CrossRef   Google Scholar

    [28]

    Yao T, Yuan G, Lu H, Liu Y, Zhang J, et al. 2023. CRISPR/Cas9-based gene activation and base editing in Populus. Horticulture Research 10:uhad085

    doi: 10.1093/hr/uhad085

    CrossRef   Google Scholar

    [29]

    Fan Y, Xin S, Dai X, Yang X, Huang H, et al. 2020. Efficient genome editing of rubber tree (Hevea brasiliensis) protoplasts using CRISPR/Cas9 ribonucleoproteins. Industrial Crops and Products 146:112146

    doi: 10.1016/j.indcrop.2020.112146

    CrossRef   Google Scholar

    [30]

    Pavese V, Moglia A, Abbà S, Milani AM, Torello Marinoni D, et al. 2022. First report on genome editing via ribonucleoprotein (RNP) in Castanea sativa Mill. International Journal of Molecular Sciences 23:5762

    doi: 10.3390/ijms23105762

    CrossRef   Google Scholar

    [31]

    Poovaiah C, Phillips L, Geddes B, Reeves C, Sorieul M, et al. 2021. Genome editing with CRISPR/Cas9 in Pinus radiata (D. Don). BMC Plant Biolog 21:363

    doi: 10.1186/s12870-021-03143-x

    CrossRef   Google Scholar

    [32]

    Cui Y, Zhao J, Gao Y, Zhao R, Zhang J, et al. 2021. Efficient multi-sites genome editing and plant regeneration via somatic embryogenesis in Picea glauca. Frontiers in Plant Science 12:751891

    doi: 10.3389/fpls.2021.751891

    CrossRef   Google Scholar

    [33]

    Liu Y, Wang Y, Xu S, Tang X, Zhao J, et al. 2019. Efficient genetic transformation and CRISPR/Cas9-mediated genome editing in Lemna aequinoctialis. Plant Biotechnology Journal 17:2143−52

    doi: 10.1111/pbi.13128

    CrossRef   Google Scholar

    [34]

    An Y, Geng Y, Yao J, Fu C, Lu M, et al. 2020. Efficient genome editing in Populus using CRISPR/Cas12a. Frontiers in Plant Science 11:593938

    doi: 10.3389/fpls.2020.593938

    CrossRef   Google Scholar

    [35]

    Tsai SQ, Zheng Z, Nguyen NT, Liebers M, Topkar VV, et al. 2015. GUIDE-seq enables genome-wide profiling of off-target cleavage by CRISPR-Cas nucleases. Nature Biotechnology 33:187−97

    doi: 10.1038/nbt.3117

    CrossRef   Google Scholar

    [36]

    Pallarès Masmitjà M, Knödlseder N, Güell M. 2019. CRISPR-gRNA design. In CRISPR Gene Editing, ed. Luo Y. New York, NY: Humana Press. 1961:3–11. doi: 10.1007/978-1-4939-9170-9_1

    [37]

    Park SC, Park S, Jeong YJ, Lee SB, Pyun JW, et al. 2019. DNA-free mutagenesis of GIGANTEA in Brassica oleracea var. capitata using CRISPR/Cas9 ribonucleoprotein complexes. Plant Biotechnology Reports 13:483−89

    doi: 10.1007/s11816-019-00585-6

    CrossRef   Google Scholar

    [38]

    Nanasato Y, Mikami M, Futamura N, Endo M, Nishiguchi M, et al. 2021. CRISPR/Cas9-mediated targeted mutagenesis in Japanese cedar (Cryptomeria japonica D. Don). Scientific Reports 11:16186

    doi: 10.1038/s41598-021-95547-w

    CrossRef   Google Scholar

    [39]

    Klimek-Chodacka M, Oleszkiewicz T, Lowder LG, Qi Y, Baranski R. 2018. Efficient CRISPR/Cas9-based genome editing in carrot cells. Plant Cell Reports 37:575−86

    doi: 10.1007/s00299-018-2252-2

    CrossRef   Google Scholar

    [40]

    Mercx S, Tollet J, Magy B, Navarre C, Boutry M. 2016. Gene inactivation by CRISPR-Cas9 in Nicotiana tabacum BY-2 suspension cells. Frontiers in Plant Science 7:40

    doi: 10.3389/fpls.2016.00040

    CrossRef   Google Scholar

    [41]

    Xiang G, Zhang X, An C, Cheng C, Wang H. 2017. Temperature effect on CRISPR-Cas9 mediated genome editing. Journal of Genetics and Genomics 44:199−205

    doi: 10.1016/j.jgg.2017.03.004

    CrossRef   Google Scholar

  • Cite this article

    Ma M, Zhang C, Yu L, Yang J, Li C. 2024. CRISPR/Cas9 ribonucleoprotein mediated DNA-free genome editing in larch. Forestry Research 4: e036 doi: 10.48130/forres-0024-0033
    Ma M, Zhang C, Yu L, Yang J, Li C. 2024. CRISPR/Cas9 ribonucleoprotein mediated DNA-free genome editing in larch. Forestry Research 4: e036 doi: 10.48130/forres-0024-0033

Figures(6)  /  Tables(2)

Article Metrics

Article views(2590) PDF downloads(445)

ARTICLE   Open Access    

CRISPR/Cas9 ribonucleoprotein mediated DNA-free genome editing in larch

Forestry Research  4 Article number: e036  (2024)  |  Cite this article

Abstract: Here, a DNA-free genetic editing approach is presented for larch by delivering ribonucleoprotein complexes (RNPs) of CRISPR/Cas9 through particle bombardment. The detailed procedure encompasses creating a transgenic system via particle bombardment for the transformation of embryogenic callus, validating the functionality of RNPs, optimizing coating and delivery techniques, enhancing somatic embryo maturation, regenerating plantlets, and precisely identifying mutants. The optimal particle bombardment parameters were determined at 1,100 psi and a distance of 9 cm and the editing efficiency of the targets was verified in vitro. Subsequently, the RNPs were transferred into the embryogenic callus. Mutant plants were obtained in targets 1 and target 2. The efficiencies of obtaining albino somatic embryos were 1.423% and 2.136%, respectively. A DNA-free particle bombardment transformation method suitable for larch has been established. The present study demonstrates that the DNA-free editing technology has been successfully implemented in larch. This method can achieve targeted genome editing in the larch genome, avoiding the risks of genomic integration and the lengthy breeding cycles associated with traditional transgenic methods. Moreover, it may be widely applicable for producing genome-edited conifer plants and holds great promise for commercialization.

    • In recent years, the CRISPR/Cas9 system has been widely employed in plants for introducing genome modifications and is paving the way for the precise improvement of crop traits[1]. Typically, CRISPR/Cas9 DNA constructs are delivered into plant cells through Agrobacterium tumefaciens-mediated T-DNA transfer or biolistic bombardment. Once inside, they are expressed, cleave target sites, and produce mutations[2]. During this process, there is a high likelihood that the CRISPR/Cas9 constructs are integrated into the plant genome[3]. This increases the risk of unwanted genetic changes, with transgene integration and off-target mutation being the most significant concerns. Moreover, once within the recipient cells, the CRISPR/Cas9 sequence may be degraded, and the resulting fragments can act as filler DNA in the double-stranded break repair process and be inserted into intended and/or unintended genomic sites[4]. This can contaminate the genome and introduce foreign DNA. As a result, currently, the biosecurity of genome-edited plants are a major public concern[5]. In response to this concern, significant efforts are being made to optimize CRISPR/Cas9-mediated genome editing to avoid transgene integration and off-target mutations. Subsequently, Woo et al.[6] transfected preassembled complexes of purified Cas9 protein and guide RNA into plants and demonstrated that the use of preassembled CRISPR/Cas9 ribonucleoproteins (RNPs) completely avoids transgene integration and greatly reduced off-target mutations. The direct delivery of Cas9-sgRNA RNP complexes induce mutations at target sites immediately after delivery and decomposes rapidly by endogenous proteases, reducing off-target mutations without compromising on-target efficiency. Thus, RGEN RNPs are regarded as a groundbreaking technology for producing DNA-free genetically edited crop plants[7].

      Larch (Larix spp.), being one of the most abundant conifer trees in the northern hemisphere, holds significant ecological and economic value[8]. In recent years, gene editing of coniferous trees has emerged as a prominent topic in biological science and forestry. Conventionally, CRISPR/Cas9 constructs are introduced into cells through Agrobacterium-mediated T-DNA transfer, which poses a risk of genomic integration of these constructs. Given the long breeding cycles of trees, strategies such as genetic segregation used to achieve DNA-free editing in annual crops are inefficient for forestry applications[9]. Therefore, the adaptation of non-transgenic, efficient genome editing methods is essential. The cutting-edge CRISPR/Cas9 RNPs technology, administering Cas9-sgRNA complexes directly to cells offers a robust solution for DNA-free genetic editing in plants[10]. We could develop a CRISPR/Cas9 RNP-mediated genome editing method for efficient and specific genome editing of major conifers, using L. kaempferi as experimental material and targeting the phytoene desaturase (PDS) gene. The PDS gene has been widely used as a phenotypic marker to rapidly standardize the establishment of CRISPR/Cas9 in a new plant system. Since its disruption leads to a color phenotype change, it makes it easy to screen mutant lines[11]. Accordingly, the present study aims to investigate the effectiveness of genome editing by directly delivering purified CRISPR-Cas9 RNPs to the embryogenic callus of L. kaempferi. We can also provide a reference for cultivating mutant coniferous tree materials with excellent commercial prospects.

    • Embryogenic calluses of L. kaempefri were induced from immature zygotic embryos extracted from seeds collected between June 30th and July 7th, 2021[12]. The methods for inducing embryogenic callus are elaborated in our previous study[13].

      The embryogenic calluses were initially cultured on a proliferation medium (BM1), which is comprised of BM[14] basal medium supplemented with 0.2 μM 6-BA, 0.4 μM 2,4-D, 0.1 g/L inositol, 0.5 g/L casein hydrolysate, 1.125 g/L L-glutamine, 30 g/L sucrose, and 7% (w/v) agar. This culture was maintained in darkness at 22 ± 1 °C. Before transitioning to embryonic callus maturation, the embryogenic calluses were cultured on a plant growth regulator-free transition medium, BM2, for one week. The maturation medium, BM3, comprises 30 mg/L abscisic acid (ABA), 1.0 g/L inositol, 1.0 g/L casein hydrolysate, 2.25 g/L L-glutamine, and 9% (w/v) sucrose. For the germination of mature somatic embryos, a half-strength MS medium[15] was employed. All culture media were adjusted to pH 5.8 before being autoclaved at 121 °C for 20 min Sterilization was carried out by autoclaving. Details of the culture media compositions can be found in Supplementary Table S1.

    • One gram of healthy and vigorous embryonic calluses was selected and placed at the center of a petri dish with a diameter of 2 cm. The petri dish was pre-cultured in darkness for two days before being subjected to particle bombardment and was filled with a 0.5 cm layer of BM1 culture medium.

    • The plant transformation vector pBI121 utilized in this study contains a selective marker gene Hygromycin B and a reporter gene encoding β-glucuronidase (GUS), both of which are controlled by a 35S promoter derived from the cauliflower mosaic virus (CaMV) (Supplementary Fig. S1). Plasmid DNA was introduced into E. coli DH5α cells. High-quality DNA for particle bombardment transformation was prepared using the gradient equilibrium centrifugation method of the EndoFree Maxi Plasmid Kit (TIANGEN, Beijing, China). Supercoiled plasmid DNA with a concentration of 1 μg/μl, was directly used in the transformation experiments.

    • First, 60 mg of gold powder is weighed. Then, 700 μL of 75% anhydrous ethanol was added and thoroughly vortexed for 10 min. The mixture was left to stand at room temperature for 10 min, followed by centrifugation at 1,500 rpm for 5 min. The supernatant was removed and discarded. Next, 700 μL of sterile water was added, vortexed for 5 min, and centrifuged at 1,500 rpm for 5 min before discarding the supernatant. This washing process was repeated twice. One mL of 50% glycerol was then added to the washed gold particles and mixed well by vortexing to obtain a gold powder with a final concentration of 60 mg/mL. The prepared gold suspension was stored at 4 °C.

      Fifty μL of the 60 mg/mL gold suspension was then transferred into a 1.5 mL Eppendorf tube and left to settle for 1 min to ensure complete suspension. Next, 5 μg of plasmid DNA and 50 μL of CaCl2 (2.5 M) were sequentially added to the gold suspension, and gently vortexed for a few seconds. Twenty μL of spermidine (0.1 M) was added and vortexed for 2 min, then incubated on ice for 2 min. Vortexing was repeated for an additional 2 min followed by 2 min of ice incubation. Subsequently, the mixture was centrifuged for 45 s at 10,000 rpm and the supernatant discarded. The pellet was then washed with 500 μL of anhydrous ethanol, vortexed for 2 min, and centrifuged for 1 min at 10,000 rpm. These steps were repeated twice. Finally, the pellet was suspended in 60 μL of anhydrous ethanol. These volumes are designed for six bombardments.

    • In this study, the Biorad PDS-1000/He desktop particle bombardment system was employed. Before bombarding pBI121-GUS, the relevant components were thoroughly sterlized with 75% ethanol, including the external and internal parts of the particle bombardment equipment, the macro carrier launch assembly, the rupture disc retaining cap, and the target disk holder. Ten μL of the DNA-gold mixture suspension was applied to the center of the micro-carrier and left to air dry for a few minutes before initiating the bombardment procedure. The particle bombardment parameters consisted of different combinations of rupture disc pressures (900, 1,100, and 1,350 psi) and target distances (9, 12, and 15 cm from the rupture discs to the target callus). The pre-cultured callus tissue was bombarded according to these parameters. The details of the particle bombardment technique were elaborated by Wang et al.[16]. For each unique parameter combination, there were six bombardments, and each session targeted one plate of callus.

    • After a two-day dark incubation following particle bombardment, the embryogenic callus in each petri dish were divided into 20 small pieces and cultured in BM1 for 5 d. Subsequently, the callus was transferred to the selection medium BM4, which contained 3 mg/L hygromycin. The total number of hygromycin-resistant callus pieces was counted under each parameter after 21 d, and each resistant piece was considered a putative transgenic line. Three callus tissue discs were used under each parameter to assess the stable transformation effect following particle bombardment.

      For GUS staining, 5-bromo-4-chloro-3-indolyl glucuronide-β-glucuronidase (X-gluc) was used according to the method described by Li et al.[17]. The stained samples were then incubated at 37 °C in darkness for 12 h and subsequently examined under a light microscope. Statistical analysis involved quantifying the number of GUS-stained spots under various experimental conditions. Each parameter was tested in three independent replicates to evaluate the immediate conversion results after particle bombardment.

    • Genomic DNA was extracted from 100 mg of both transformed and wild type (WT) embryogenic callus samples by using the cetyltrimethylammonium bromide (CTAB) method[18]. Thirteen clumps were then subjected to PCR screening to detect the presence of the GUS gene in transgenic embryogenic callus. For RNA extraction, embryogenic callus samples from the transgenic and WT groups were processed using the FastPure® Plant Total RNA Isolation Kit (Bioteke, Beijing, China). The extracted RNA was subsequently reverse-transcribed into cDNA using the HiScript® III 1st Strand cDNA Synthesis Kit (Vazyme, Nanjing, China).

      After cDNA synthesis, quantitative real-time PCR (qRT-PCR) reactions were performed in a 20 μL reaction volume containing 2×TransStar® Top Green qPCR Super Mix (Transgen, Beijing, China), 10 ng of cDNA, and primers at a concentration of 10 mM. The glyceraldehyde 3-phosphate dehydrogenase (GAPDH) gene was used as an internal control gene[19]. The primer sequences used are detailed in Supplementary Table S2.

    • The hygromycin-resistant embryogenic callus was subsequently transferred to a PGR-free BM2 medium for one week under dark conditions at 22 ± 1 °C. After that, the embryogenic callus was transferred to the maturation medium BM3 for 45 to 60 d to induce somatic embryos. The resulting mature somatic embryos were then transferred to the 1/2 MS germination medium to initiate germination and rooting. GUS staining was carried out on the resultant somatic embryo plants. The entire process diagram is shown in Fig. 1.
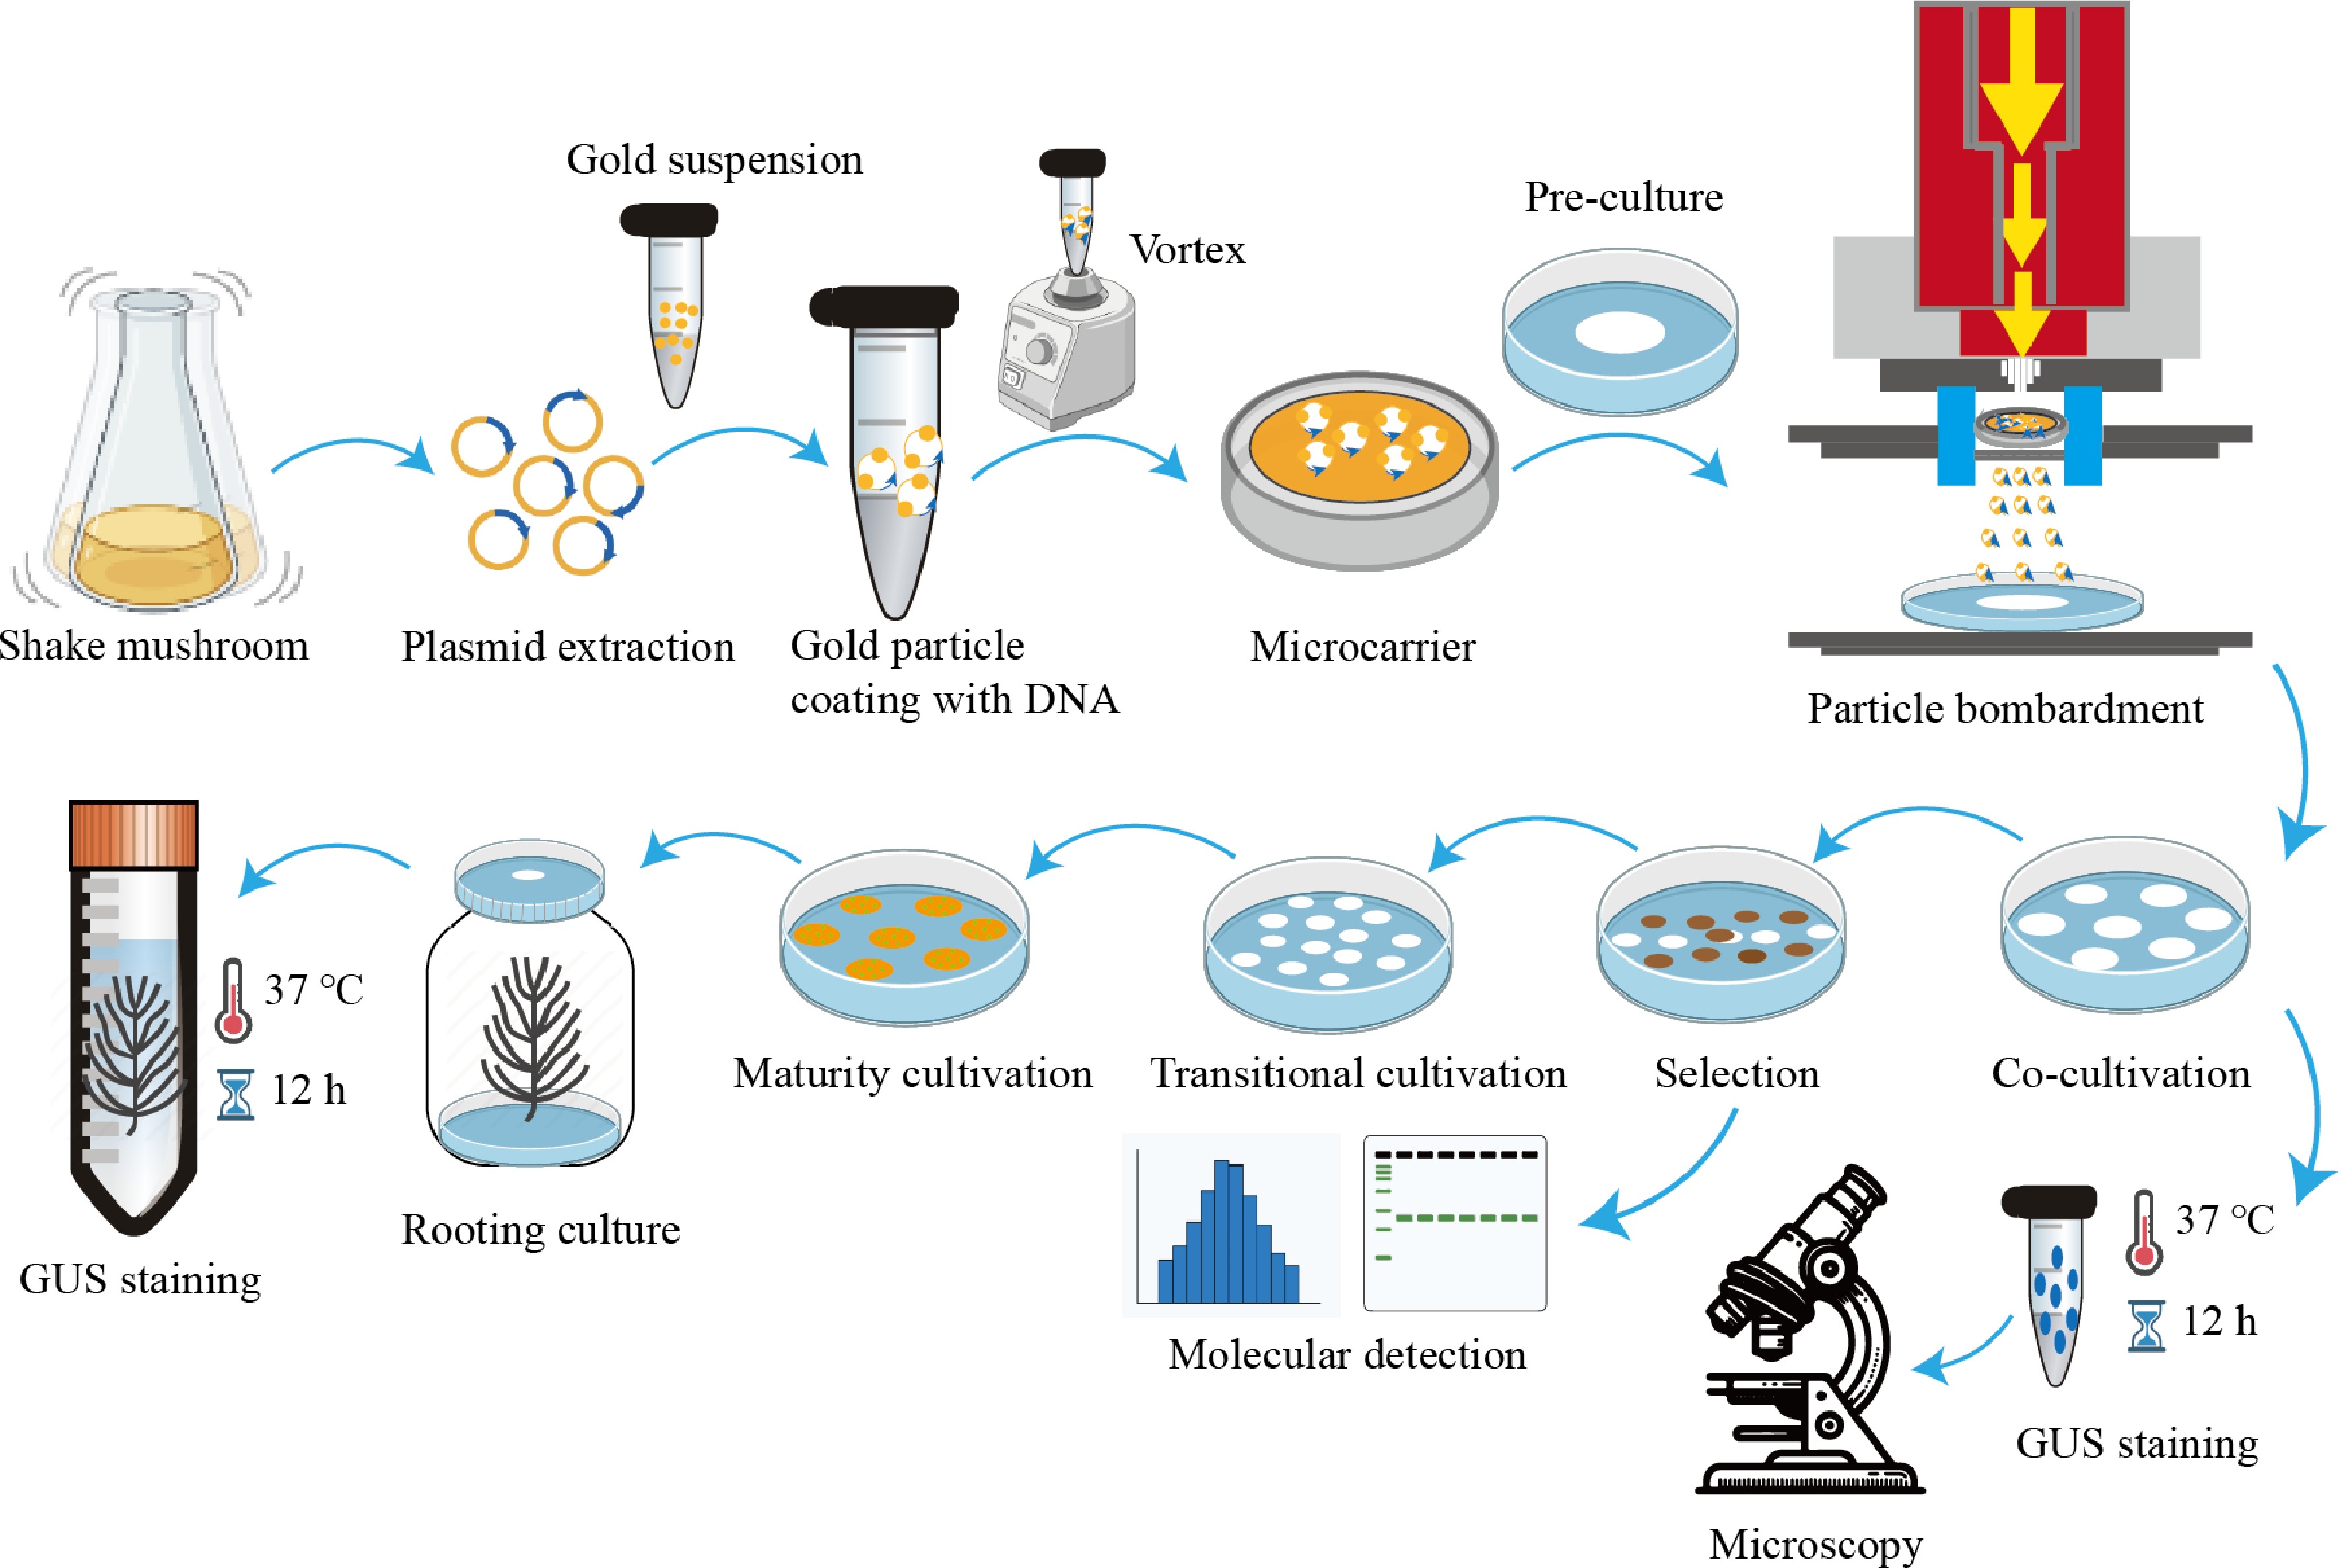
      Figure 1. 

      The flowchart for determining optimal particle bombardment parameters.

    • The complete cDNA sequence of the LkPDS (NCBI accession number BSBM01000076.1) gene from the L. kaempferi genome was cloned by amplifying the gene with specific primers (detailed in Supplementary Table S3) and using 2,000 ng of L. kaempferi genomic cDNA. The PCR reaction mixture included 100 μL of 10 × KOD buffer, 40 μL of dNTP (8 mM), 10 μL each of PDS-F (10 μM) and PDS-R (10 μM) primers, 8 μL of KOD FX (TOYOBO-KFX-101) polymerase, and 32 μL of nuclease-free water, for a total volume of 200 μL. PCR amplification was carried out under the following conditions: initial denaturation at 94 °C for 2 min, followed by 30 cycles of 98 °C for 10 s, 60 °C for 30 s, 68 °C for 1 min and 30 s, and a final extension at 68 °C for 5 min.

      The CRISPR-P 2.0 online tool was used to automatically identify and design the target sequences of the LkPDS gene[20], and the RNA fold web tools[21] were used to ensure their efficacy and specificity in editing the LkPDS gene. To target the LkPDS gene effectively, five distinct targets were selected within the first exon (Supplementary Fig. S2). The genomic location of the LkPDS gene was predicted based on the genome sequence of L. kaempferi. For further details on the NCBI link to the L. kaempferi genome containing the LkPDS gene, please visit L. kaempferi genome assembly LKA_r1.0 on the NCBI - NLM website. The specific sequences of primers are provided in Supplementary Table S4 for reference. The GC content was analyzed using an online tool (https://crm.vazyme.com/cetool/tmcal.html), while the efficacy of the sgRNA was predicted through the CRISPR Efficiency Predictor (www.flyrnai.org/evaluateCrispr)[22].

      The recombinant vector was assembled by using the fragment sequence and the pAbAi vector (Supplementary Fig. S3) as the target DNA fragments for in vitro validation. Both the fragment sequence and the pAbAi vector contained cleavage sites compatible with Sac I and Sal I enzymes. To merge the target fragment with the vector, 450 ng of the fragment sequence insert, 150 ng of the pAbAi vector, 2 μL of 5 × T4 DNA ligase buffer, 1 μL of T4 DNA ligase, and 2 μL of nuclease-free water were combined in a total volume of 10 μL. The ligation reaction was conducted at 25 °C for 10 min.

    • The pMJ915 vector (Supplementary Fig. S4), which contains the Cas9 coding sequence flanked by a pair of T7 promoters and an MBP sequence was utilized[23] to express Cas9 protein. The expression of Cas9 protein was induced in the E. coli Rosetta strain at 21 °C for 14 h. Subsequently, the protein was purified by nickel affinity chromatography and desalted using ice-cold PBS buffer with a molecular weight cut-off (MWCO) filter. The purity and concentration of the Cas9 protein were evaluated using the Bradford protein assay. Then, the concentration of the Cas9 protein was adjusted to 1 μg/μL for subsequent experimental procedures.

    • Transcription templates were prepared through a specific PCR protocol employing specific primers is detailed in Supplementary Table S5. The transcription process was carried out using the NEB T7 Quick High Yield RNA Synthesis Kit in accordance with the provided instructions.

    • The recombinant vector outlined in Supplementary Table S6 was linearized utilizing the BstB I enzyme. The target DNA fragments containing the designated target site were purified and eluted with RNase-free water. A combination of Cas9 protein (2 μg), gRNA (2 μg), and the purified 12 μL linearized target DNA (250 ng) was prepared in a reaction buffer consisting of 0.8 μL 1 M phosphate buffer (pH 7.5), 2.18 μL PBS, 1 μL 100 mM MgCl2, and 0.02 μL 1 M DTT to achieve a total volume of 20 μL. This mixture was digested at 37 °C for 1 h as detailed in Supplementary Table S6. The resultant products were purified using QIAquick spin columns for PCR purification. Subsequently, the purified products were subjected to analysis on a 1% agarose gel, and the cleavage activity was assessed by quantifying the number of digested products relative to the total input target DNA quantity.

    • For each bombardment, 2 μL each of Cas9 protein and gRNA were mixed in a reaction buffer containing 20 mM HEPES (pH 7.5), 150 mM KCl, 10 mM MgCl2, and 0.5 mM DTT, totaling 10 μL. This mixture was then incubated at 25 °C for 10 min. Subsequently, 5 μL of 0.6 mM gold nanoparticles were added. The particles coated with this mixture were evenly distributed onto the carrier and allowed to air-dry at room temperature for approximately 10 min[24]. The bombardment systems established parameters, including a helium pressure of 1,100 psi and a bombardment distance of 9 cm, were utilized for the effective delivery of the Cas9 RNPs into the embryogenic callus.

    • The embryogenic callus that had been treated with Cas9 RNPs through biolistic bombardment was dissected into small fragments, each with a diameter of approximately 0.5 cm, and cultured on BM2 medium. After another week, the fragments were transferred to BM3 medium to promote the development of somatic embryos. During a maturation period of 45−60 d, the somatic embryos were transferred to 1/2 MS germination medium to initiate germination and plant regeneration. Initial mutation screening was carried out by examining variations in the color of the germinating somatic embryos. Mutations suspected to be positive were precisely identified using specific primers and confirmed by Sanger sequencing, with reference to the primers detailed in Supplementary Table S7. A detailed statistical analysis was performed on the mutant somatic embryos derived from various targets, including data such as the total number of somatic embryos obtained from six grams of embryonic callus and the count of albino somatic embryos. The editing efficiency was evaluated by determining the percentage of albino embryos relative to the total number of embryos produced.

    • Data analysis was conducted using a least significance difference (LSD) in one-way analysis of variance (ANOVA) to determine statistical significance, which was set at a threshold of p ≤ 0.05. The varying levels of significance, indicated by labels from a to g, represent a gradient of significance from highest to lowest.

    • To ensure the conversion efficiency of particle bombardment transformation, the genetic transformation of embryogenic callus were initiated using the PBI121-GUS vector particle bombardment under various settings with different combinations of rupture disk pressure and target distance parameters. The pre-culture of the embryogenic callus before bombardment is shown in Fig. 2a. After bombardment, the embryogenic callus was cultured for a week (Fig. 2b) before being transferred to hygromycin select. The hygromycin-resistant callus is shown in Fig. 2c. The induction results of somatic embryos are shown in Fig. 2d.

      Figure 2. 

      Transformation experiment results via particle bombardment. (a) Pre-culture before particle bombardment; (b) Subculture after particle bombardment; (c) Hygromycin-resistant embryogenic callus shown visually; (d) Induction of somatic embryos, (a)−(d) bar =1.5 cm. (e) Histochemical staining for GUS expression after particle bombardment under various parameters in embryogenic callus, bar = 50 μm; (f) The statistical analysis of GUS blue spot numbers under various particle bombardment parameters. Mean ± standard deviation, n = 3 (ANOVA; p ≤ 0.05); (g) The number of hygromycin-resistant callus under different parameters (The total sum of all hygromycin-resistant callus tissues in six replicates under each parameter. P1: 900 psi and 9 cm, P2: 900 psi and 12 cm, P3: 900 psi and 15 cm, P4: 1100 psi and 9 cm, P5: 1,100 psi and 12 cm, P6: 1,100 psi and 15 cm, P7: 1,350 psi and 9 cm, P8: 1,350 psi and 12 cm, P9: 1,350 psi and 15 cm). (h) Polymerase chain reaction (PCR) analysis of the ß-glucuronidase (GUS) gene (700 bp) at DNA levels in transgenic lines subjected to the parameters 1,100 psi and 9 cm; (i) Quantitative real-time (qRT)-PCR quantification of GUS gene expression levels under the parameters 1,100 psi and 9 cm, with wild-type (WT) as the negative control. Lines 1−13 denote transgenic lines of embryogenic callus. Data are represented as the mean from a minimum of three replicates. Different letters (a−g) above the column chart indicate statistically significant differences determined by an ANOVA test. Mean ± SD, n = 3. (ANOVA test; p ≤ 0.05).

      The microscopic examination results of GUS histochemical staining of calluses after bombardment in each parameter (Fig. 2e), along with the statistics of GUS blue spots (Fig. 2f), indicated that the optimal bombardment conditions were identified as 1,100 psi pressure and 9 cm distance. The total number of callus tissue clumps for resistance selection is 720 under each parameter. At 900 psi, the number of hygromycin-resistant callus is 6, 5, and 3 respectively. At 1,100 psi, the number of hygromycin-resistant callus is 13, 8, and 6 respectively. And at 1,350 psi, the number of hygromycin-resistant callus is 4, 7, and 5 respectively (Fig. 2g). The evaluation of transformation efficiency under diverse parameters showed that the transformation efficiency was most significant at 1,100 psi and a 9 cm distance (P4: 13). Furthermore, molecular assessments involving PCR of hygromycin-resistant embryogenic callus lines under these optimized conditions (Fig. 2h) and quantitative real-time PCR for GUS gene expression (Fig. 2i) affirmed successful gene integration and expression within the L. kaempferi genome.

      Moreover, the GUS activity evidenced by histochemical staining in both transgenic callus (Fig. 3a) and corresponding transgenic plants (Fig. 3b) confirmed the stable hereditary transmission of the GUS gene from embryonic callus to plant regeneration.
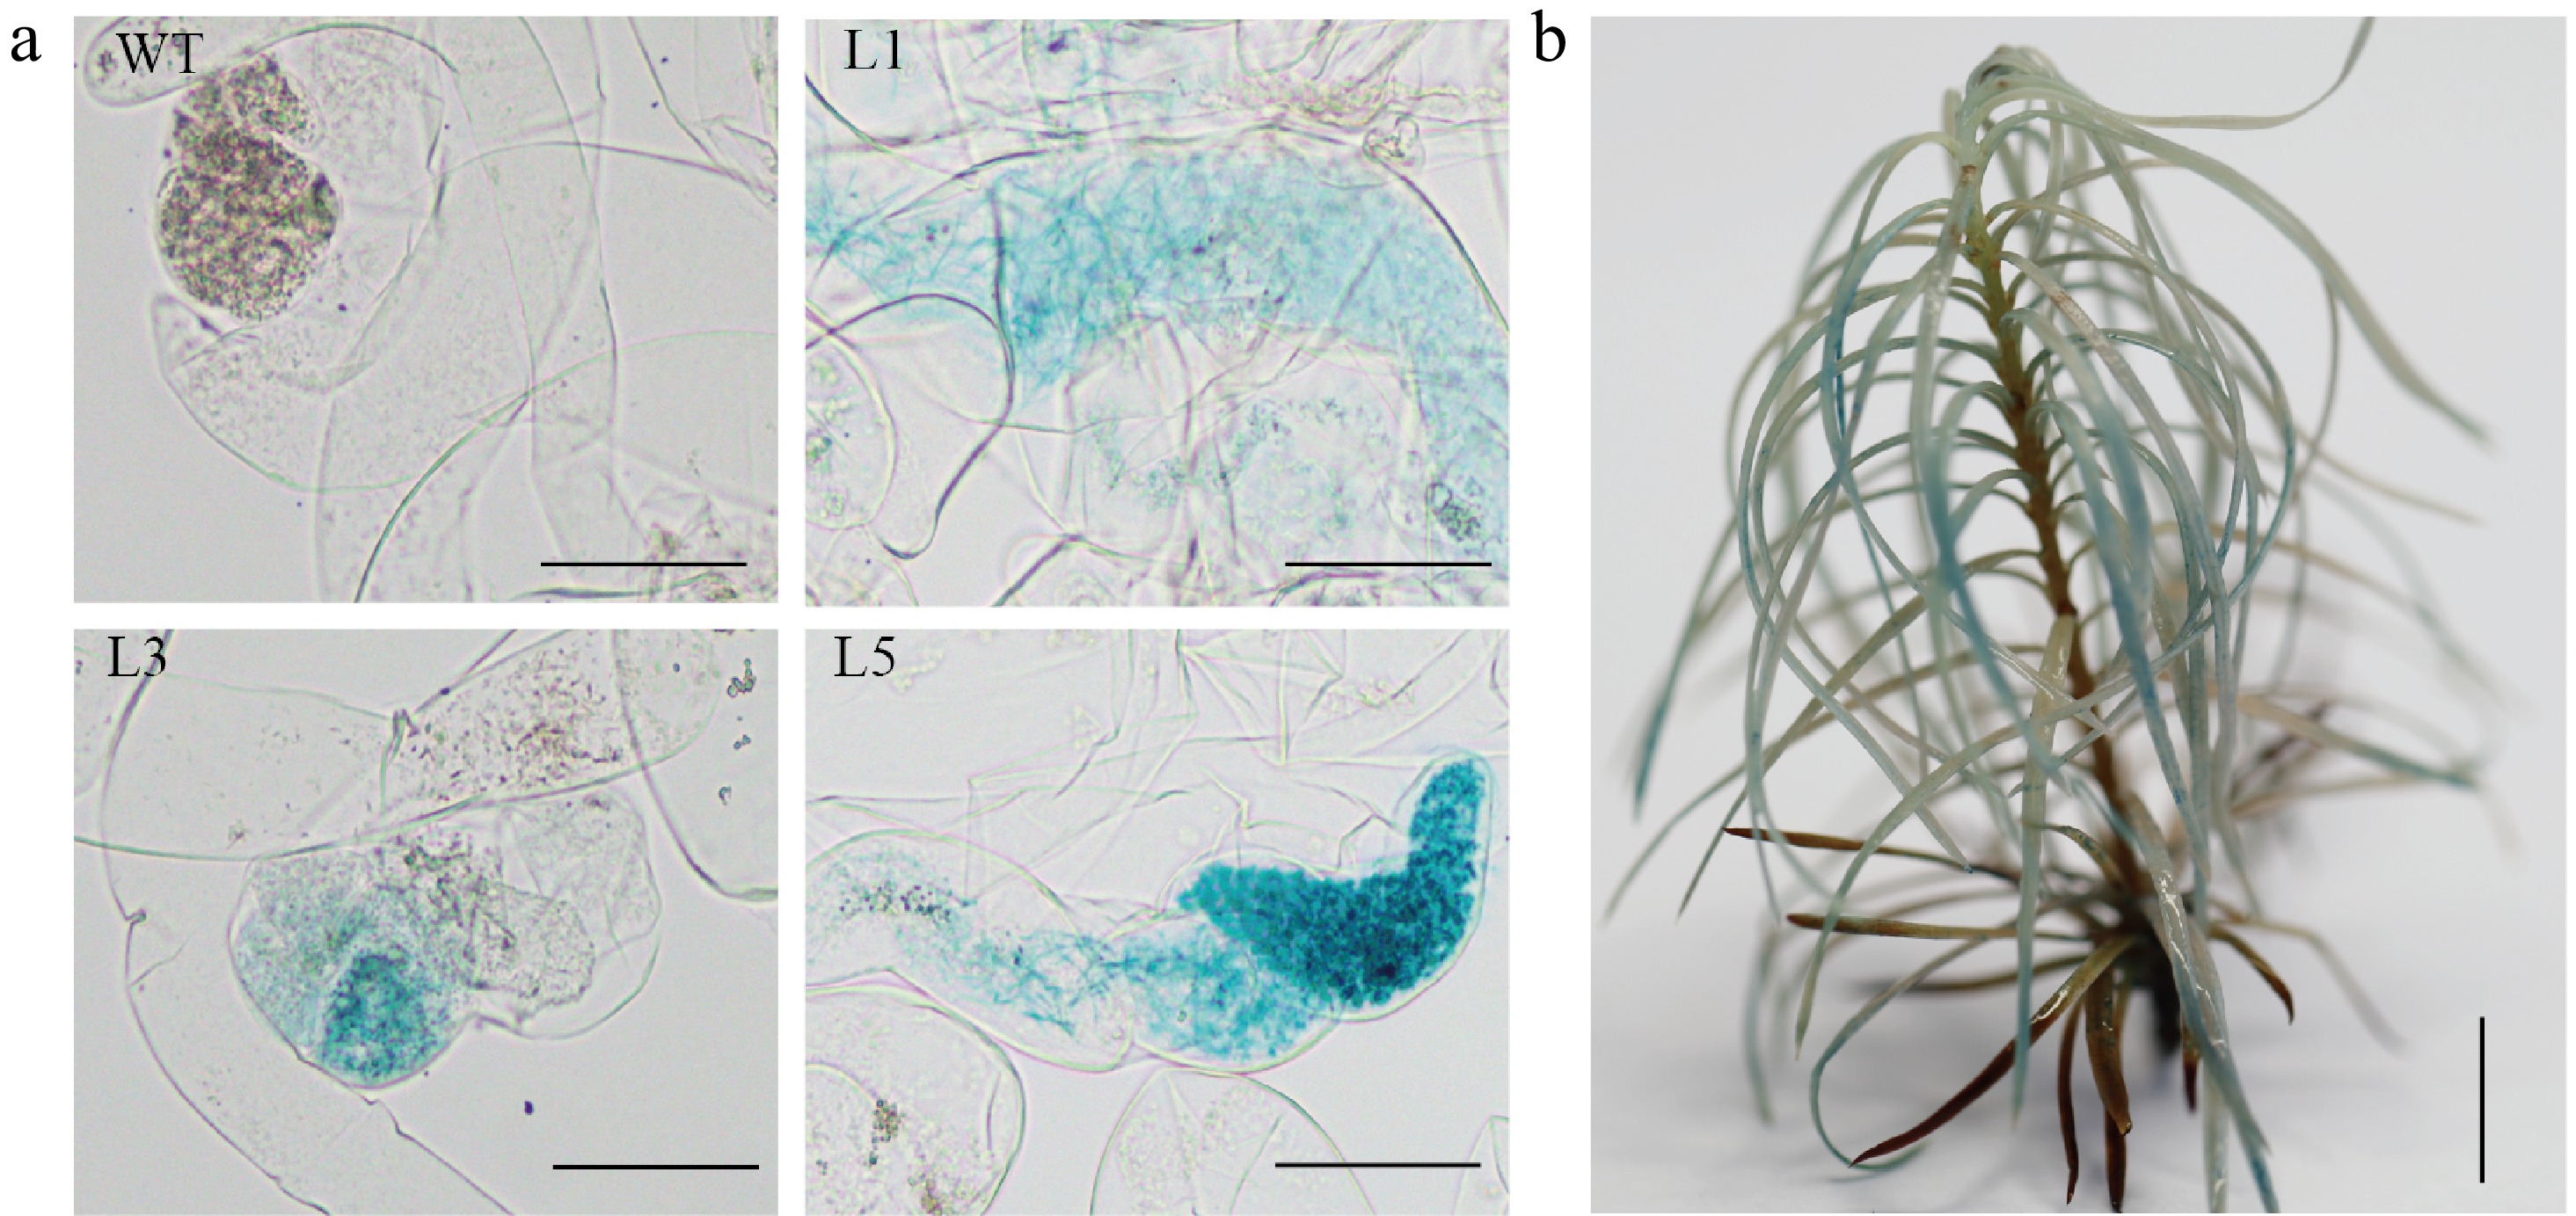
      Figure 3. 

      Histochemical staining for ß-glucuronidase (GUS) activity in the transgenic embryogenic callus and the transgenic plant. (a) Histochemical staining for GUS activity in WT and transgenic embryogenic callus (L1, L3 and L5 represent different lines), Scale bar = 100 μm; (b) Histochemical staining for GUS activity in regenerated plants, Scale bar = 2 cm.

    • To evaluate the editing efficacy of the LkPDS gene targets in vitro, the full-length cDNAs encoding the LkPDS gene were cloned. The LkPDS gene is 1,752 bp in length (Fig. 4a), and the editing sites were precisely identified using CRISPR-P v.2.0 software. According to the selection criteria for efficient sgRNAs and genomic location prediction of the LkPDS gene (Supplementary Fig. S2), five targets on the first exon were selected (Table 1).

      Figure 4. 

      In vitro validation process for five target sites. (a) Cloning of the LkPDS gene. M, DL2000 marker; (b) Detection of the recombinant vector. M, DL2000 marker; (c) Linearized recombinant vector. M, DL15000 marker; (d) In vitro validation results. 1−5: represent five specific targets; Negative control: N1: gRNA(-), N2: Cas9(-); M, DL2000 marker.

      Table 1.  Sequences of the five target sites, GC content and their corresponding predicted sgRNA efficiency.

      Name Sequence (5'-3') GC (%)
      predicted
      sgRNA
      efficiency
      Target 1 GCAGCAGTCTGTCATCTGCG 60 4.7625
      Target 2 TGCGCTCTGTGAAAAAGAAA 40 5.03752
      Target 3 AAAGGGATCGAAACGCGACG 55 4.72023
      Target 4 AGGTTTGGCTGGCTTGTCAA 50 6.36878
      Target 5 GAGGCAAGAGATGTTCTTGG 50 7.32143

      A vector containing the target sites was constructed for in vitro validation. The recombinant vector result confirmed by the vector primer and gene primer is 680 bp (Fig. 4b). The length of the linearized recombinant vector is a combination of gene length and vector length, which is 5,367 bp (Fig. 4c). The sgRNA was transcribed in vitro and mixed with purified Cas9 protein. The resulting RNPs exhibited effective cleavage activity in vitro is shown in Fig. 4d. In Fig. 4d, lanes 1−5 represent the cleavage results of the five targets, respectively. The two electrophoretic bands in lanes 1−5 are the result of the recombinant vector breaking at the target location. Lanes N1 and N2 are negative controls for the absence of Cas9 and sgRNAs in the reaction, respectively. This result indicates that the RNPs can function at the target location of genes, and the process requires the combined action of cas9 protein and sgRNA.

    • Proteins and sgRNA were synthesized in vitro and then the Cas9 RNPs complex delivered into embryogenic callus employing particle bombardment at settings of 1,100 psi and 9 cm. After a week of transitional culture, the embryonic callus treated with the gene gun was transferred to the somatic embryo maturation medium to facilitate further development. Five months after treatment, somatic embryo-derived plants were successfully obtained. Throughout the entire process, the growth phenotypes of WT, albino, and mosaic plants were meticulously documented at various developmental stages (Fig. 5af). In the germination culture phase, WT plants showed robust elongation and developed healthy roots (Fig. 5d). In contrast, albino plants displayed severely stunted growth and ultimately turned black and died (Fig. 5e). Mosaic plants had significantly slower growth rates compared to WT plants (Fig. 5f). Upon eight weeks of light exposure, the phenotypic characteristics of the somatic embryo plants were evident as shown in Fig. 5g.
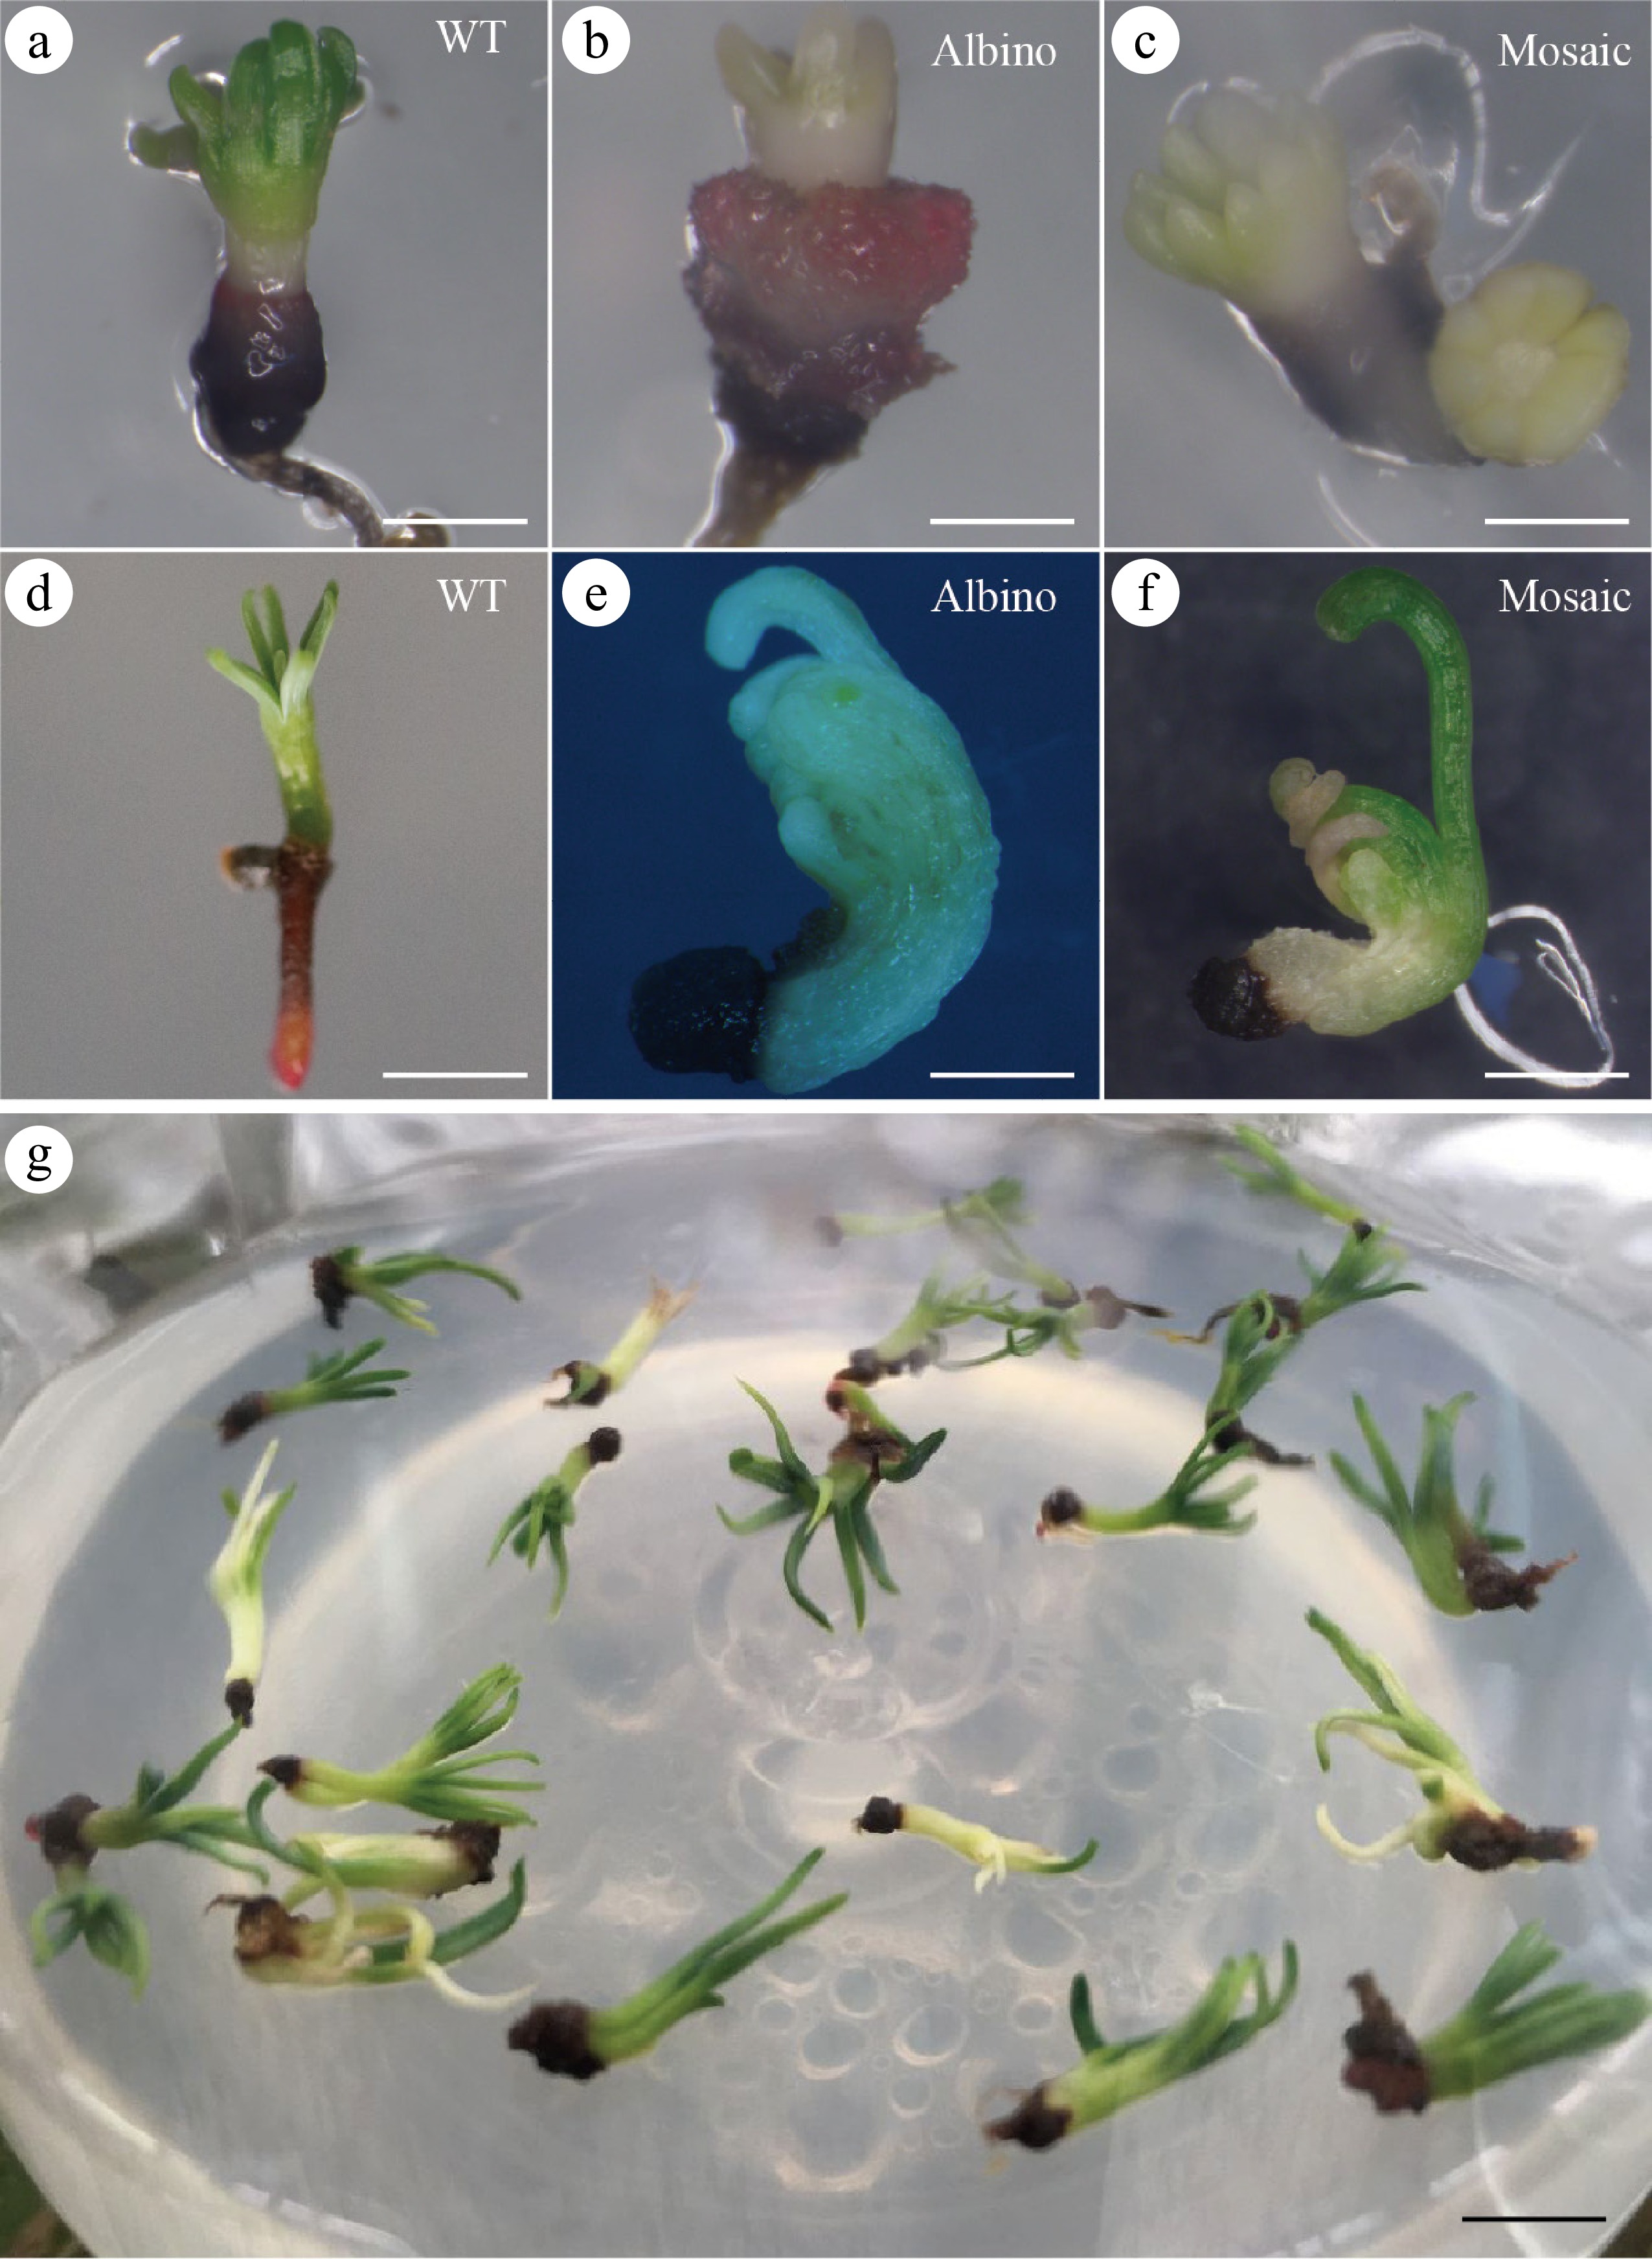
      Figure 5. 

      Albino and mosaic mature somatic embryos developed from embryogenic callus bombarded with Cas9/gRNA particles. Mature somatic embryos exposed to light for 4 weeks; (a) WT, bar = 1.5 mm; (b) albino, bar = 1 mm; (c) mosaic, bar = 1 mm. Albino and mosaic mutant plants after particle bombardment; (d) Somatic embryo plant of WT, bar =1 cm; (e) Somatic embryo of albino, bar =2 mm; (f) Somatic embryo plant of mosaic, bar = 2 mm; (g) Depicts somatic embryo plants after 8 weeks of light exposure, bar = 1 cm.

      Subsequent sequencing of these plants using specific primers validated targeted edits in the LkPDS gene at targets 1 and 2 (Fig. 6a, b). An analysis of the sequencing peak plots showed that site 1 in the chromatograms predominantly displayed double peaks, signifying heterozygous mutations (Fig. 6c). Target site 2 predominantly exhibited biallelic mutations (Fig. 6d), leading to a higher proportion of albino somatic embryo plants. Simple base mutations appeared to be more frequently associated with the mosaic phenotype. Moreover, the numbers of somatic embryo plants, as well as the counts of albino and mosaic plants at five target sites, were recorded (Table 2).

      Figure 6. 

      The editing results and data statistics of mutant plants. (a) Displays Sanger sequencing results at the target site in mutated somatic embryo plants. Blue indicates the target site and red denoting PAM sites. Nucleotide insertion, deletion, and substitution are marked as 'i', 'd', and 's', respectively. (b) Sequences at target site 1 in mutant somatic embryo plants. The black arrows indicate the mutation sites. PAM sites are highlighted in red spaces. (c) The results 1-1, 1-2 and 1-3 are single base mutations at the black arrows sites. The sequencing chromatograms of 1-2 and 1-3 are characterized by significantly double peaks. The result 1-4 is a single base insertion at the black arrow site. (d) The result 2-1 is single base mutations at the black arrows sites. The sequencing chromatograms of the 2-2 to 2-5 were characterized the deletion of bases at the black line. The result 2-5 is also showed single base mutations at the black arrows sites.

      Table 2.  The number of albino and mosaic transgenic somatic embryo plants among the five targets.

      Target site number Total number
      of somatic
      embryos
      Number of albino somatic embryo plants Number of mosaic somatic embryo plants
      Target site 1 281 1 3
      Target site 2 234 4 1
      Target site 3 316 0 0
      Target site 4 162 0 0
      Target site 5 244 0 0
    • Gene editing in coniferous trees, especially larch, is attracting attention in the fields of biological science and forestry. In this study, an effective genetic editing system is presented and, for the first time, the potency of CRISPR/Cas9 RNPs demonstrated as a powerful instrument for genome editing in larch. This advancement is poised to greatly accelerate research into genetic breeding and the development of new germplasm in larch.

      The mediation system of RNPs is crucial for the efficiency of larch gene editing. In the present research, the GUS reporter gene was employed to determine the optimal parameters for particle bombardment transformation of embryogenic calluses. Various parameter combinations were explored and detailed statistics conducted to identify the most effective transformation settings. Subsequently, robust callus tissue and plants were successfully developed. This comprehensive approach outlines a solid protocol for particle bombardment-mediated genetic transformation in larch. Proteins and sgRNA were synthesized in vitro and these optimized parameters applied to transform the CRISPR/Cas9 RNPs into embryogenic calluses. Compared to the Agrobacterium-mediated approach, which requires the construction of vector plasmids, the present direct delivery method enables immediate genomic editing with RNPs that are only transiently expressed. Previous studies such as Subburaj et al.[25] have shown that plasmid-based methods are significantly less effective than RNPs. Moreover, compared to the PEG-mediated method, particle bombardment is simpler, more efficient, and applicable to a broader range of materials. This efficient and robust genetic transformation system has enabled us to establish a CRISPR/Cas9-based genome editing tool specifically tailored for larch. Consequently, the proposed method is not only more precise but also acts more rapidly in altering the larch genome. This highlights its potential as a transformative tool in forest genetic research and applications.

      Appropriate explants are crucial for successful gene editing in larch[26]. Although gene editing of tree species is not yet widespread, the utilization of protoplasts for initial proof-of-concept studies has been relatively common in certain tree species[27,28]. Additionally, genome editing with RNPs has been effectively implemented in various tree species utilizing protoplasts[29,30]. Compared to the regeneration challenges associated with transformed protoplasts, the embryogenic callus is an advantageous receptor for gene editing due to its widely available source material, rapid reproduction rate, receptiveness to exogenous genes, and high transformation efficiency. Furthermore, the application of RNPs in somatic embryogenic cell cultures has been documented, with remarkable success in achieving CRISPR/Cas9 genome editing in Pinus radiata[31]. Similar approaches have led to the generation of gene-edited mutants in embryogenic tissues of Picea glauca[32], highlighting the suitability of using callus tissue for gene editing in coniferous trees. In the present study, taking advantage of the unique characteristics of larch, embryogenic calluses combined with somatic embryogenesis technology were chosen to obtain the mutants (Fig. 3ad). Compared to other types of receptor materials, such as leaves, protoplasts, and somatic embryos, the embryogenic calluses demonstrated high genetic stability, which ensured that the edited plants remained consistent with those of the original embryogenic calluses. The stronger proliferative capacity of the embryogenic calluses enables rapid propagation and the production of a greater number of genetically edited plants. The mutations introduced during the editing process were faithfully transmitted from the embryogenic calluses to the regenerated plants.

      A detailed analysis of RNPs-mediated mutagenesis uncovered significant differences between the efficiency of in vitro cleavage in embryogenic calluses and the overall gene editing efficiency across various target sites (Fig. 4, Table 2). This variation in efficiency has been supported by other studies, including those by Liu et al.[33] and An et al.[34]. Notably, the present data indicated exceptionally higher editing efficiency at target site 2 compared to other sites, which can be largely ascribed to its lower GC content. Low GC content has been previously suggested by Tsai et al.[35] to reduce the likelihood of off-target effects, thereby enhancing the precision of the edits. Furthermore, the RNA sequence for the sgRNA at target site 2 was found to contain a significant proportion of Uracil. This composition enhances sgRNA specificity and potentially reduces its degradation or disintegration, as proposed by Pallarès Masmitjà et al.[36]. These findings emphasize the crucial role of strategic target site selection in maximizing the efficacy of CRISPR/Cas9 applications for genetic improvement in larch. Additionally, disparities have been observed between the efficiency of in vitro DNA cleavage and that achieved through protoplast transfection, a phenomenon that might be associated with the architecture and modifications of chromatin as suggested by Park et al.[37]. These structural differences could influence the accessibility of the target DNA sites and the overall efficiency of the gene editing process. Given these insights, it is essential to select sgRNAs that are both customized for specific genetic targets and compatible with the cellular environment to ensure optimal integration and function during in-cell transfection.

      Mosaicism is a phenomenon that cannot be overlooked in the results of gene editing. In the present research, it was observed that the mutants frequently displayed mosaicism (Fig. 6g), a phenomenon also reported in genome editing of other coniferous species such as Pinus radiata[31], Picea glauca[32], and Japanese cedar[38]. Mosaicism can occur due to the delayed action of the Cas9 enzyme during the rapid division of embryogenic tissues, as suggested in previous studies[39,40]. Additionally, the sustained activity of CRISPR/Cas9 may contribute to this phenomenon[38]. Another aspect that might influence the occurrence of chimeric mutations is the culture temperature. For instance, Xiang et al.[41] identified that the optimal activity temperature for the CRISPR/Cas9 system is 37 °C. Deviations from this optimal temperature can lead to uneven activation of the Cas9 enzyme, thereby potentially increasing the likelihood of generating chimeric mutants. These factors-delayed Cas9 cleavages, the ongoing activity of CRISPR/Cas9, and sub-optimal culture temperatures could cause the formation of plants composed of cells that have been edited differently, contributing to the chimeric nature of the mutants. Considering these variables can be crucial when planning and executing gene editing in larch, as they significantly impact the homogeneity and stability of the desired genetic modifications. Therefore, it is advisable to closely control these conditions to minimize the risk of mosaicism and optimize the efficiency of the CRISPR/Cas9 system in larch.

      In summary, this research introduces a novel application of CRISPR/Cas9 RNP complexes for targeted genome editing in larch, establishing an unprecedented method for generating mutant phenotypes within this species. It confirms the effectiveness of a DNA-free strategy in conifers, avoiding the complications associated with traditional transgenic methods while promoting sustainable forestry by maintaining genomic integrity. This innovative non-transgenic gene editing approach in larch holds considerable potential for minimizing regulatory obstacles, accelerating breeding cycles, and enhancing the integration of gene-edited trees into commercial forestry practices. This breakthrough represents a crucial advancement in the sustainable genetic enhancement of forestry species, paving the way for broad implementation and possible commercialization of genome-edited conifer plants.

    • In this study, the optimization of parameters for the particle bombardment transformation of embryogenic callus were explored and the editing efficiency of the maker gene targets verified in vitro. A biolistic delivery system was employed to introduce the CRISPR/Cas9 RNP complexes into embryogenic calluses, successfully achieving edited embryogenic calluses and mutants. The present results highlight the feasibility of using CRISPR/Cas9 genome editing in the coniferous tree species, larch, through the direct delivery of RNPs. The advantages and disadvantages of this method were systematically analyzed, providing a comprehensive evaluation of its practical utility. Among the advantages is the DNA-free nature of this genome editing approach, which is particularly crucial in avoiding the integration of foreign DNA into the host genome—a significant concern in plant genetic manipulation. This method allows for precise and clean editing, minimizing regulatory hurdles associated with genetically modified organisms and facilitating the development of mutant plants that are more likely to be accepted in various markets. Another notable benefit is the possibility of applying this technique to large and complex genomes, such as those of coniferous trees. The success of this approach in larch suggests that it can be extended to other species with similarly complex genomes, potentially revolutionizing forest biotechnology by enabling the creation of genetically enhanced trees with desirable traits such as disease resistance, improved wood quality, or enhanced growth rates.

      • This work was supported by Biological Breeding-Major Projects (Grant No. 2022ZD0401602).

      • The authors confirm contribution to the paper as follows: study conception and design: Yang J, Li C; data collection: Zhang C, Yu L; analysis and interpretation of results: Ma M; draft manuscript preparation: Ma M, Li C. All authors reviewed the results and approved the final version of the manuscript.

      • All data generated or analyzed during this study are included in this published article and its supplementary information files.

      • The authors declare that they have no conflict of interest.

      • Supplementary Table S1 Types of culture media used in the study.
      • Supplementary Table S2 Primers used for GUS gene analyses.
      • Supplementary Table S3 Primers used for LkPDS gene analysis.
      • Supplementary Table S4 Sequences required for gRNA synthesis.
      • Supplementary Table S5 Details of primer design and gRNA synthesis for the study.
      • Supplementary Table S6 Instructions for preparing target DNA and Cas9 recombinant protein.
      • Supplementary Table S7 Primer sequences for amplifying genomic fragments covering the target sites.
      • Supplementary Fig. S1 Schematic representation of T-DNA region in pBI121-GUS plasmid. RB, right border; LB, left border; Hyg, hygromycin resistance; CaMV 35S promoter, cauliflower mosaic virus 35S promoter; GUS, coding region of the GUS gene. Hind III = unique Hind III restriction site within T-DNA; Sac I = two Sac I restriction site within T-DNA; EcoR = unique EcoR I restriction site within T-DNA; BamH = unique BamH I restriction site within T-DNA.
      • Supplementary Fig. S2 The predicted structure of LkPDS genes in the genome region. And the distribution position of the five targets in exon 1. The gray boxes indicate exons; the black lines represent introns.
      • Supplementary Fig. S3 Schematic illustration of the fiull-length plasmid pAbAi. MCS, multiple cloning site; AuR, aureobasidin A-resistant; AmpR, ampicillin resistance; Sac I = unique Sac I restriction site within the plasmid; Sal I = unique Sal I restriction site within the plasmid; BstB I = unique BstB I restriction site within the plasmid.
      • Supplementary Fig. S4 Representation of the full-length plasmid PMJ915. Streptococcus pyogenes Cas9 with two C-terminal SV40 NLS for nuclear localization; MBP, maltose binding protein labels; AmpR, ampicillin resistance; Multiple cloning sites for efficient gene insertion.
      • Copyright: © 2024 by the author(s). Published by Maximum Academic Press, Fayetteville, GA. This article is an open access article distributed under Creative Commons Attribution License (CC BY 4.0), visit https://creativecommons.org/licenses/by/4.0/.
    Figure (6)  Table (2) References (41)
  • About this article
    Cite this article
    Ma M, Zhang C, Yu L, Yang J, Li C. 2024. CRISPR/Cas9 ribonucleoprotein mediated DNA-free genome editing in larch. Forestry Research 4: e036 doi: 10.48130/forres-0024-0033
    Ma M, Zhang C, Yu L, Yang J, Li C. 2024. CRISPR/Cas9 ribonucleoprotein mediated DNA-free genome editing in larch. Forestry Research 4: e036 doi: 10.48130/forres-0024-0033

Catalog

  • About this article

/

DownLoad:  Full-Size Img  PowerPoint
Return
Return