


-
Poplar (Populus L.) is an important species for protection and timber forests in China. It is widely planted in northern and central China, and it has many cultivated varieties. The photosynthetic capacity of poplar influences its growth and development process; higher photosynthetic efficiency can enhance the growth of fast-growing species such as poplar[1]. Understanding the photosynthetic characteristics of various poplar varieties is essential for their promotion, application, and management. Current studies focus on comparing the photosynthetic performance of different poplar species to identify those best suited for enhancing productivity or resisting environmental stresses such as drought[2], salinity stress[3], and pest impact[4]. Although photosynthetic rate is a primary indicator of a plant's photosynthetic capacity[5], water use efficiency also affects plant growth. Poplar species that accumulate more organic matter while consuming less water are considered suitable for cultivation in arid regions of China[6,7]. For many studies, four basic metric—net photosynthetic rate (Pn), transpiration rate (Tr), intercellular CO2 concentration (Ci), and stomatal conductance (Gs)—are measured to fully assess the photosynthetic performance of plants[8−10]. However, measuring these parameters is often time-consuming and laborious. Given the relationship between light absorption and leaf physiological substances such as pigments[11], water[12], and dry matter[13], remote sensing methods hold great potential for quickly accessing photosynthetic differences among plant species[14] or genotypes[15].
Studies based on remote sensing have long employed vegetation indices to explore relations between leaf spectral and photosynthetic properties[16−19]. Several vegetation indices are commonly used to estimate photosynthetic parameters. The photochemical reflectance index (PRI) has been successfully applied to assess photosynthetic functioning[20] and has proven sensitive to changes in photosynthesis under environmental stresses[21]. Other vegetation indices include the normalized difference vegetation index (NDVI) for detecting leaf chlorophyll absorption[22], the normalized difference nitrogen index (NDNI) for mapping nitrogen and content[23], and the enhanced vegetation index (EVI) for monitoring photosynthetic phenology[24]. However, vegetation indices may have limitations due to the restricted number of bands that comprise them. In this case, hyperspectral techniques offer more detailed insights from raw spectra, reflecting essential information about physiological materials. Despite the redundance of hyperspectral data, partial least regression (PLSR) models are increasingly used to predict photosynthetic capacity, specifically to estimate the maximum rate of carboxylation (Vcmax) and the maximum rate of electron transport (Jmax)[14,25−27]. However, few studies have considered both raw spectral reflectance and vegetation indices to explicitly estimate Pn, Tr, Ci, and Gs to compare photosynthetic abilities across different poplar genotypes.
In this study, six genotypes of poplar (P. davidiana × P. bolleana, triploid P. tomentosa, P. tremula × P. alba, P. hopeiensis, P. deltoides × P. euramericana 'Nanlin895', P. alba × P. glandulosa) were used as experimental materials. Photosynthetic factors and hyperspectral reflectance (400–2,500 nm) were measured in the upper, middle, and lower leaf layers to compare the photosynthetic and hyperspectral differences among the poplar genotypes. A correlation analysis was conducted between photosynthetic parameters and spectral traits. A BP neural network was then employed to develop a photosynthetic inversion model based on hyperspectral data from the leaves. Key spectral variables were identified to offer a rapid method for assessing the photosynthetic capacity of poplar seedlings.
-
P. davidiana × P. bolleana, triploid P. tomentosa, P. tremula × P.alba, P. hopeiensis, P. deltoides × P. euramericana 'Nanlin895' and P. alba × P. glandulosa were used as experimental materials. The poplar tissue culture seedlings of these six genotypes were transferred to pots and cultivated in a growth chamber set at 25 °C. Once the seedlings reached a height of 30 cm, they were transplanted to a greenhouse for further cultivation. Five seedlings of each genotype, totaling 30 plants, were selected for the experiment. The mean height and ground diameter of the seedlings for the six genotypes are shown in Supplementary Table S1.
Measurement of leaf photosynthetic parameters and spectral reflectance
-
The photosynthetic parameters of poplar leaves were measured using a portable gas exchange system (LI-6800, LICOR Biosciences, Lincoln, NE, USA). Measurements were conducted on sunny days between 9:00 and 11:00 a.m. The conditions of the measurements were set as follows: temperature in the leaf chamber was 25 °C, light intensity was 1,800 μmol photon m−2·s−1 and CO2 concentration was 400 μmol·mol−1. Measurements were taken from three leaves per seedling, one each from the upper, middle, and lower layers. Each leaf was measured three times to obtain an average value. The photosynthetic parameters assessed include net photosynthetic rate (Pn, μmol·m−2·s−1), transpiration rate (Tr, mmol·m−2·s−1), intercellular CO2 concentration (Ci, μmol·mol−1) and stomatal conductance (Gs, mol·m−2·s−1).
The spectral reflectance of all leaves was measured using the PSR-3500 portable spectroradiometers which had a band range of 350−2,500 nm. The spectral resolution was 1 nm before 1,006 nm, and 3.5 nm after that. A leaf clip was used to measure the radiance on the leaf surface, which was attached to a plant probe with an artificial light source. The reflectance of each leaf was the leaf radiance divided by the radiance of a spectral panel in the leaf clip[20]. Leaf spectral reflectance and photosynthetic parameters were measured on the same leaves simultaneously.
Extracting leave spectral vegetation index and first-order derivative spectra
-
To reduce the noise in leaf reflectance and emphasize spectral characteristics, vegetation index, and first-order derivative spectra (FDS) were extracted from the leaf hyperspectral data. These were used for modeling and selecting important spectral features. In total, 14 vegetation indices were selected and calculated, as listed in Table 1. Normalized vegetation index (NDVI), ratio vegetation index (RVI), soil-adjusted vegetation index (SAVI), and enhanced vegetation index (EVI) were related to vegetation coverage and leaf structure. MERIS terrestrial chlorophyll index (MTCI), chlorophyll index (CI), chlorophyll index at green band (CIgreen), chlorophyll index at red band (CIred), Vogelmann red edge index (VOG), modified chlorophyll absorption ratio index (MCARI), red edge position (REP), and greenness index (GI) were related to high chlorophyll content. The photochemical reflectance index (PRI), and water index (WI) were related to radiation-use efficiency and leaf water content.
Table 1. Formula of vegetation index.
Vegetation index Formula Ref. NDVI $ \rm NDVI=(NIR-RED)/(NIR+RED) $ [28] RVI $ \rm RVI=NIR/RED $ [29] SAVI $ \rm SAVI=\dfrac{{NIR-RED}}{1.5\times(NIR+RED+0.5)} $ [30] MTCI $\rm MTCI=(NIR-REG)/(REG-RED) $ [31] EVI $\rm EVI=\dfrac{{2.5 \times (NIR-REG)}}{(1+NIR+2.4 \times RED)} $ [32] CI $ \rm CI=\left({{R}}_{{640}}-{{R}}_{{673}}\right)/{{R}}_{{673}} $ [33] CIgreen $\rm {{CI}}_{{green}}=NIR/Green-1 $ CIreg $ \rm {CI}_{{reg}}=NIR/REG-1 $ PRI $ \rm PRI={{(R}}_{{531}}-{{R}}_{{570}})/{{(R}}_{{531}}+{{R}}_{{570}}) $ [34] VOG $\rm VOG={{R}}_{{740}}/{{R}}_{{720}} $ [35] WI $ \rm WI={{R}}_{{900}}/{{R}}_{{970}} $ [36] MCARI $\begin{aligned}& \rm MCARI=[({{R}}_{{700}}-{{R}}_{{670}})-0.2 \;\times\\ &\rm ({{R}}_{{700}}-{{R}}_{{550}})]\times({{R}}_{{700}}/{{R}}_{{670}}) \end{aligned}$ [37] REP $ \rm REP=\dfrac{{700+40}\times \left[\left({{R}}_{{670}}+{{R}}_{{780}}\right)/2-{{R}}_{{700}}\right]}{{{R}}_{{740}}-{{R}}_{{700}}} $ [38] GI $ \rm GI={{R}}_{{554}}/{{R}}_{{667}} $ [39] NIR (780−800 nm) represents the near-infrared band, RED (660−680 nm) represents the red band, and REG (710−730 nm) represents the red edge band. FDS can capture the changing trend of the spectral curve at specific bands, effectively highlighting its characteristics. FDS across the full spectral range was calculated using the formula in Eqn (1).
$\rm {{D}}_{{i}}=({R}_{i\,-\,1}-{R}_{i\,+\,1})/({{ \lambda }}_{i\,-\,1}-{{ \lambda }}_{i\,+\,1}) $ (1) Where Di was the first-order derivation of the band i, R was spectral reflectance, and λ was the band interval.
To reduce data redundancy due to the high correlation between adjacent bands in hyperspectral data, subsampling of leaf reflectance and first-order derivatives were performed. One out of every five bands were retained in the range of 400−2,500 nm. The final spectral features for modeling included 125 original reflectance spectra, 125 first-order derivative spectra, and 14 vegetation indices.
Analysis of photosynthetic parameter difference and spectral difference of poplar varieties
-
The photosynthetic parameters and spectral features of different poplar genotypes were analyzed using one-way Analysis of Variance (ANOVA), with comparisons made among the leaves of the upper, middle, and lower layers respectively. Before ANOVA analysis, Bartlett's test was used to assess homogeneity of the variance. Multiple comparisons were performed using Fisher's Least Significant Difference (LSD) test, with p-values less than 0.05 considered significant. The variance analysis was conducted using the 'car' and 'agricolae' packages in R, and the results were mapped in MATLAB.
Correlation analysis of leaf photosynthesis and spectra
-
The Pearson correlation coefficient between the original spectral reflectance, FDS, and photosynthetic parameters were calculated and plotted for each wavelength. Pearson correlation coefficients were computed for all vegetation indices in relation to the photosynthetic parameters, and the results were visualized in heat maps. For each photosynthetic parameter, spectral features with strong correlation were identified, clarifying the relationship between photosynthesis and the spectral characteristics of different poplar genotypes. The analysis also revealed the spectral characteristics that could predict photosynthetic differences among the varieties.
Photosynthesis inversion model based on BP neural network
-
As a non-parametric model, a neural network is not limited by data distribution, while is more efficient than traditional regression when handling numerous variables and large sample sizes[40]. After removing three unnormal values, the modeling data contains 87 leaf samples. The training set and test set were divided into a ratio of 3:1 for model training and testing. The original reflectance, first order derivation, and vegetation index were used as input spectral characteristic variables. Four photosynthetic parameters, including Pn, Ci, Gs, and Tr, were taken as the target variables. The selection of spectral features was determined according to the Pearson correlation coefficient (r) between photosynthetic parameters and each spectral feature. In each type of spectral feature, the spectral features with stronger correlation were selected first. While ensuring the accuracy of the model, as few spectral features as possible were used, and combinations of spectral features of different classes were tried. After model training, the Coefficient of determination (R2) and Root Mean Square Error (RMSE) of the training set and test set were calculated to determine the optimal photosynthetic inversion model. Using a three-layer simple neural network, the empirical formula
$\rm m=\sqrt[{2}]{{a+b}} $ -
Significant differences in photosynthesis were observed among various poplar genotypes. The net photosynthetic rate (Pn) of leaves, from highest to lowest, were as follows: Populus tremula × P. alba, Populus davidiana × P. bolleana, Populus alba × P. glandulosa, triploid Populus tomentosa, Populus deltoides × P. euramericana, and Populus hopeiensis. Populus tremula × P. alba exhibited the highest photosynthetic performance (Pn = 9.46 μmol·m−2·s−1, Tr = 5.11 mmol·m−2·s−1, Ci = 333.64 μmol·mol−1, Gs = 0.34 mol·m−2·s−1) (Fig. 1). Leaf position had a clear influence on photosynthesis, with differences observed across poplar genotypes. In Populus tremula × P. alba, Populus hopeiensis, and Populus alba × P. glandulosa, the middle-layer leaves exhibited significantly higher Pn, Tr, and Ci values than the upper and lower layers (Supplementary Fig. S1). In the upper layer, Populus hopeiensis showed a significantly lower Pn compared to other poplar genotypes. In the middle layer, Pn and Gs of Populus tremula × P. alba were higher than in the other two genotypes, the photosynthetic parameters of triploid Populus tomentosa were the lowest. In the lower layer, significant differences were observed in all four photosynthetic parameters. Populus tremula × P. alba had the highest net photosynthetic rate (Pn = 6.30 μmol·m−2·s−1), whereas triploid Populus tomentosa had the lowest Tr (1.50 mmol·m2·s−1), Ci (1.49 μmol·mol−1), and Gs (0.06 mol·m2·s−1).
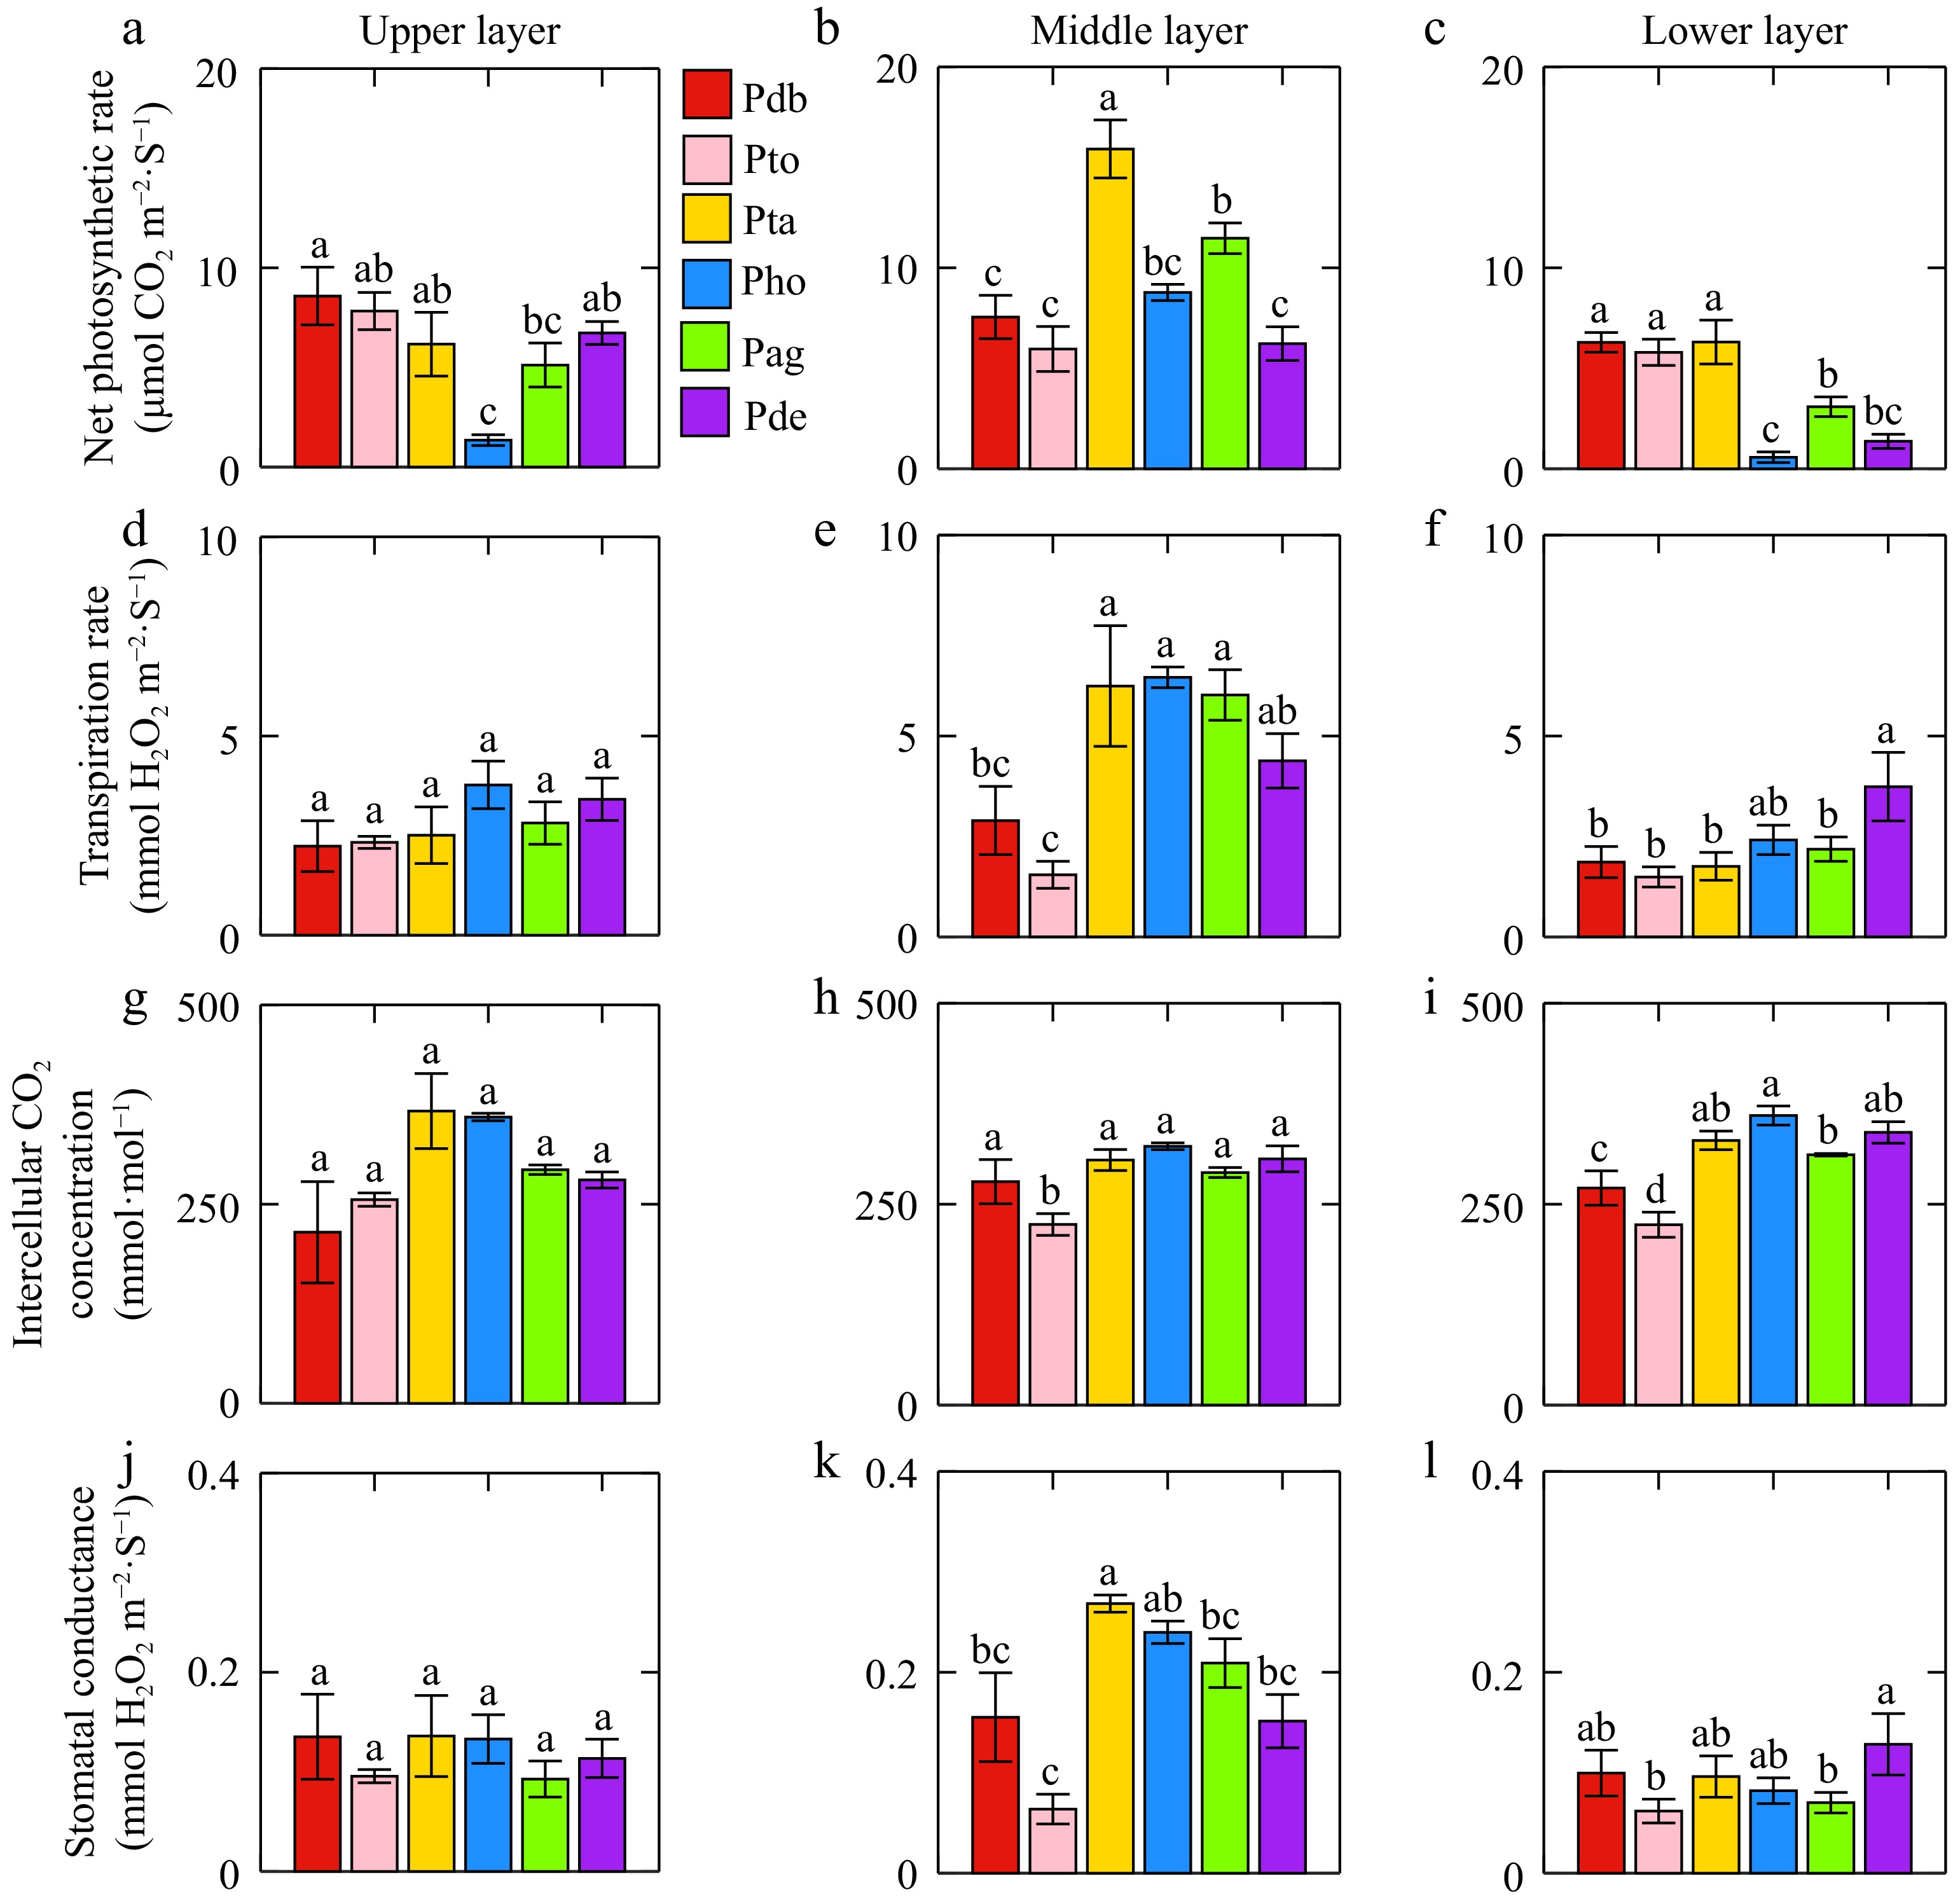
Figure 1.
(a)−(c) Differences in net photosynthetic rate, (d)−(f) transpiration rate, (g)−(i) intercellular CO2 concentration, and (j)−(l) stomatal conductance among different genotype of poplar leaves. Same letters in the figures indicate no significant difference and the error line was the standard error. Pdb, Pto, Pta, Pho, Pag, and Pde were Populus davidiana × P. bolleana, triploid Populus tomentosa, Populus tremula × P. alba, Populus hopeiensis, Populus alba × P. glandulosa, Populus deltoides × P. euramericana 'Nanlin895'.
Differences in leaf spectral reflectance among poplar genotypes
-
The spectral reflectance of different poplar genotypes varied significantly across the visible light range (400−760 nm), near-infrared (800−1,300 nm), short-wave infrared (1,500−1,800 nm and 1,900−2,000 nm) (Fig. 2). In the visible light region, the spectral reflectance, from highest to lowest, was as follows: Populus tremula × P. alba, Populus hopeiensis, Populus alba × P. glandulosa, Populus davidiana × P. bolleana, triploid Populus tomentosa, and Populus deltoides × P. euramericana. In the near-infrared region, spectral reflectance from high to low was: Populus tremula × P. alba, Populus deltoides × P. euramericana, Populus alba × P. glandulosa, Populus davidiana × P. bolleana, triploid Populus tomentosa, and Populus hopeiensis.
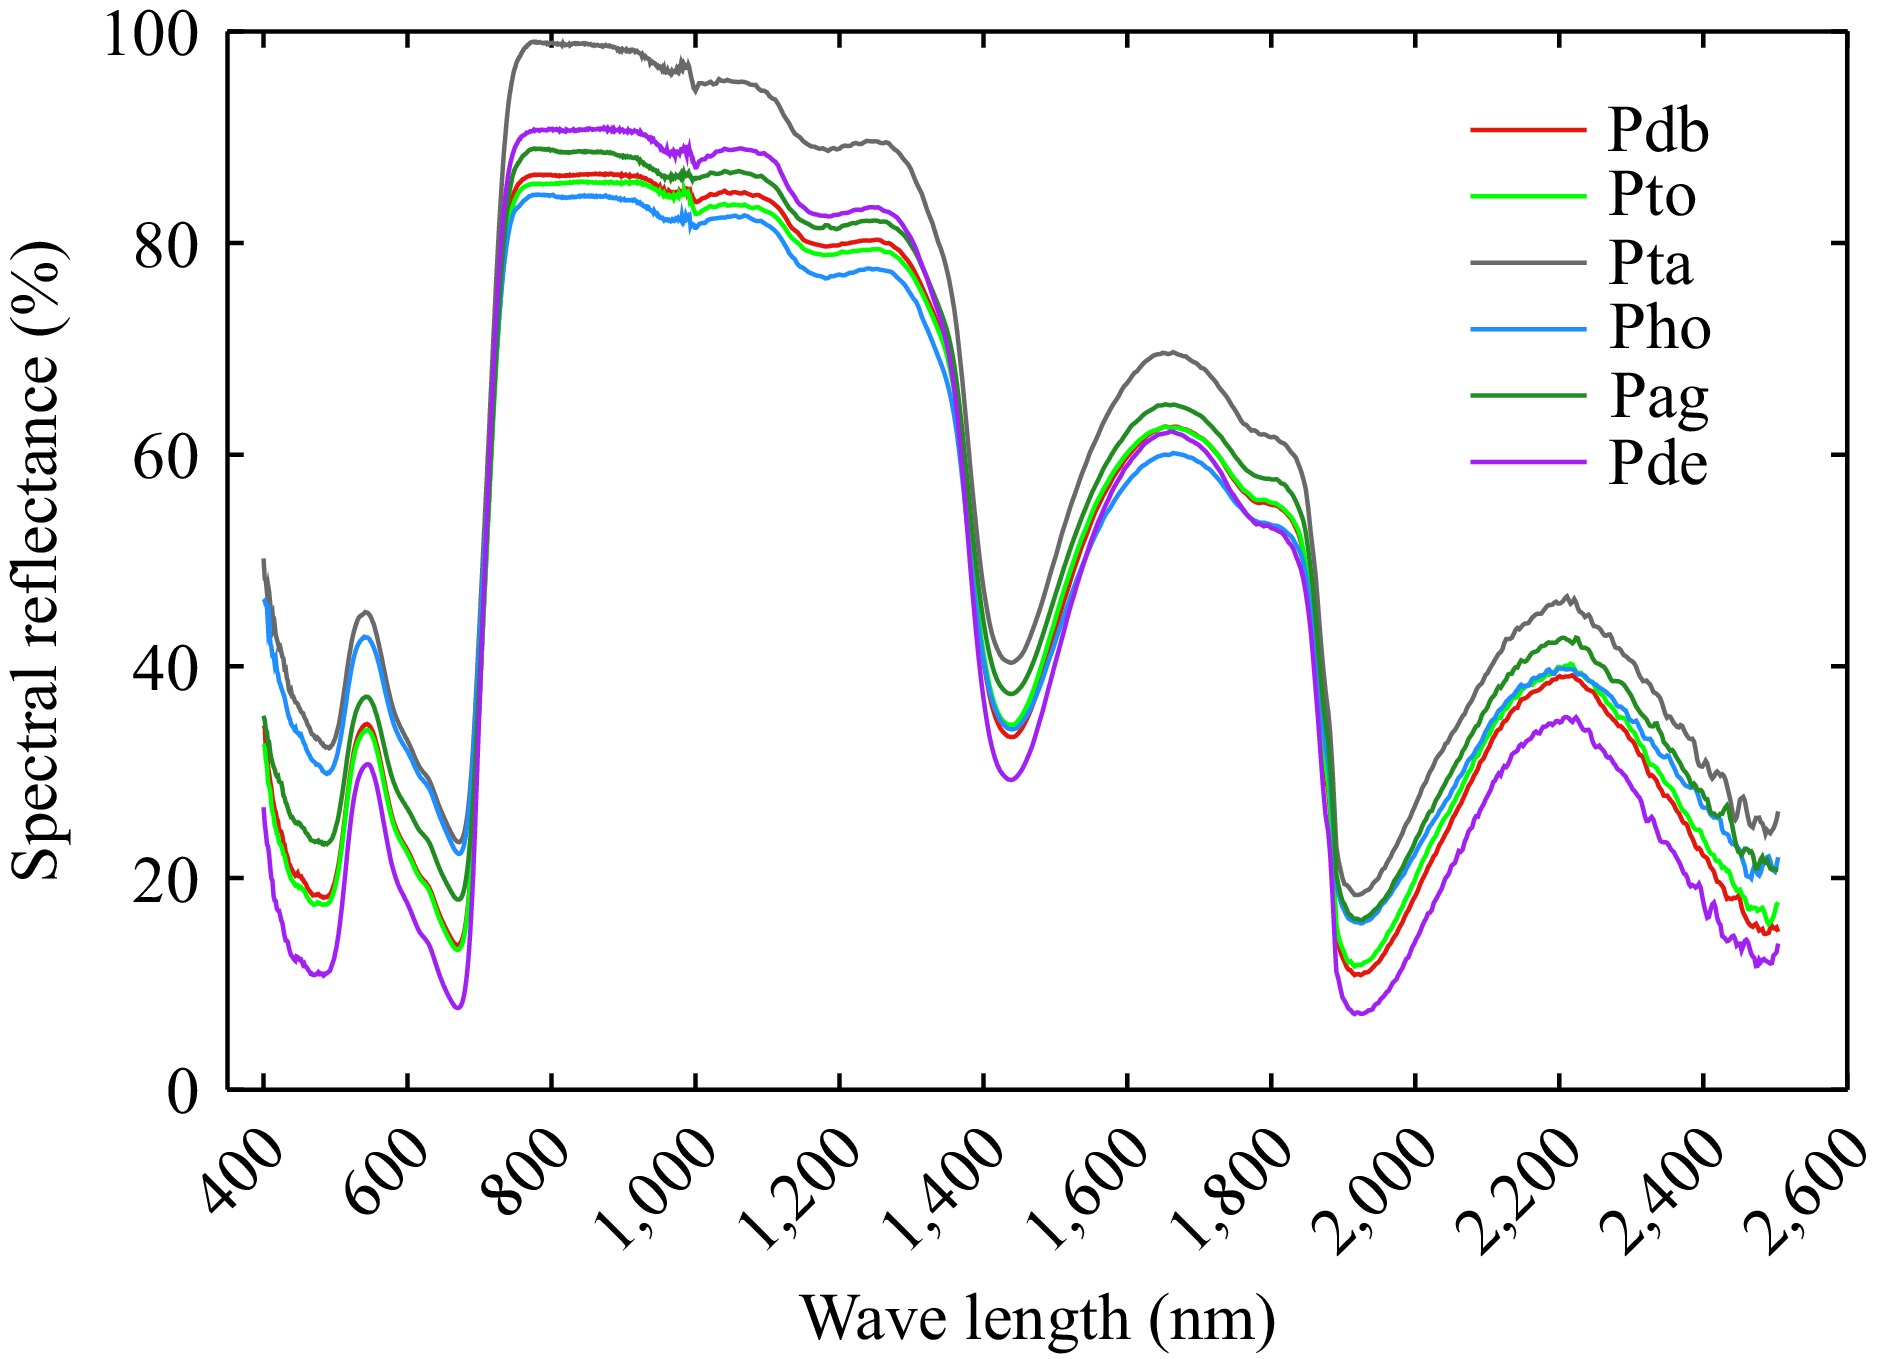
Figure 2.
Original leaf spectral reflectance from 400−2,500 nm of different poplar genotypes. Pdb, Pto, Pta, Pho, Pag, and Pde were Populus davidiana × P. bolleana, triploid Populus tomentosa, Populus tremula × P. alba, Populus hopeiensis, Populus alba × P. glandulosa, and Populus deltoides × P. euramericana 'Nanlin895'.
MTCI, WI, REP, PRI, and first-order derivative at 891 nm appeared more frequently in the four photosynthesis models (Table 2), and therefore were considered important spectral features related to photosynthesis. There were significant differences in the important spectral traits of poplar leaves among different genotypes (Fig. 3). In the upper leaf layer, Populus alba × P. glandulosa had the highest MTCI, while Populus hopeiensis had the lowest. WI was highest in Populus hopeiensis and lowest in Populus davidiana × P. bolleana. The highest PRI was observed in Populus deltoides × P. euramericana, whereas the lowest was in Populus hopeiensis. The first-order derivative at 891 nm was highest in Populus deltoides × P. euramericana and lowest in Populus tremula × P. alba. In the middle layer, MTCI was highest in Populus tremula × P. alba and the lowest in Populus deltoides × P. euramericana. WI was highest in Populus tremula × P. alba and lowest in triploid Populus tomentosa. REP was highest in Populus deltoides × P. euramericana and lowest in Populus hopeiensis. The first-order derivative at 891 nm was highest in triploid Populus tomentosa, and lowest in Populus tremula × P. alba. In the lower layer, MTCI was highest in Populus tremula × P. alba and lowest in Populus deltoides × P. euramericana. WI was highest in Populus deltoides × P. euramericana and lowest in triploid Populus tomentosa. REP was highest in Populus tremula × P. alba and lowest in Populus deltoides × P. euramericana. For PRI, Populus deltoides × P. euramericana had the highest value, while Populus hopeiensis had the lowest. The first-order derivation at 891 nm was highest in Populus davidiana × P. bolleana and the lowest in Populus tremula × P. alba.
Table 2. Selected variables in the optimal model of different photosynthetic parameters.
Photosynthetic parameters Selected feature Pn MTCI, REP, VOG, CIreg, MCARI, GI, CI, RVI, WI, PRI Ci WI, NDVI, SAVI, EVI, PRI, D826.8, D918.4, D1207.5, D907.6, D885.4 Gs MTCI, REP, GI, EVI, CI, D891, D978.5, D491.1, D1001, D550.1 Tr MTCI, WI, REP, VOG, CIreg, D891, D491.1, D826.8, D918.4, D978.5 D represents first-order derivation. 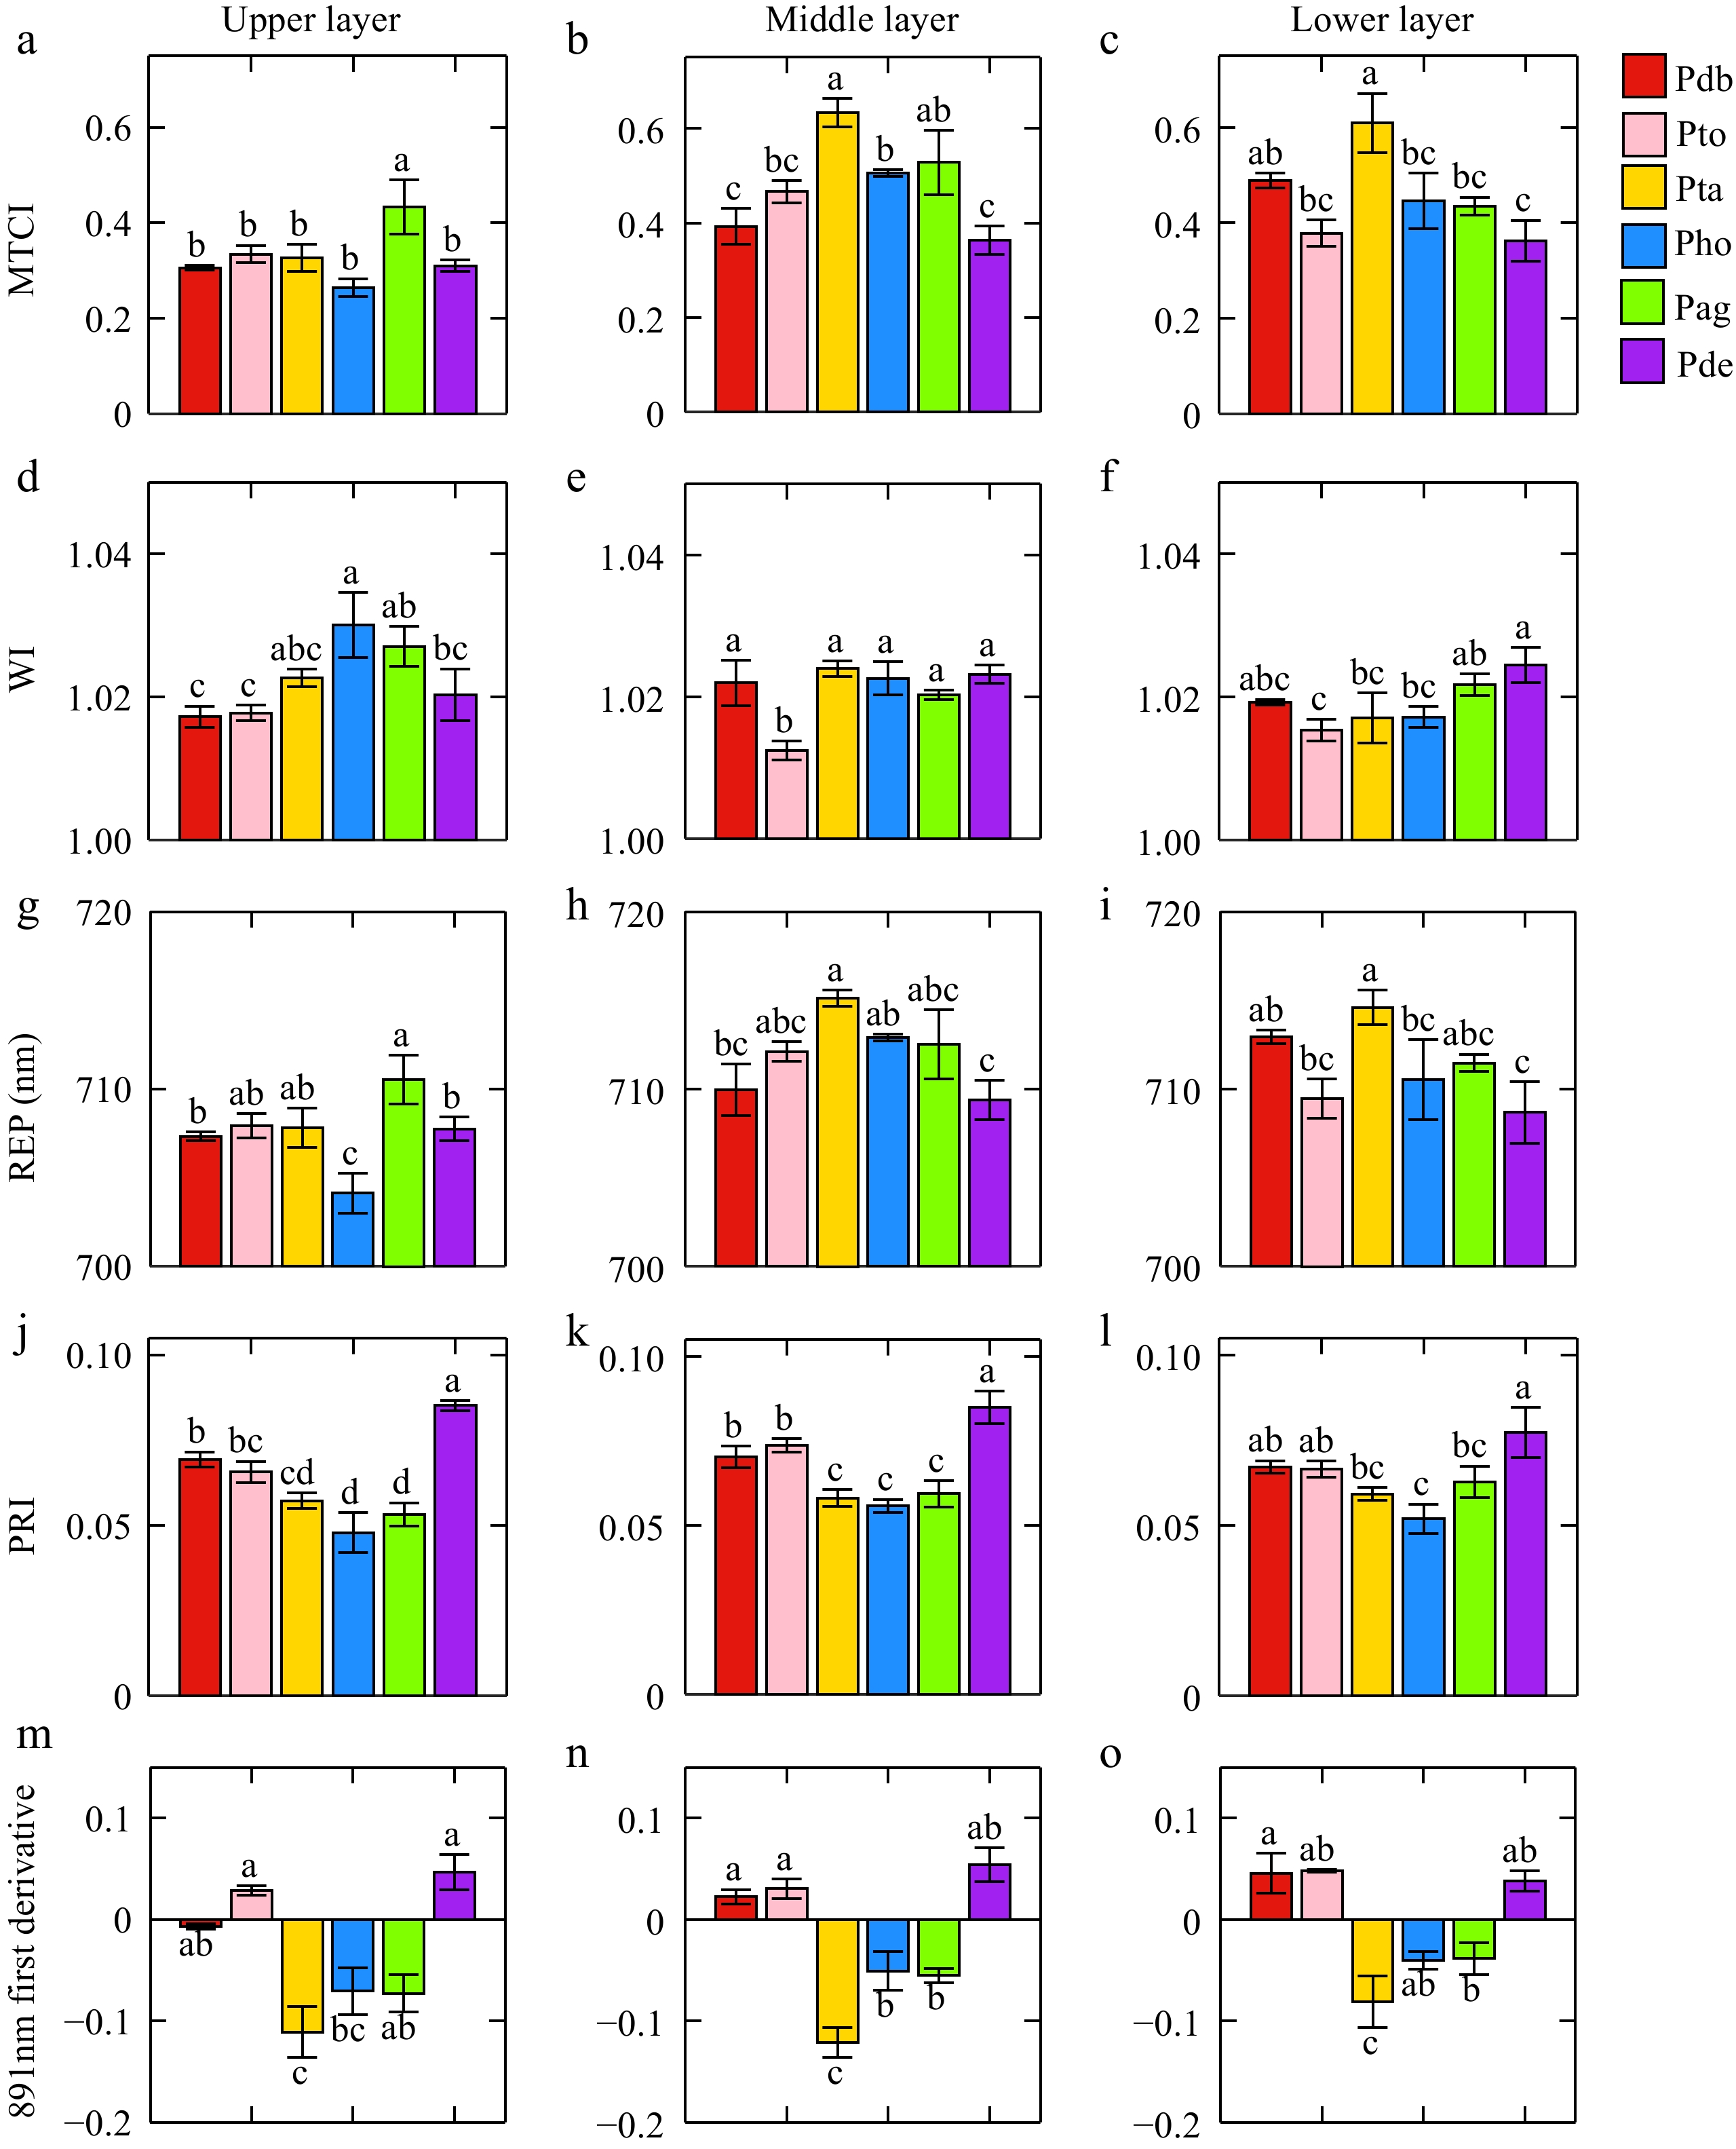
Figure 3.
Differences in leaf spectral features of different poplar genotypes. (a), (b), and (c) present the differences of MTCI in the upper, middle, and lower layers, respectively. (d), (e), and (f) indicate the differences of WI in the upper, middle, and lower layers. (g), (h), and (i) were the differences of REP in the upper, middle, and lower layers. (j), (k), and (l) indicate the differences of PRI in the upper, middle, and lower layers. (m), (n), and (o) indicate the differences of 891 nm first-derivation in the upper, middle, and lower layers.
It was found that the spectral differences between the poplar genotypes with the highest and lowest photosynthetic parameters were relatively stable (Fig. 3). By conducting pairwise comparisons of the poplar genotypes that exhibited the highest and lowest performance in each photosynthetic parameter (Supplementary Fig. S2), it was found that in the two-dimensional space of photosynthetic parameters and spectral features, the data points for the two genotypes in the mid-layer leaves are more spread out. Therefore, in the middle layer, leaf spectral features can more effectively reflect the differences in photosynthetic parameters.
Correlation of photosynthetic and spectral characteristics of poplar leaves among different genotypes
-
The correlation between the four photosynthetic parameters and leaf spectral reflectance ranged from −0.20 to 0.40. Leaf reflectance at 450, 670, 760, and 1,920 nm was highly correlated with the photosynthetic parameters. Pn exhibited a significant negative correlation with spectral reflectance at 710 nm, with an r-value of −0.15. Tr showed significant correlations with spectral reflectance at 450, 670, 760, and 1,920 nm across all bands. Additionally, the correlation trend between Ci and reflectance in the 700–1,800 nm range differed from that of the other parameters (Fig. 4a). Photosynthetic parameters and the first-order derivation of leave reflectance were highly correlated at 763, 491, 891, 936, 827, and 859 nm, with correlation coefficients ranging from −0.55 to 0.46 (Fig. 4b). Vegetation index also showed a strong correlation with photosynthetic parameters, with correlation values ranging from −0.28 to 0.42. MTCI and REP were the most closely associated with Pn, with correlation values of 0.42 and 0.37, respectively. WI had a strong relationship with Ci and the correlation coefficient was 0.32. MTCI and REP also showed relatively strong relationships with Gs and the correlation was 0.24 and 0.20, respectively (Fig. 5).
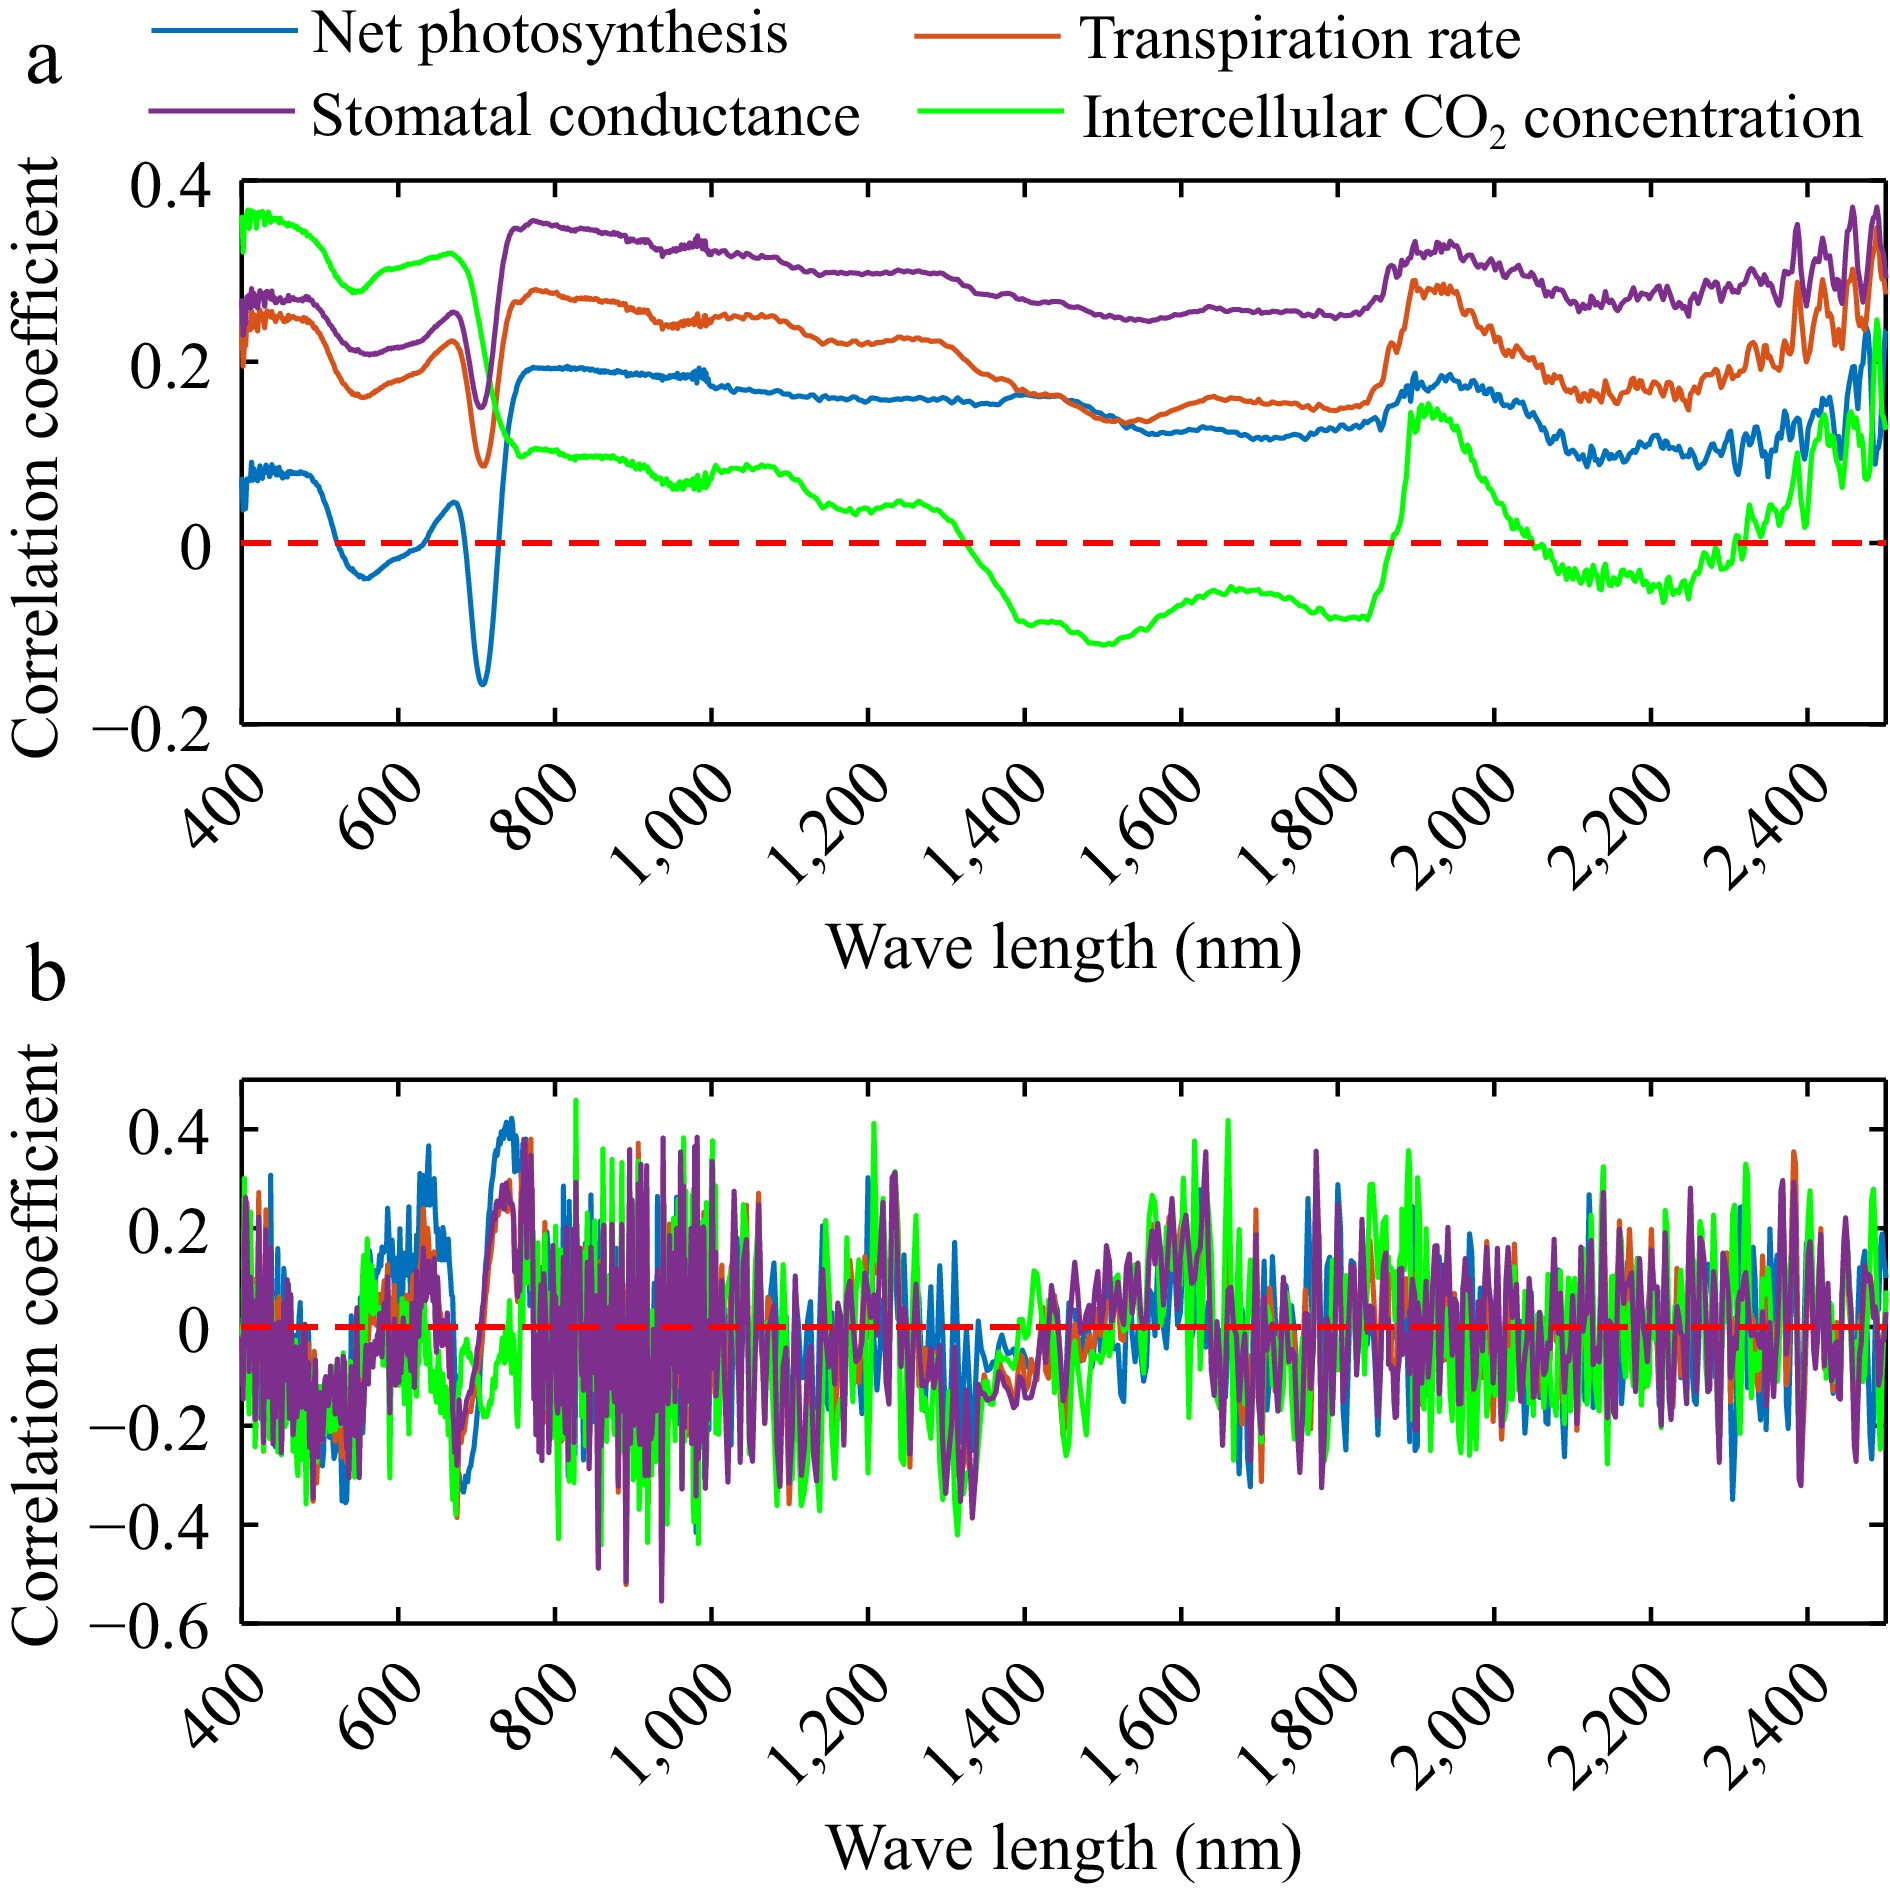
Figure 4.
Correlation between (a) reflectance, (b) first order derivation and photosynthetic parameters including net photosynthetic rate, transpiration rate, intercellular CO2 concentration, and stomatal conductance.
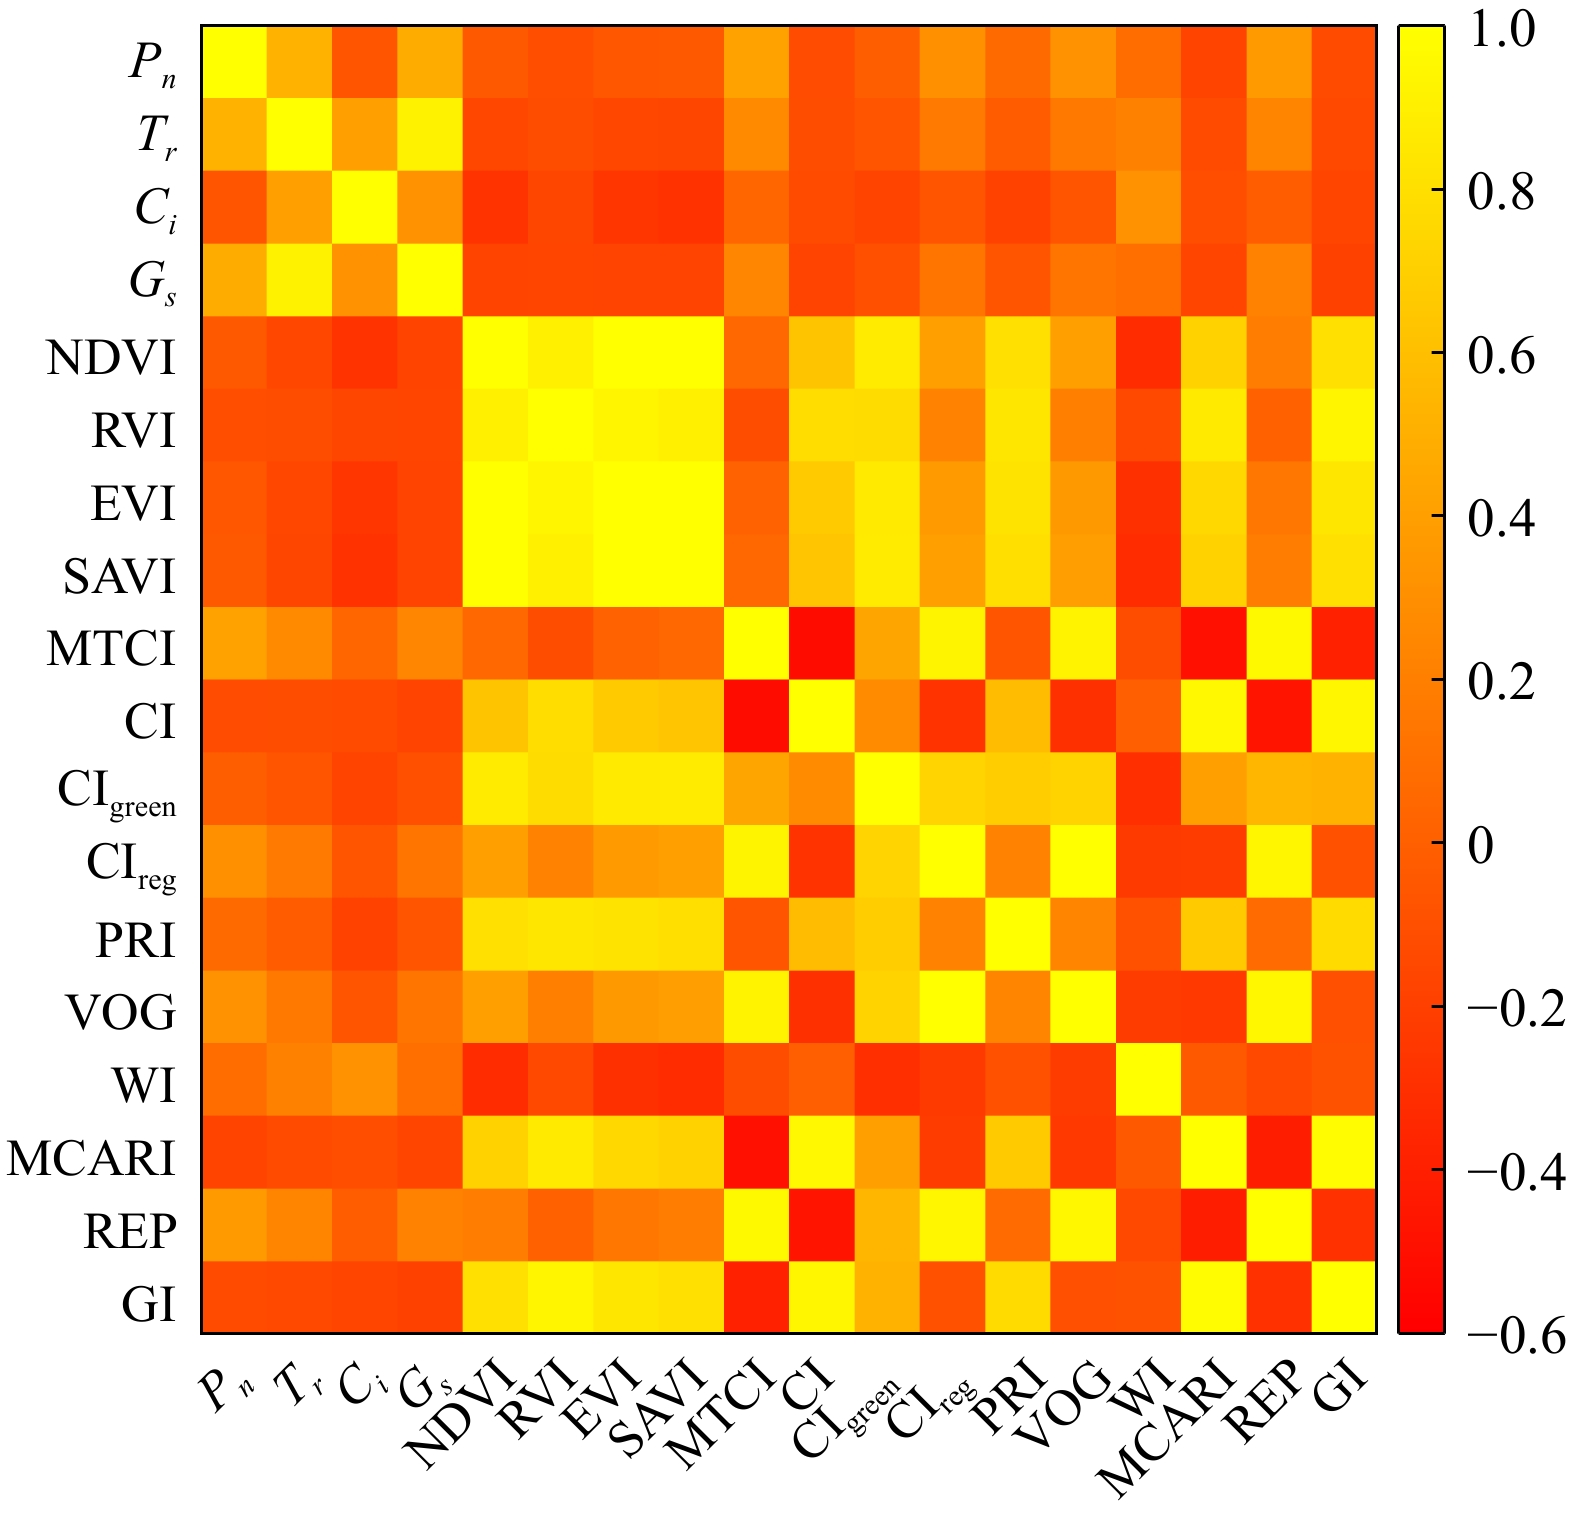
Figure 5.
Correlation between photosynthetic parameters and vegetation index.
Estimation of poplar photosynthetic parameters based on the vegetation index
-
The accuracy of the net photosynthetic rate was higher than that of the other three parameters, with R2 of 0.56 and RMSE of 2.37 μmol·m−2·s−1. R2 ranged from 0.35 to 0.44, with RMSE of 1.64 mmol·m−2·s−1, 38.64 μmol·mol−1, and 0.11 mol·m−2·s−1 for transpiration rate, intercellular CO2 concentration and stomatal conductance (Fig. 6). All metrics were calculated on the test set. The optimal parameters selected for estimating photosynthetic characteristics are listed in Table 1. Chlorophyll-related vegetation indices, such as MTCI, were more effective than other parameters. WI also performed well in estimating intercellular CO2 concentration and transpiration rate. PRI proved useful for modeling net photosynthetic rate and intercellular CO2 concentration. Most of the first-order derivatives selected for estimating poplar photosynthetic parameters were found in the 800−1,000 nm range.
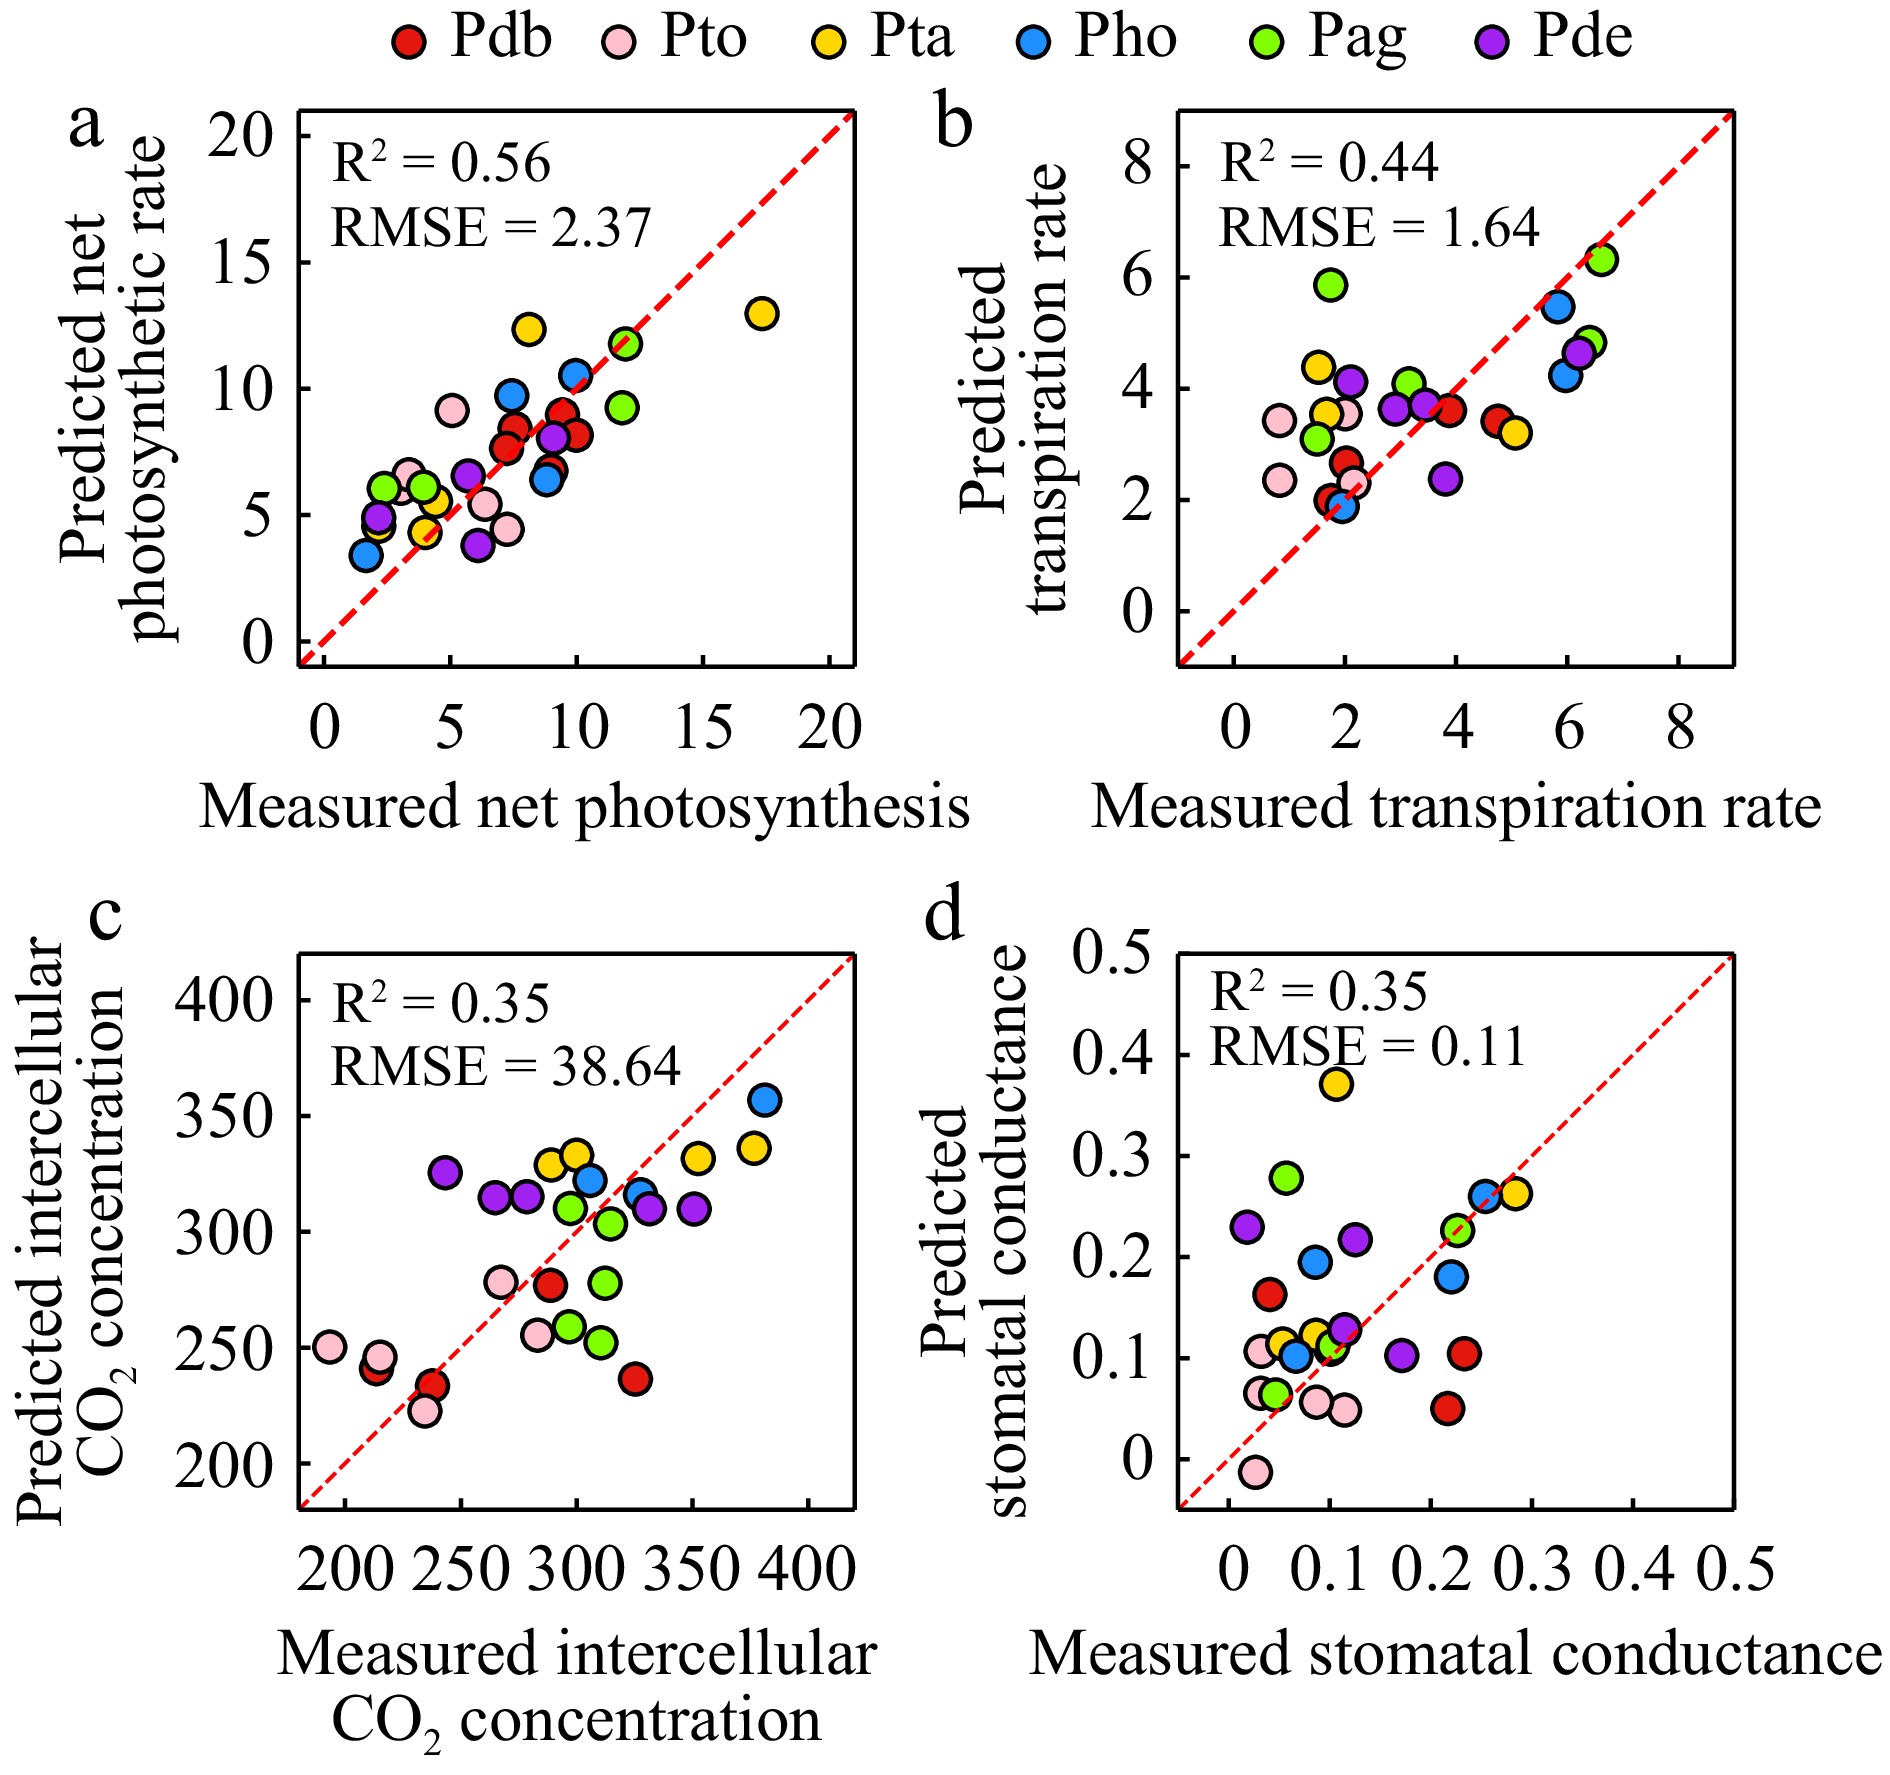
Figure 6.
Estimation of photosynthetic parameters including (a) net photosynthetic rate, (b) transpiration rate, (c) intercellular CO2 concentration, and (d) stomatal conductance.
-
This study compared the photosynthetic differences and spectral differences among poplar genotypes by measuring the photosynthetic factors and full-band leaf spectral reflectance. The BP neural network was employed to develop a photosynthetic parameter inversion model based on leaf hyperspectral data. Among the six genotypes, P. tremula × P. alba exhibited higher photosynthetic performance, while triploid P. tomentosa showed lower performance. As key substrates for photosynthesis, water and CO2 significantly influence the net photosynthetic rate of plants[42]. In the middle layer, P. tremula × P. alba showed a much higher transpiration rate and intercellular CO2 concentration compared to triploid P. tomentosa, indicating a stronger capacity to absorb water and CO2 under suitable external conditions. Increased stomatal conductance typically leads to higher transpiration and intercellular CO2 concentration[43], and the ability of stomata to remain open depends on the maintaining a stable water condition in the leaves[44]. The higher stomatal conductance of P. tremula × P. alba allowed for greater CO2 uptake from the air, enhancing transpiration, and promoting photosynthesis. However, the high transpiration rate of P. tremula × P. alba also suggests a larger water requirement[6], meaning its high photosynthetic performance relies on sufficient water availability.
The leaf layer affects the photosynthetic capability of different poplar genotypes. In the middle layer, the differences in photosynthetic parameters were more obvious compared to the upper and lower layers, and the differences among genotypes were relatively stable (Fig. 2). Light availability can cause variations in the photosynthetic capacity of leaves at different positions within a tree[45]. Lower-layer leaves compensate for reduced light by increasing leaf area, which enhances their photosynthetic capacity[46]. Differences in leaf development can also account for variations in photosynthesis at the seedling level, for mature leaves exhibiting stronger photosynthetic abilities than younger leaves. The stomatal conductance of middle-layer leaves are higher than that of upper-layer leaves. Wu et al.[47] suggest that the slower increase in stomatal conductance in young leaves, compared to their carbon assimilation capacity, limits photosynthesis and may explain the superior photosynthetic performance of middle-layer leaves. Middle-layer leaves are more mature than upper-layer leaves and receive more light than lower-layer leaves, which likely accounts for their more robust and stable photosynthetic activity.
The vegetation indices selected by the optimal model reflects different aspects of photosynthesis: chlorophyll content (MTCI), water content (WI), and radiation-use efficiency (PRI). The selected first-order derivation (891 nm) is located in the red edged region. In the middle layer with relatively stable photosynthetic differences, the photosynthetic features were the most different between P. tremula × P. alba and triploid P. tomentosa. MTCI and WI of P. tremula × P. alba were significantly higher than those of triploid P. tomentosa. The net photosynthetic rate and PRI of leaves from different parts of P. tremula × P. alba was significantly higher than those of P. hopeiensis, and the difference of net photosynthetic rate between the upper and lower leaves was the largest. The photosynthetic and spectral features of other poplar varieties did not show consistent differences. The above results show that only the varieties with great differences in photosynthetic performance can the spectral differences reflect the photosynthetic differences stably.
Previous studies have found that visible spectra are strongly related to chlorophyll content, while shortwave infrared is linked to nitrogen concentration[15], and water content[48]. Red edge position has shown strong correlations with Vcmax and Jmax[27]. Most vegetation indices are calculated using visible and near-infrared bands[49]. In the present study, the optimal spectral regions for estimating photosynthetic parameters were primarily located in the visible (450–700 nm), and near-infrared ranges (700–1,500 nm). Moreover, short-wave infrared (1,500–2,500 nm) also contains important information regarding vegetation physiological activities[50]. It was observed that photosynthetic factors had a high correlation with the original spectral reflectance and the first-order derivative spectra in the short-wave infrared region of 1,800–2,000 nm. However, the original spectral reflectance and the first-order derivative spectra of different varieties had greater differences in the visible and near-infrared regions (Fig. 3), which was consistent with the study on alpine deciduous forests. Based on the PLSR algorithm, Barnes et al.[51] found that the near-infrared band has a greater contribution than the shortwave infrared band to estimate the photosynthetic capacity of vegetation. Visible and near-infrared spectra are more sensitive to the photosynthetic differences between poplar varieties and improve the accuracy of the photosynthetic inversion model. The spectral traits sensitive to chlorophyll are the most prominent for the evaluation of photosynthetic performance, which is consistent with the previous study[51]and implies that leaf chlorophyll content may be the main factor leading photosynthetic variations across poplar genotypes and leaf positions under suitable environments.
Among the four photosynthetic parameters, inversion accuracy of net photosynthetic rate was the highest, which may be attributed to the net photosynthetic rate closely relating to the pigment content. Liu et al.[52] believed that the inversion of net photosynthetic rate without photosynthetically active radiation is not feasible. Zhou et al.[53] used hyperspectral data to invert the CO2 assimilation rate, stomatal conductance, and transpiration rate of lemon trees under drought stress, and found that the model based on random forest algorithm was optimal (0.88 < R2 < 0.92). In this study, the photosynthetic inversion model based on the BP neural network was found to have good accuracy (0.35 < R2 < 0.56).
-
The close relations between leaf optical features and photosynthetic process allows for effective evaluation of plant photosynthetic performance through hyperspectral data. This study found that Populus tremula × P. alba exhibited the highest photosynthetic rate among the six poplar genotypes evaluated. Additionally, critical spectral bands and vegetation indices were also identified to distinguish different poplar genotypes using non-destructive and rapid measurements of leaf hyperspectral reflectance. Moreover, the photosynthetic parameters including Pn, Tr, Ci, and Gs, with R2 of 0.56, 0.44, 0.35, and 0.35, were estimated respectively. Therefore, hyperspectral data effectively distinguish between different poplar genotypes and estimate photosynthetic parameters, highlighting its great potential for studying plant phenomics.
This work was supported by the National Natural Fund Projects (Grant No. 31901963) and a project supported by the Fundamental Research Funds for the Central University (Grant No. 2662020YLPY020).
-
The authors confirm contribution to the paper as follows: data analysis and manuscript writing: Li Y; determining photosynthetic factors and leaf hyperspectral reflectance: Li D, Ruan S, Hu Q; writing the code and building model for estimating photosynthetic factors: Liu J; manuscript revision and English polishing: Dian Y; proposing ideas, experiments design and manucript revision: Yu Z, Zhou J. All authors reviewed the results and approved the final version of the manuscript.
-
The datasets generated during and/or analyzed during the current study are available from the corresponding author on reasonable request.
-
The authors declare that they have no conflict of interest.
- Supplementary Table S1 Height and ground diameter of various poplar genotypes.
- Supplementary Fig. S1 Effects of leaves’ layer on the net photosynthetic rate (a), transpiration rate (b), intercellular CO2 concentration (c), and stomatal conductance (d) of six poplar genotypes. The same letter in this figure indicated no significant difference and error line was the standard error.
- Supplementary Fig. S2 Differences in photosynthetic parameters and important spectral features among poplar genotypes with the highest and lowest net photosynthetic rate (a), transpiration rate (b), intercellular CO2 concentration (c), and stomatal conductance (d).
- Copyright: © 2024 by the author(s). Published by Maximum Academic Press, Fayetteville, GA. This article is an open access article distributed under Creative Commons Attribution License (CC BY 4.0), visit https://creativecommons.org/licenses/by/4.0/.
-
About this article
Cite this article
Li Y, Ruan S, Li D, Liu J, Hu Q, et al. 2024. Photosynthetic difference of six poplar genotypes and estimation of photosynthetic capacities based on leaf hyperspectral reflectance. Forestry Research 4: e037 doi: 10.48130/forres-0024-0034 

Photosynthetic difference of six poplar genotypes and estimation of photosynthetic capacities based on leaf hyperspectral reflectance
- Received: 28 June 2024
- Revised: 01 November 2024
- Accepted: 04 November 2024
- Published online: 21 November 2024
Abstract: Effectively evaluating and estimating the photosynthetic capacities of different poplar genotypes is essential for selecting and breeding poplars with high productivity. This study measured leaf hyperspectral reflectance, net photosynthetic rate (Pn), transpiration rate (Tr), intercellular CO2 concentration (Ci), and stomatal conductance (Gs) across the upper-, middle- and lower-layer leaves of six poplar genotypes. Photosynthetic capacities and spectral differences were assessed among these genotypes. By analyzing the correlation of photosynthetic parameters and spectral characteristics, the photosynthetic parameters were also estimated from hyperspectral parameters using BP neural networks. Significant differences were observed in the photosynthetic parameters among six poplar genotypes. Populus tremula × P. alba exhibited the highest photosynthetic rate, while Populus hopeiensis showed the lowest. Leaves in the middle layer demonstrated greater photosynthetic capacities than those in the other layers. Leaf reflectance among the six poplar genotypes differed significantly in the ranges of 400−760 nm, 800−1,300 nm, 1,500−1,800 nm, and 1,900−2,000 nm. Values for MTCI, WI, REP, PRI, and first-order derivative at 891 nm also showed significant differences. Hyperspectral parameters, including first-order derivative spectra (FDS), raw spectral reflectance, and photosynthetic parameters, showed strong correlations in the red light (670 nm), near-infrared (760−940 nm), and short-wave infrared (1,800−2,500 nm). Four photosynthetic parameters including Pn, Tr, Ci, and Gs were estimated using BP neural network models and R2 were 0.56, 0.44, 0.35, and 0.35, respectively. The present results indicate that hyperspectral reflectance can effectively distinguish between different poplar genotypes and estimate photosynthetic parameters, highlighting its great potential for studying plant phenomics.
-
Key words:
- Photosynthesis /
- Hyperspectral reflectance /
- Poplar genotypes /
- BP neural network