-
As one of the important components of the ecosystem, soil is not only the most basic carrier in agricultural production but also the ultimate destination of environmental pollutants (Zhang et al., 2020a; Gil et al., 2018). In recent years, various heavy metals have entered soil through different processes (e.g., industry, agriculture, transportation, and other ways) with the rapid development of the social economy, which exhibits a significant impact on human health and ecological security (Muhammad et al., 2021). According to the National Soil Pollution Survey Bulletin, cadmium (Cd) was the primary pollutant in cultivated soil in China. The continuous transport and accumulation of Cd in soil not only affects the soil ecological environment but also seriously threatens human health through the food chain, and other ways (Sun et al., 2021; Shen et al., 2016; Gong et al., 2021). Therefore, soil remediation and control of heavy metal pollution have always been the focus of soil environmental research. It is an economical, feasible, and effective method to control heavy metal pollution in soil by using improvers to adsorb and fix heavy metal elements and reduce heavy metal transport (Qiao et al., 2017; Yang T et al., 2022).
Iron-modified biochar, as an efficient and environmentally-friendly amendment has been widely used in soil remediation and control due to its advantages of low environmental risk, wide range of sources, and low price (Nguyen et al., 2023; Wan et al., 2020; Zhang et al., 2023; Jiao et al., 2022). Iron-modified biochar produced by high-temperature pyrolysis had developed pore structure and stable chemical properties. In addition, due to the complex reduction of Fe3+, the surface functional groups of biochar increased, and the adsorption capacity of biochar for heavy metals was significantly improved (Zhou et al., 2018; Yang et al., 2021; Ryu et al., 2011; He et al., 2018). At present, there is increasing research on the adsorption capacity and mechanism of soil-heavy metals by modified biochar. For example, Zhou et al. (2022) studied the high removal of Cr6+ in iron-modified biochar/double-layer osmotic reaction barriers. Da et al. (2023) reported a decrease of Cd2+ availability in soil using K2FeO4-modified vinasse biochar due to the enrichment of surface functional groups. Li et al. (2022) demonstrated that the simultaneous immobilization mechanism of As3+, Pb2+, and Cd2+ with Mg-Al modified biochar/mining soil composites.
The solute transport model is an important means by which to study the transport process of heavy metals in soil and estimate the transport parameters accurately (Pei et al., 2021). With the deepening of the research on the transport process of heavy metals in soil, the research on the solute transport models have gradually attracted the attention of experts and scholars (Wang et al., 2020; Yuan et al., 2017; Yang et al., 2019; Jiang et al., 2019). Some researchers used chloridion (Cl−) as a tracer ion and numerical models were used to predict the transport behavior of ions in the soil, such as copper, lead, zinc, and Cd (Pietrzak, 2021; Zhang et al., 2020b; Nguyen Ngoc et al., 2009). Anaman et al. (2022) used GIS and PMF methods found that the transport paths of As3+, Cd2+, Pb2+, Cu2+, and Zn2+ were mainly through surface runoff. Liu et al. (2022) found that the breakthrough curve (BTC) of Cd2+ was roughly of a slow 'S' type through simulation, and the simulated value of Cd2+ by the convection ediffusion equation (CDE) was close to the measured value. Zhou et al. (2009) found that BTC was accurately described by both the CDE equation and the two-zone model (TRM). However, the TRM model fitted the experimental data a little better than the CDE equation, which was possibly more convenient to use. In summary, there are increasingly more studies on the adsorption and transport of heavy metals in soil, but there are few studies on the effect of iron-modified biochar on the transport of heavy metals in soil, and its transport model and parameters were especially unclear.
The objectives of this study were: (1) to investigate the effect of iron-modified biochar on the transport of Cl− and Cd2+ in loessial soil by column experiments; and (2) to simulate the transport process and obtain relevant parameters of Cl− and Cd2+ in loessial soil added iron-modified biochar using CDE equation and TRM model. The results could clarify the effects of different amounts of iron-modified biochar on heavy metals transport in loessial soil, and provide data reference for the prevention and treatment of heavy metal pollution in soil.
-
The geographical location of the sampling point is Wangwa Town of Ningxia Province in China (106°37'20" ~ 106°39'25" E, 36°04'40" ~ 36°08'10" N), with an area of about 9.74 km2. The terrain is complex, with crisscrossed terraces, beams, ridges, valleys, and gullies, and the elevation ranges from 1,698 to 1,903 m. It belongs to the semi-humid and semi-arid climate, with an average annual temperature of 7.1 °C, a daily temperature difference of 27 °C, and an average annual precipitation of about 400 mm. The spatial and temporal distribution of evaporation is uneven, mainly from July to September, and the average annual evaporation is about 1,000 mm. The main soil type is loessial soil, with clay contents of 8.78%, sand content of 17.88%, and silt content of 71.63%. The physical and chemical properties of loessial soil are shown in Table 1. The soil layer is deep and the soil is loose. The sampling depth was 0~10 cm, and five soil samples were obtained by the quince-shaped distribution method during sampling, which were fully mixed and then sampled by the quartering method. The collected soil samples were naturally air-dried and debris removed, and then ground and passed through a 2 mm soil sieve for use.
Table 1. The physical and chemical properties of loessial soil.
Category Organic matter
(g·kg−1)Total nitrogen
(g·kg−1)pH Electrical conductivity
(uS·cm−1)Total potassium
(g·kg−1)Total phosphorus
(g·kg−1)Bulk density
(g·cm−3)Loessial soil 11.11 1.02 8.33 112.36 7.51 0.04 1.43 Preparation of iron-modified biochar
-
The woody biochar was purchased from Yixin Biotechnology Co. Ltd. (Table 1). Firstly, the woody biochar was pre-treated with mixed solution of FeSO4·7H2O and Fe2(SO4)3 under vigorous stirring (800 mL deionized water was added to a 1 L beamer, then 5.0 g FeSO4·7H2O and 4.5 g Fe2(SO4)3 were dissolved to obtain the mixed solution). After that, an even mixture was obtained by ultrasonic treatment for 1 h at 25 °C and was dried at 60 °C in a constant temperature oven. Finally, iron-modified biochar was obtained by pyrolysis in a Muffle furnace at 600 °C for 1 h. The as-prepared iron-modified biochar was ground and sieved for use (Gong et al., 2021). The physical and chemical properties of iron-modified biochar were shown in Table 2.
Table 2. The physical and chemical properties of iron-modified biochar.
Category Total carbon (%) Carbonization time (h) Carbonization temperature (°C) pH Ash content Pore size (> 2 mm) Fe Iron-modified biochar 55.63 1 600 7 22.86% 98.55% 23.02% Solute transport test
-
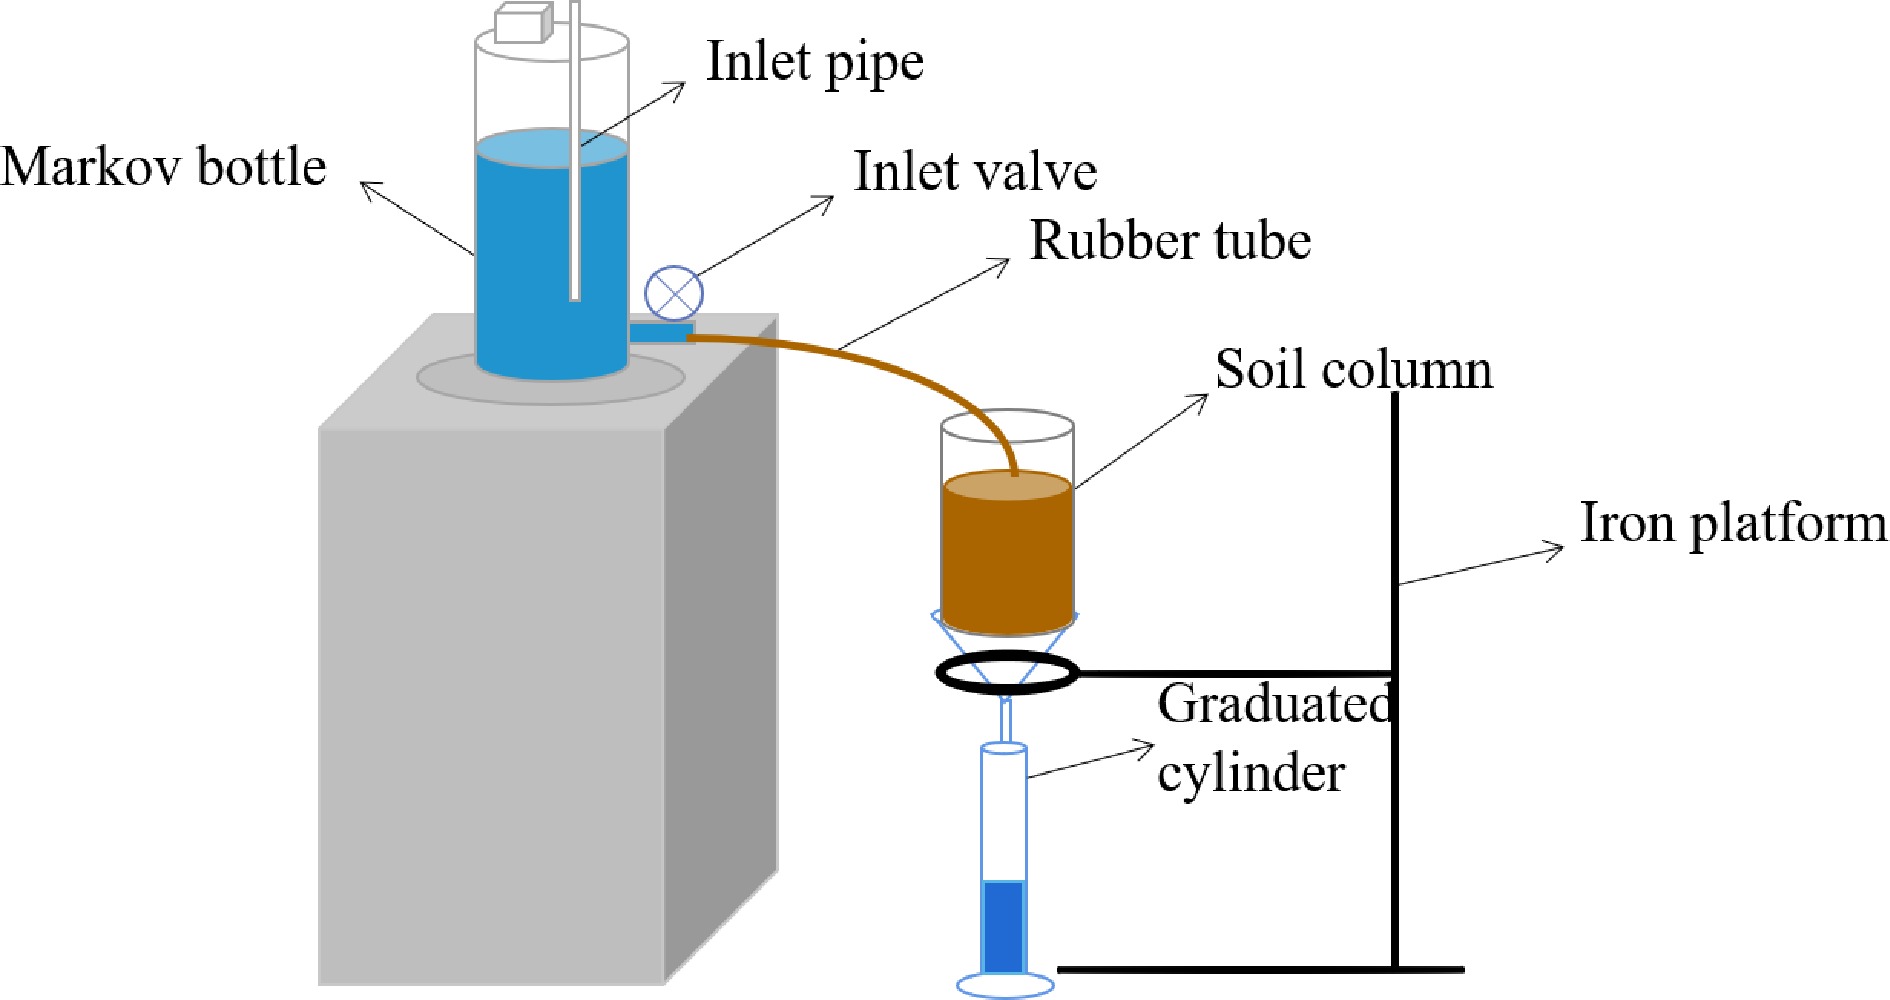
The soil samples with different mass ratios of iron-modified biochar (0, 1%, 2%, 3%, 4%, and 5% as CK, T1, T2, T3, T4, and T5, respectively) were obtained by evenly mixing iron-modified biochar and soil (Liu et al., 2015). The solute transport experiments were conducted under plexiglass-columns (diameter of 5 cm and height of 20 cm, Fig. 1). The layer of filter paper was placed at the bottom of the plexiglass column to prevent the loading of uneven soil caused by soil particle leakage and blockage of the outflow hole. Each sample was filled in a plexiglass column with a thickness of 5 cm per layer and a total height of 15 cm. The roughening was trimmed between layers to make the soil of each layer fully contact and fill more evenly (the bulk weight of the soil sample: 1.43 g·cm−3). The upper and lower end of the soil column were a water supply outlet and a solution outlet composed of porous glass, respectively. The filter paper on the top soil surface of the soil column prevented the water supply from damaging the upper soil structure. In the test, a constant water head was maintained at 3 cm using a Markov bottle containing 0.1 mg·L−1 NaCl solution. When the soil column was completely saturated by NaCl solution, the water supply of the soil column was removed, and the surface water of the soil column was immediately sucked up. Then the NaCl solution was replaced with 15 mg·L−1 Cd(NO3)2 to remain water head at 3 cm (Liu et al., 2022). At the same time, a measuring cylinder of 25 mL was used to catch the leaching solution from the bottom end of the soil column, and the leaching solution was dumped once the cylinder was filled, and the time spent was recorded to calculate soil saturated hydraulic conductivity. The concentration of Cd2+ in the leaching solution was determined by ultraviolet spectrophotometry with Xylenol Orange disodium salt as a chromogenic agent and hexamethylenetetramine as buffer solution at 578 nm wavelength. The solute transport test was considered to be over when the differences of three consecutive Cd2+ concentrations were less than 1%. The solute transport parameters were calculated based on the experimental data. Finally, Cl− content was determined by titration and Cd2+ content was determined by ultraviolet spectrophotometry.
Calculation of Ks
-
As one of the important soil hydraulics parameters, soil-saturated hydraulic conductivity (Ks, cm·min−1) refers to the water flux passing through saturated soil under a unit water potential gradient, which is a comprehensive reflection of soil texture, bulk density, pore distribution characteristics, and solute transport (Zhu et al., 2022). Ks can be calculated as Eqn (1):
$ Ks = Q \times L/A \times H \times t $ (1) where, Q (mL) and L (cm) are the flow rate and the height of soil column, respectively; A (cm2), H (cm) and t (min) represent the cross-sectional area of the water flow, the total head difference of the seepage path and the transport time, respectively.
Solute transport model
-
BTC characterizes the relationship between the relative concentration of liquid flow and the change of pore volume (Mahapatra et al., 2023), which can reflect the characteristics of solute mixed displacement transport in soil (Pei et al., 2021). BTC is one of the important ways to investigate the mechanism of solute transport in soil. In this study, Cl− and Cd2+ were used as the tracer ions to investigate solute transport in saturated soil under one-dimensional steady water flow. The solute transport parameters were input into STANMOD software with the CXTFIT program nested.
The one-dimensional saturation CDE equation can be expressed as Eqn (2):
$ R\dfrac{{\partial c}}{{\partial t}} = D\dfrac{{{\partial ^2}c}}{{\partial {x^2}}} - V\dfrac{{\partial c}}{{\partial x}} $ (2) where, c (mg·L−1) and t (h) are solute concentration and time, respectively; D (cm2·h−1) represents the dispersion coefficient, including diffusion and hydrodynamic dispersion; v (cm·h−1), R and x (cm, x ≥ 0) stand for soil pore velocity, retardation coefficient and the distance of solute transport, respectively.
TRM model under the condition of steady flow can be described as Eqns (3)−(6):
$ {\theta _m}\dfrac{{\partial {C_m}}}{{\partial t}} + {\theta _{im}}\dfrac{{\partial {C_{im}}}}{{\partial t}} = {\theta _m}D\dfrac{{{\partial ^2}{C_m}}}{{\partial {x^2}}} - {V_m}{\theta _m}\dfrac{{\partial {C_m}}}{{\partial x}} $ (3) $ {\theta _m}\dfrac{{\partial {C_m}}}{{\partial t}} = \omega ({C_m} - {C_{im}}) $ (4) $ \theta = {\theta _m} + {\theta _{im}} $ (5) $ \beta = {\theta _m}/\theta $ (6) where, θ represents soil volumetric water content, cm3·cm−3; θm and θim represent the volumetric water content in the movable and immovable regions, respectively. Cm and Cim (μg·ml−1) represent solute concentrations in mobile and immobile regions, respectively. Vm (cm·h−1), ω (1 h−1) and β represent the average pore velocity in the mobile zone; the mass exchange coefficient between the two zones and the ratio of water content in the mobile area, respectively. The dispersion capacity of the solute in the pore medium can be described by dispersion (λ), which is related to the average particle size and uniformity of the pore medium. Thus, λ can be calculated as Eqn. (7):
$ \lambda = \dfrac{D}{V} $ (7) where, D (cm2·h−1) and v (cm·h−1) represent the hydrodynamic dispersion coefficient and average interstitial water velocity, respectively.
Data processing and analysis
-
The transport of Cl− and Cd2+ in loessial soil by adding iron-modified biochar was simulated using CDE and TRM models with the aid of the CXTFIT program. Then the parameters (i.e., v, D, determination coefficient R2 and root mean square error RMSE) were obtained. SPSS 22.0 software was used for difference analysis and statistical test.
-
The as-prepared iron-modified biochar was characterized by Fourier transform infrared spectroscopy (FT-IR) analysis. FT-IR spectra of biochar (BC), iron-modified biochar (FeBC) before and after reaction are shown in Fig. 2. The characteristic peaks of BC at 3,396 cm−1 corresponded to the stretching vibration of the OH group (Zhao et al., 2013). The presence of the Fe-O/OH group at 500~1,640 cm−1 indicated the successful loading of Fe on the surface of FeBC (Zhu et al., 2020; Gotić et al., 2007; Zhang et al., 2020c). The characteristic peak of FeBC at 1,533 cm−1 (C=O/C=C group) was weaker than that of BC (Zhang et al., 2009), suggesting that the loading of Fe was realized by reacting with the C=O functional groups on the BC surface (Xu et al., 2012).
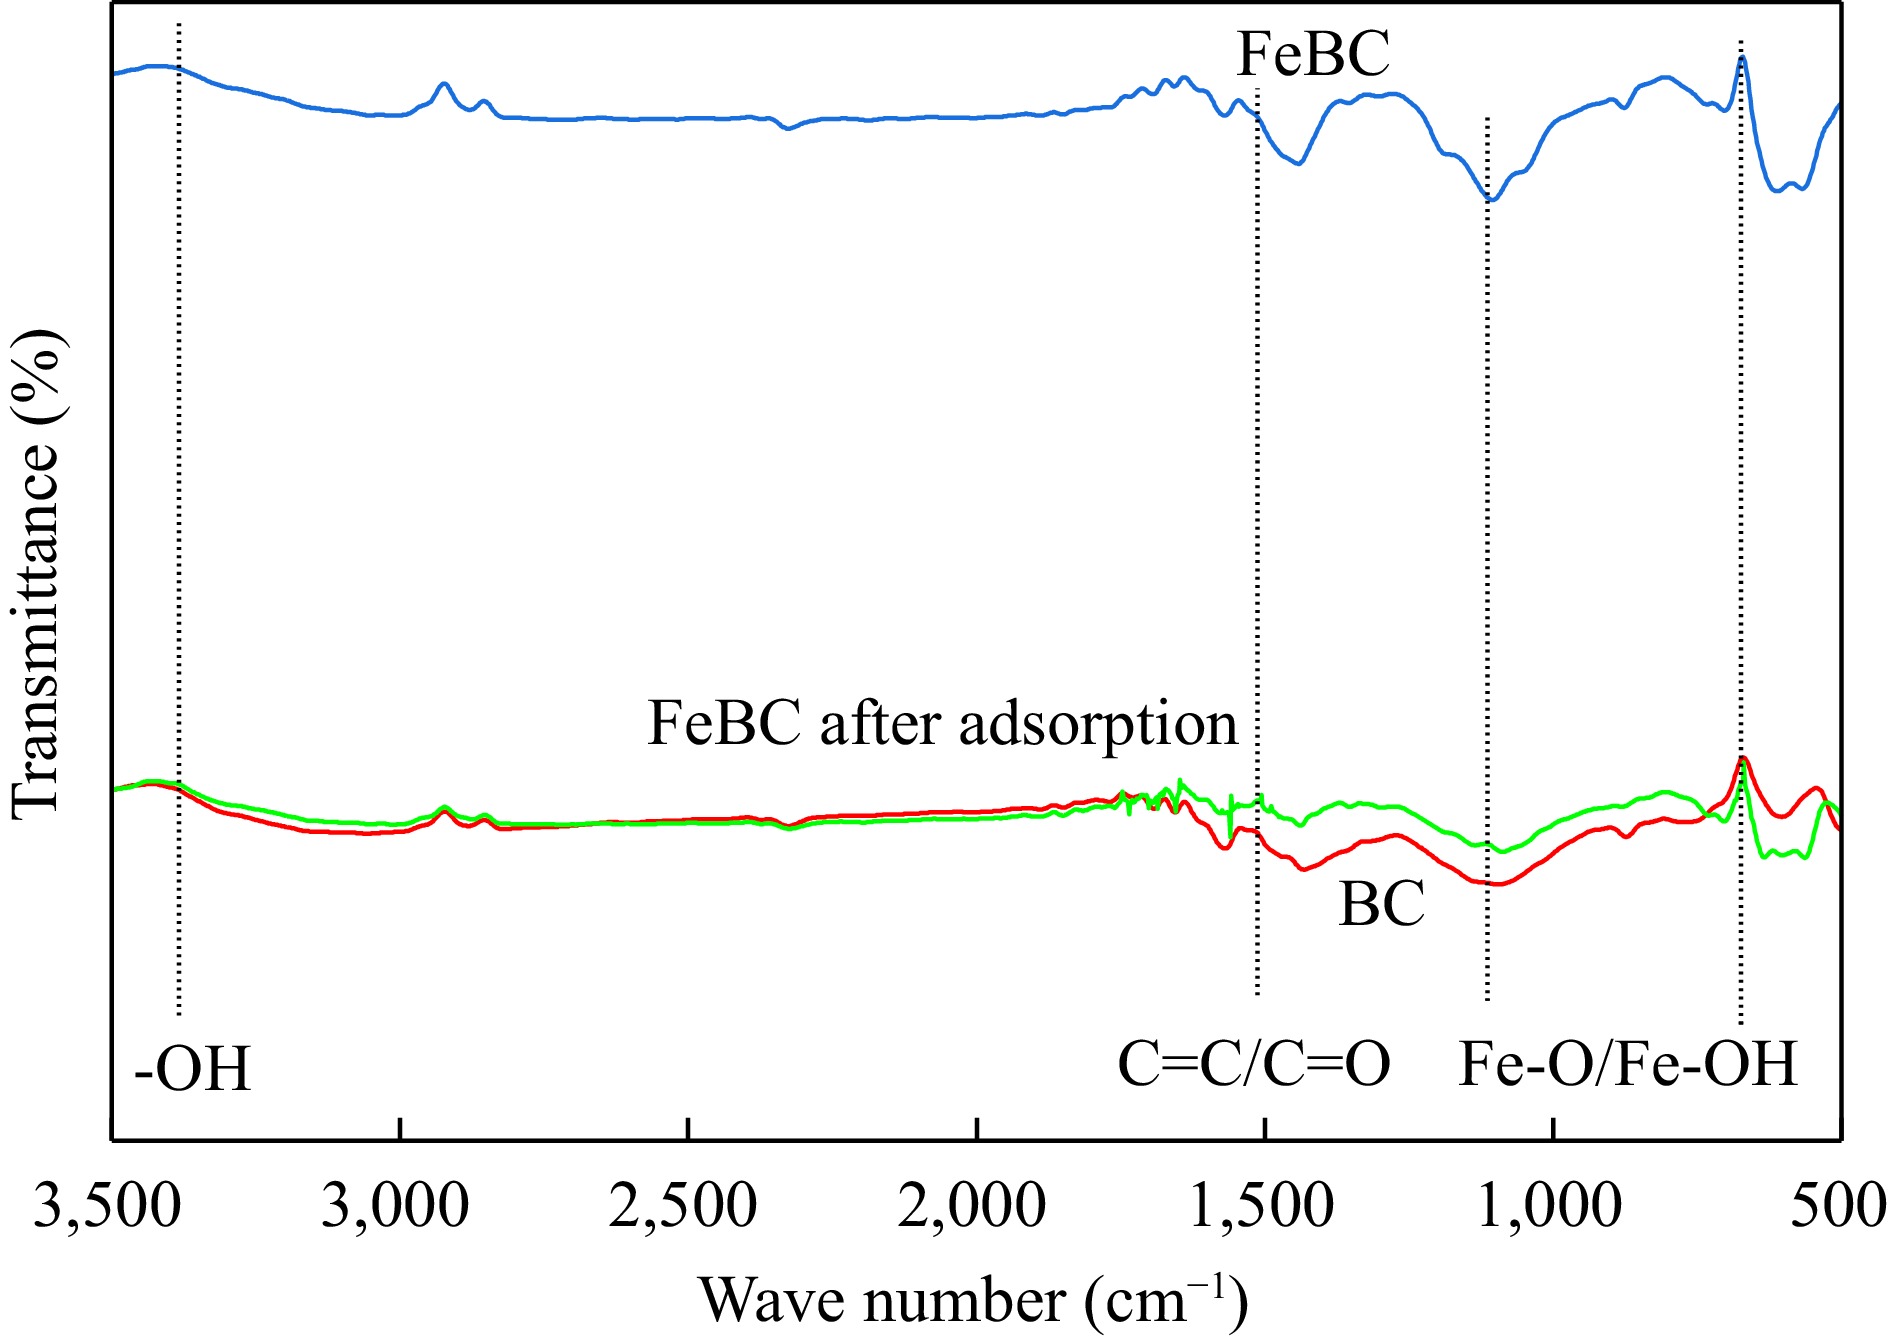
Figure 2.
FT-IR spectra of BC, FeBC, and FeBC after adsorption. BC represents biochar, FeBC represents iron-modified biochar without test, FeBC after adsorption represents iron-modified biochar adsorbed with heavy metals after test.
Effect of iron-modified biochar on Ks
-
The Ks is essential for managing soil and groundwater recharge, promoting soil health, and evaluating soil improvement strategies (Hervé-Fernández et al., 2023). The changes of Ks under different addition amounts of iron-modified biochar are shown in Fig. 3. Compared to CK, Ks of T1, T2, T3, T4, and T5 decreased to 93.70%, 84.13%, 83.33%, 79.60%, and 66.67%, respectively, indicating that Ks significantly decreased with the increase of iron-modified biochar amounts from 0 to 50 g·kg−1 (p < 0.05). The results indicated iron-modified biochar was conducive to slowing down the transport of Cd2+ in soil, which significantly enhanced the water holding capacity of soil.
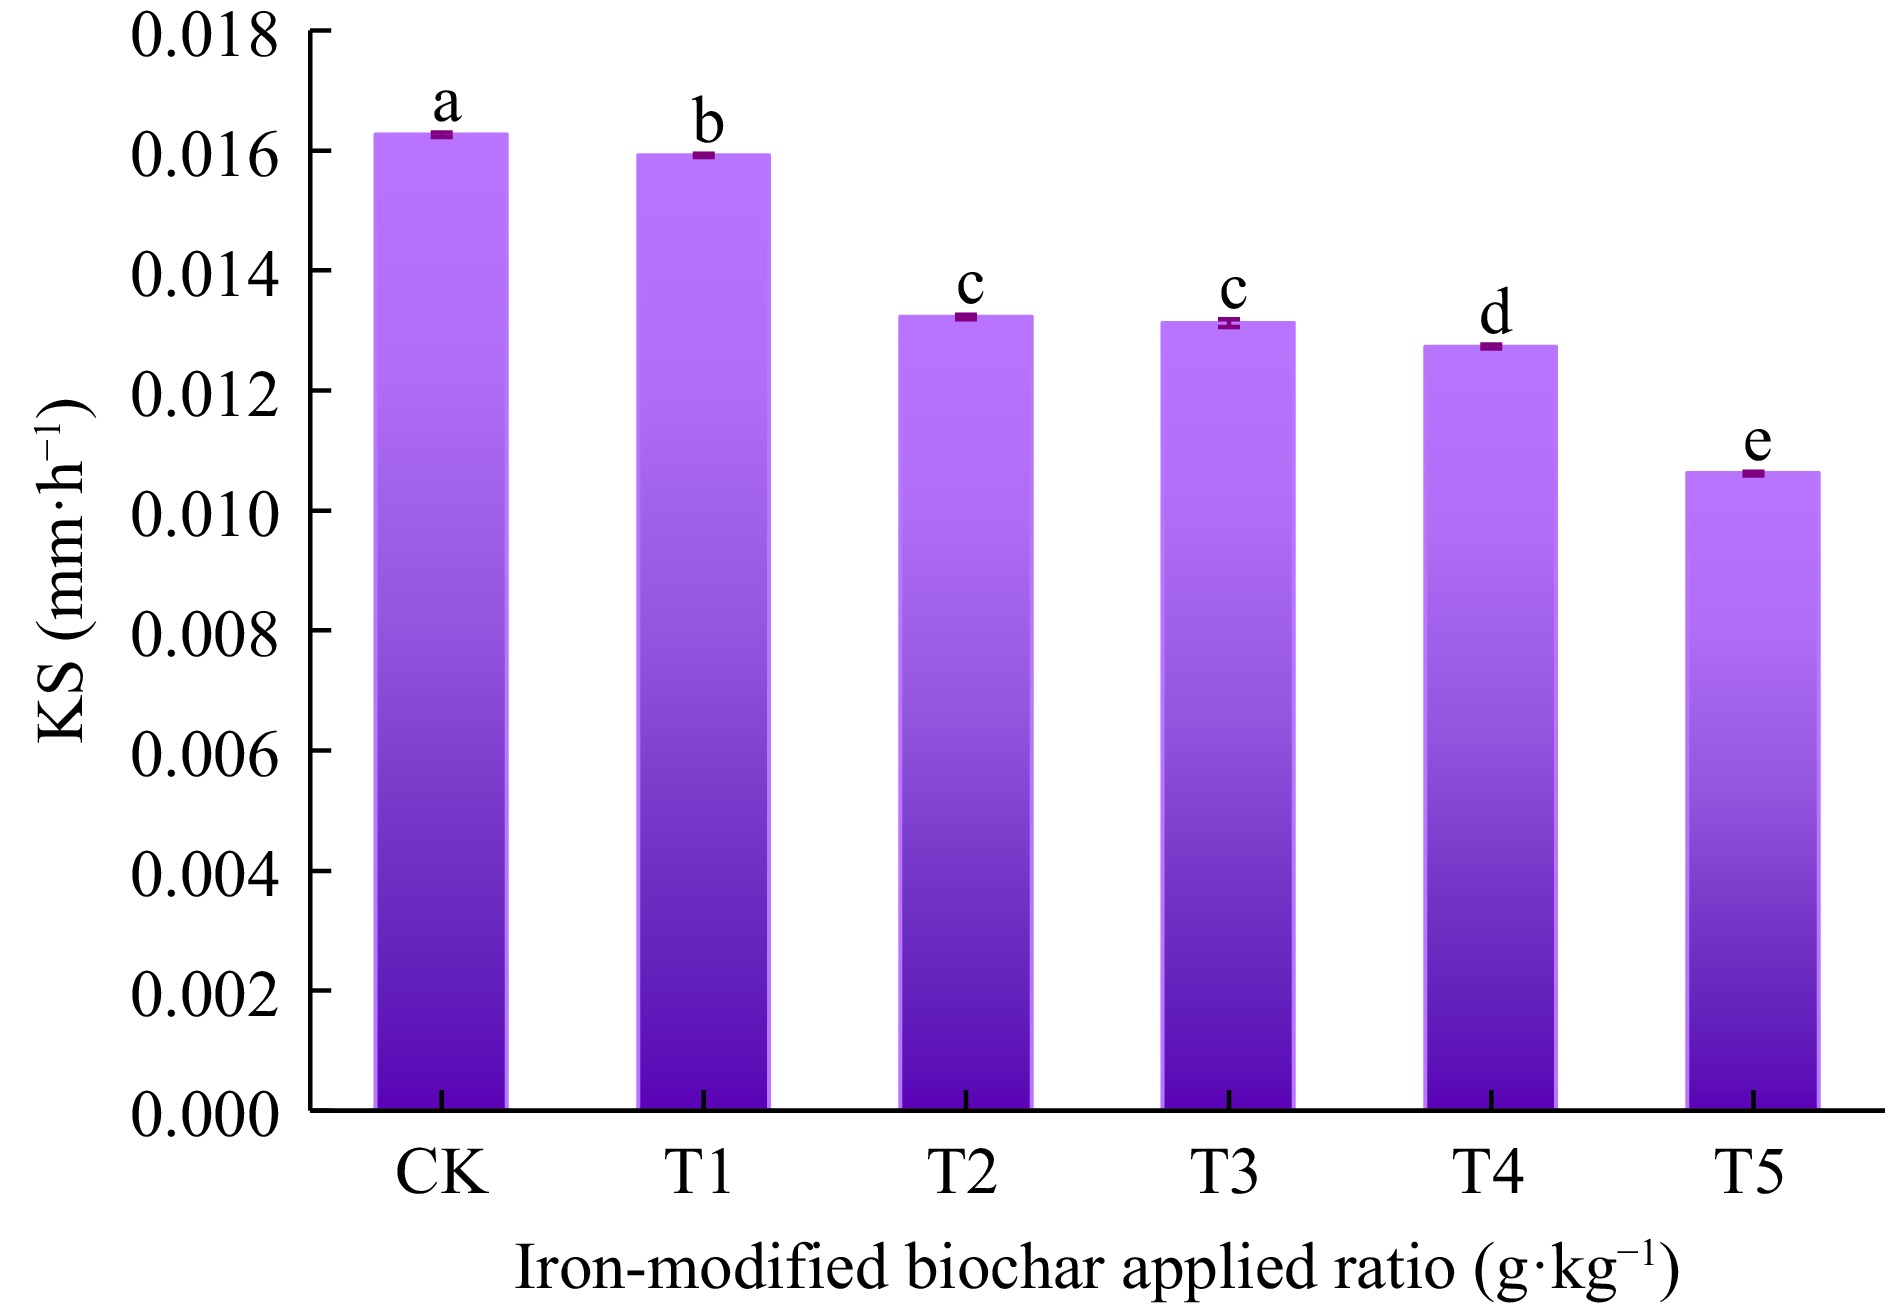
Figure 3.
The effect of iron-modified biochar on soil Ks. Different lowercase letters indicate significant difference between different treatments (p < 0.05).
Transport process of Cl−
-
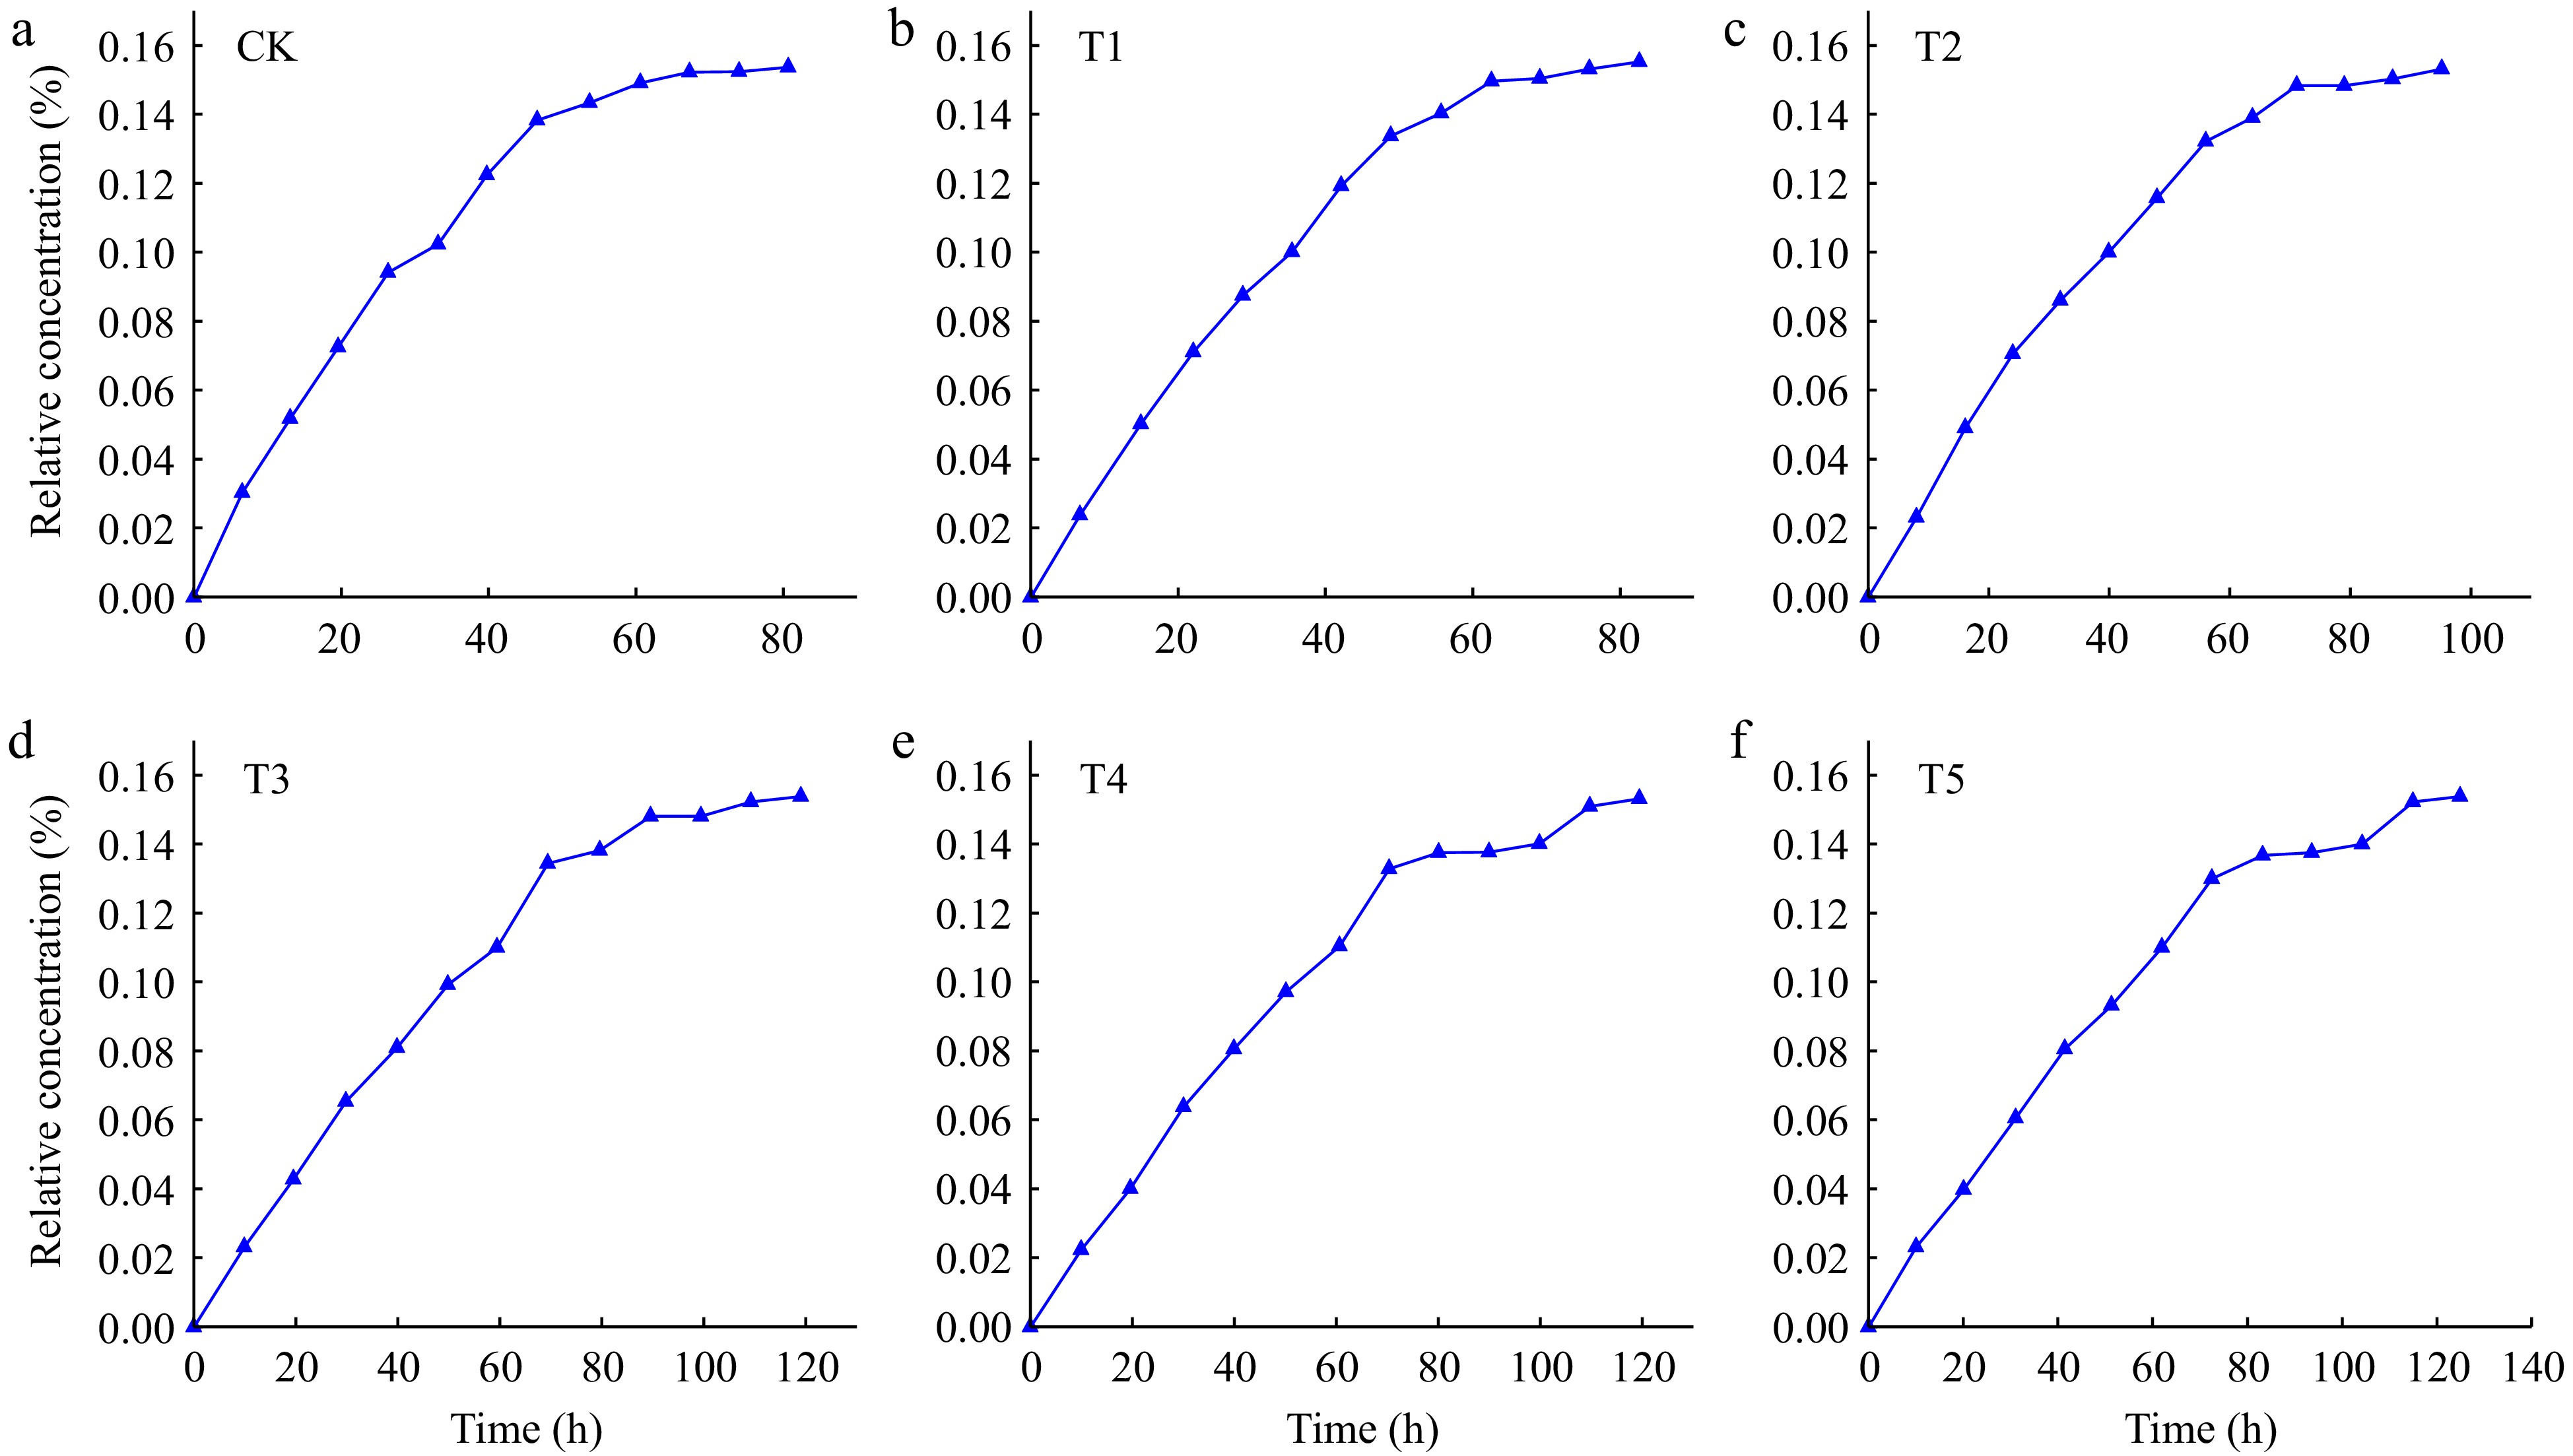
Figure 4 shows the transport of Cl− in loessial soil with different iron-modified biochar addition amount. All BTC curves showed the S-like characteristics, which was consistent with the results of Zhou et al. (2009) studied on the BTC curve of Cl−, but the shape and change trend under different iron-modified biochar contents were slightly different. BTC curves of Cl− in loessial soil with iron-modified biochar showed that relative concentration gradually increased with the increasing time. Compared to CK, BTC curves of other treatments shifted to the right with increasing amounts of iron-modified biochar, and showed obvious trailing characteristics due to different amounts of iron-modified biochar added in loessial soil.
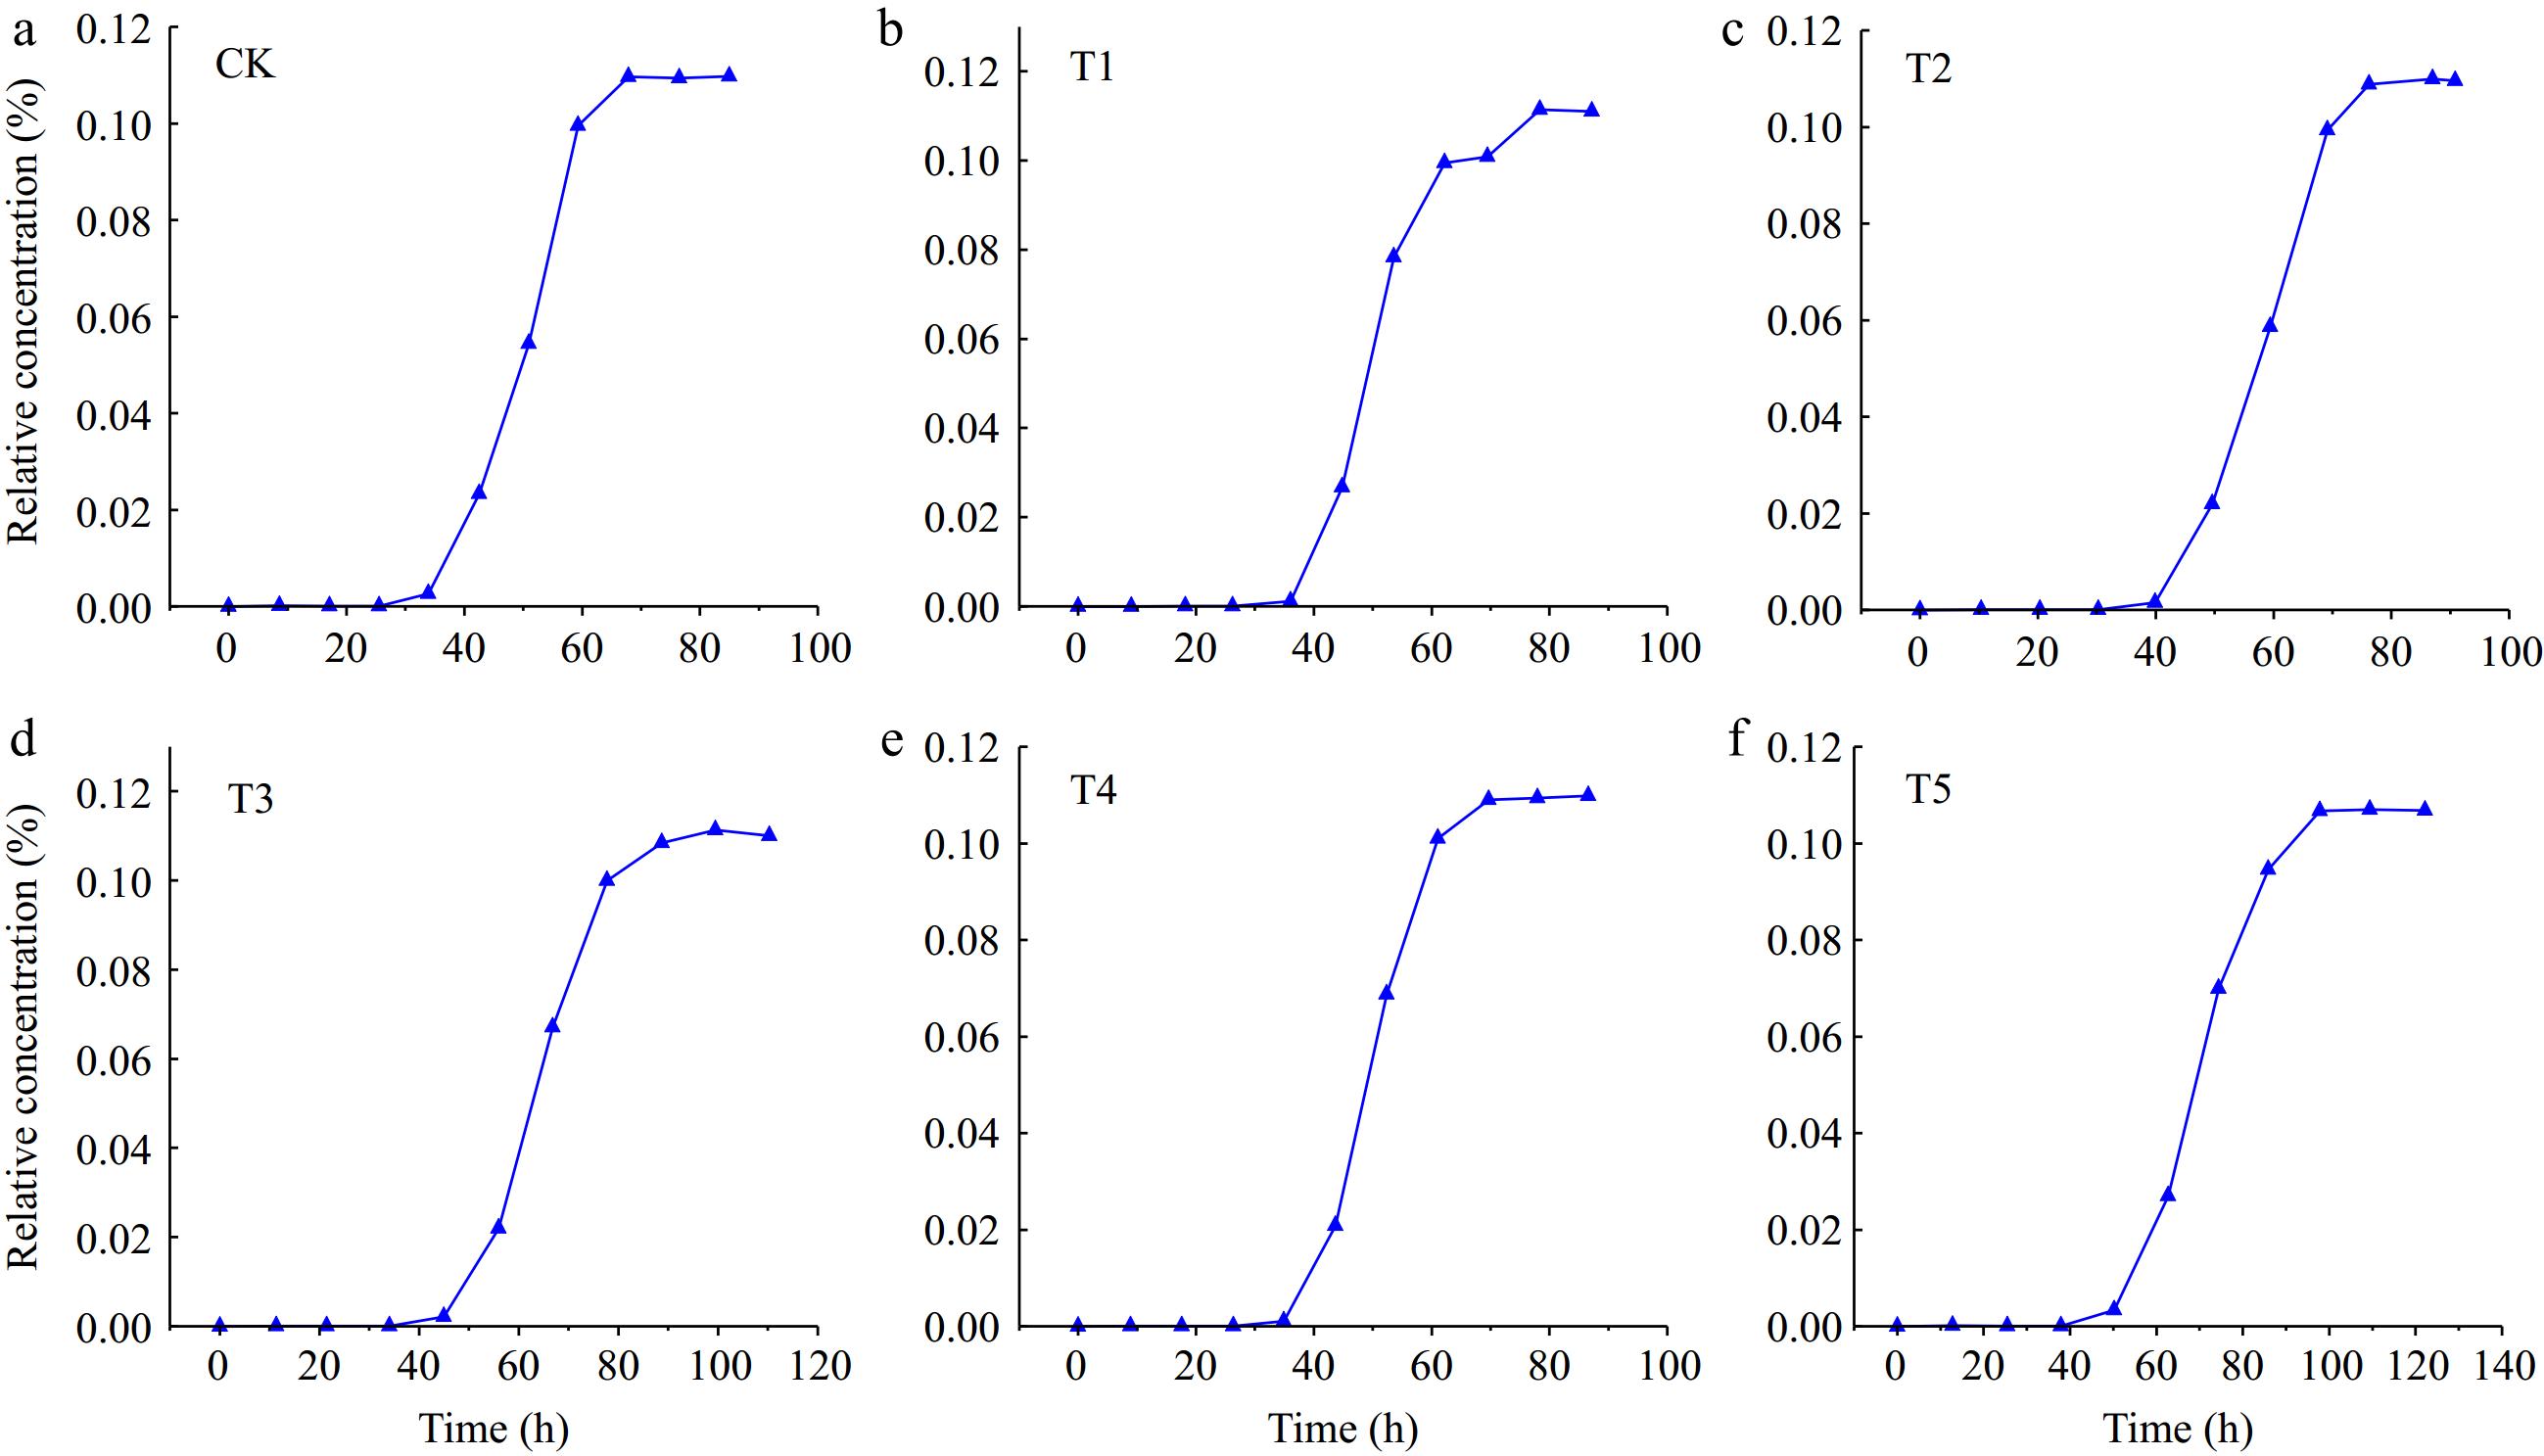
Figure 4.
The breakthrough curves of Cl− in loessal soil with different iron-modified biochar contents.
Initial penetration time (Te), complete penetration time (Ts), and total penetration time (Tt) are important characteristic parameters of solute penetration, which are jointly determined by pore water velocity and hydrodynamic dispersion coefficient of soil. Table 3 shows the the transport time of Cl− in loessial soil with added iron-modified biochar. Te, Ts, and Tt were all positively correlated with the addition amounts of iron-modified biochar, indicating the longer transport process under the greater amount of iron-modified biochar. As listed in Table 3, Te of Cl− increased from 8.57 to 12.76 h with the increasing application amounts of iron-modified biochar from 0 to 50 mg·kg−1. Ts of Cl− (exudate concentration equal to initial solution concentration) was also increased from 84.95 to 122.20 h, revealing that the time of complete migration equilibrium gradually extended with the increasing amounts of iron-modified biochar.
Table 3. The transport time of Cl− under different iron-modified biochar addition amounts.
Treatment Te (h) Ts (h) Tt (h) CK 8.57 84.95 76.38 T1 8.99 87.20 78.21 T2 10.35 98.82 88.47 T3 11.38 110.25 98.87 T4 12.16 115.59 77.75 T5 12.76 122.20 109.44 Te represents initial penetration time, Ts represents complete penetration time and Tt represents total penetration time. To further investigate the effect of iron-modified biochar on Cl− transport in loessial soil, the transport curve of Cl− in loessial soil by adding different iron-modified biochar was fitted using the CDE equation and TRM model. The main parameters of the CDE equation and TRM model are summarized in Table 4. The fitting effect of the TRM model was better than the CDE equation due to the higher R2 more than 0.985 and lower (RMSE) less than 0.306. The values of the average pore water velocity (v) decreased with the increasing amounts of iron-modified biochar, indicating that adding of iron-modified biochar decreased the pore size of loessial soil and reduced the soil pore water velocity.
Table 4. The relevant model parameters obtained by Cl− transport curve fitting.
Parameters Model name CK T1 T2 T3 T4 T5 v (cm·h−1) CDE 0.376 0.329 0.264 0.227 0.201 0.135 TRM 0.308 0.307 0.266 0.241 0.217 0.203 D (cm2·h−1) CDE 0.100 0.100 0.100 0.100 0.100 0.224 TRM 0.575 0.100 0.100 0.100 0.100 0.174 λ CDE 0.266 0.304 0.379 0.441 0.498 0.741 TRM 0.286 0.326 0.375 0.415 0.406 0.857 β TRM 0.100 0.100 0.114 0.249 0.974 0.999 ω TRM 0.100 0.100 0.557 0.596 0.786 0.851 R2 CDE 0.887 0.944 0.906 0.929 0.938 0.927 TRM 0.980 0.990 0.985 0.994 0.994 0.999 RMSE CDE 0.326 0.364 0.272 0.249 0.235 0.201 TRM 0.306 0.287 0.241 0.230 0.222 0.134 v represents average pore water velocity, D represents hydrodynamic dispersion coefficient, λ represents the dispersion capacity of the solute in the pore medium, β represents the percentage of solute in the total soil concentration and in the mobile region under equilibrium conditions, ω represents parameter of the degree of solute exchange between movable and immovable regions, R2 represents coefficient of determination, RMSE represents the square root of the mean variance between the simulated value of the model and the measured value. λ refers to the dispersion capacity of the solute in the pore medium (Dong et al., 2023), its size is related to the average particle size and uniformity of the pore medium, which is numerically equal to the ratio of hydrodynamic dispersion coefficient (D) and v, the greater the value, the stronger the diffusion capacity of the solute in the pore medium.
The values of λ for the CDE equation and the TRM model also increased with the increasing amounts of iron-modified biochar, which indicated the diffusion capacity of Cl− was enhanced.
Transport process of Cd2+
-
Figure 5 shows the change of the BTC curve of Cd2+ in loessial soil under different addition amounts of iron-modified biochar. Unlike the BTC curves of Cl−, BTC curves of Cd2+ showed smooth L-like characteristics except for T4 and T5 treatments, and the concentration of Cd2+ in the effluent changed with time. The BTC curves of Cd2+ with different contents of iron-modified biochar in loessial soil showed that the concentration of Cd2+ increased gradually from low to high with time. Compared with CK, the BTC curves of Cd2+ with different addition amounts of iron-modified biochar all shifted to the right, and with the increase of iron-modified biochar, the BTC curve shifted to the right to a greater extent. The results showed that the addition of iron-modified biochar had a retarding effect on Cd2+ transport in loessial soil.
Table 5 showed the transport time of Cd2+ under different addition amounts of iron-modified biochar. It could be seen that Te, Ts, and Tt were all positively correlated with the addition amounts of iron-modified biochar, that was, the greater the application amount of-iron modified biochar, the longer the solute Te and Ts, and the longer the penetration process. The Te of Cd2+ under different addition amounts of iron modified biochar were 6.54, 6.70, 8.03, 9.86, 9.92, and 10.00 h, respectively.
Table 5. Transport time of Cd2+ under different iron-modified biochar amounts.
Treatment Te (h) Ts (h) Tt (h) CK 6.54 80.67 74.13 T1 6.70 82.62 75.92 T2 8.03 95.16 87.13 T3 9.86 118.97 109.11 T4 9.92 119.39 109.47 T5 10.00 124.94 114.94 Te represents initial penetration time, Ts represents complete penetration time, and Tt represents total penetration time. It could be concluded that Te lengthened with the increase of iron modified biochar addition amounts. The Ts of Cd2+ reaching transport equilibrium (exudate concentration equal to initial solution concentration) in loessial soil with different amounts of iron-modified biochar were 80.67, 82.62, 95.16, 118.97, 119.39, and 124.94 h, respectively. It could be seen that with the increase of iron-modified biochar addition amounts, the time of Cd2+ transport equilibrium was gradually extended, and the extent of the extension was increasing.
The applicability of different mathematical models to Cd2+ transport was compared and analyzed, and the main parameters of the CDE equation and TRM model were fitted in this paper (Table 6). From the results of parameter fitting, the R2 was close to 1. The values of all v decreased with the increasing iron-modified biochar amounts, indicating that iron-modified biochar could reduce the velocity of soil pore water and effectively slow down the transport of Cd2+ in loessial soil. λ values of the CDE equation and TRM model were larger than CK. RMSE refers to the square root of the mean variance between the simulated value of the model and the measured value. The smaller the value of RMSE is, the closer the simulated value is to the measured value. The simulation results of both the CDE equation and the TRM model showed that the RMSE value of TRM was smaller than that of CDE, indicating that the simulated value of the TRM model was closer to the measured value and the fitting result was better.
Table 6. The relevant model parameters obtained by Cd2+ transport curve fitting.
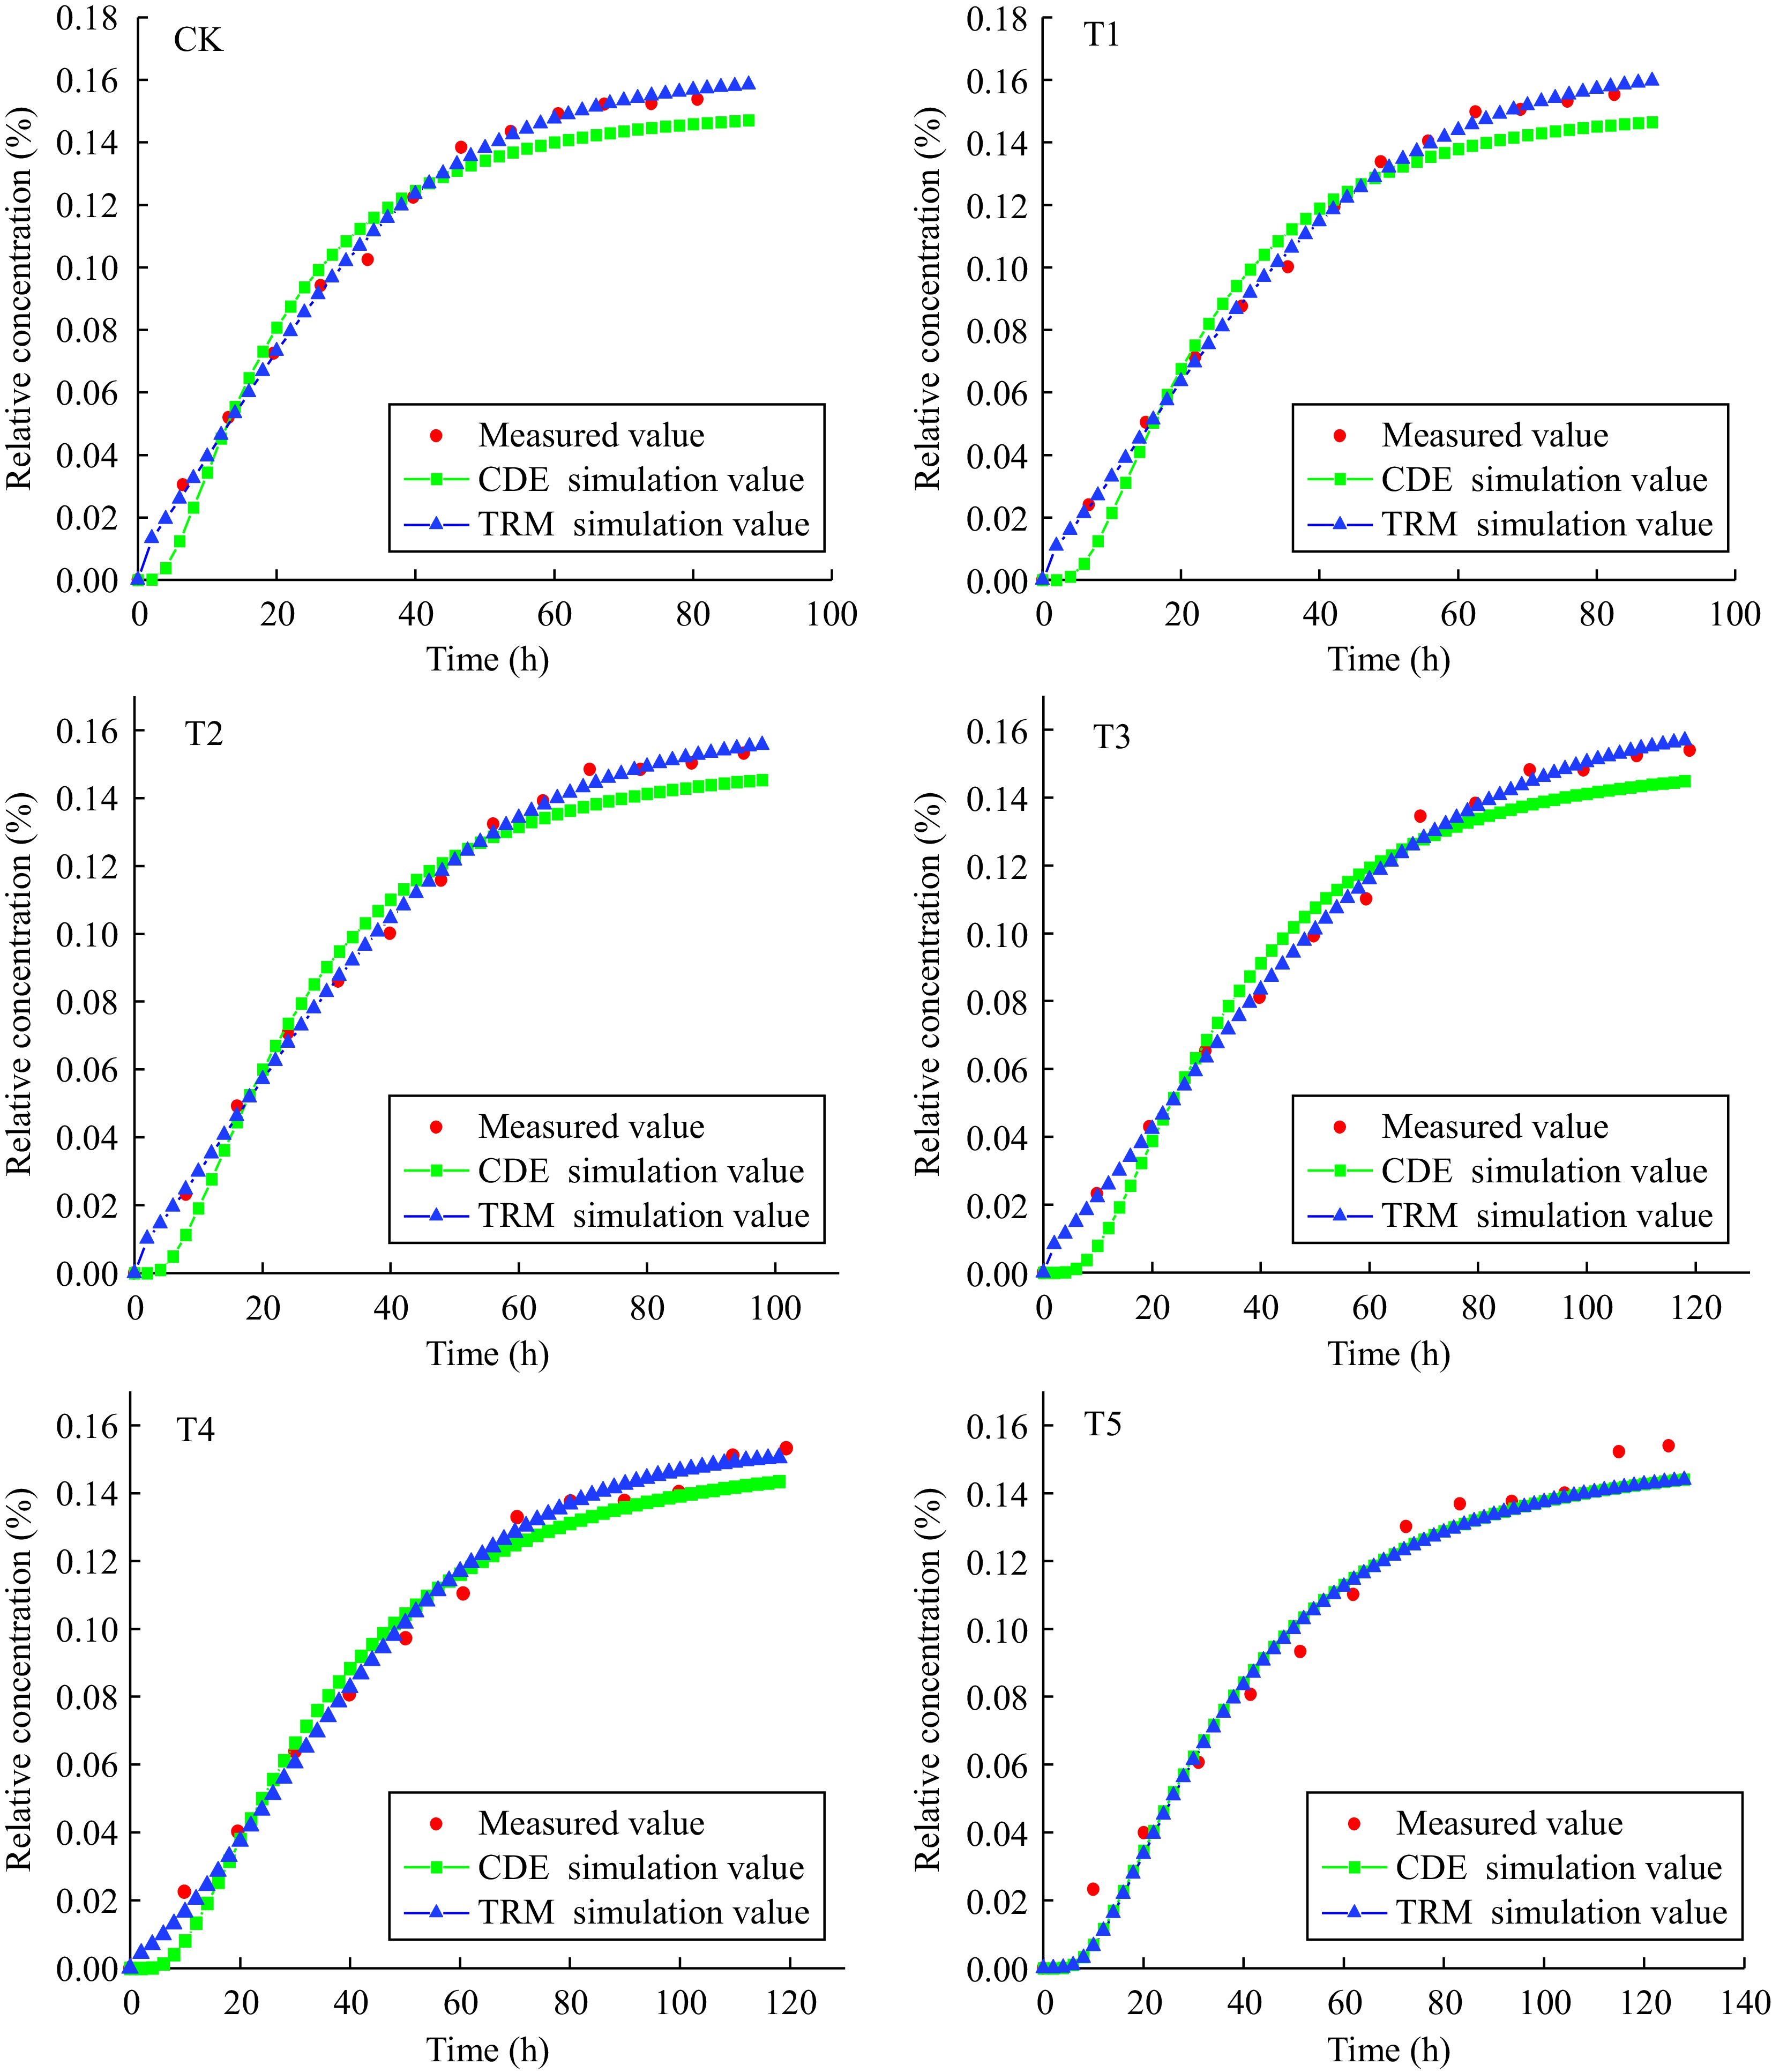
Parameters Model name CK T1 T2 T3 T4 T5 v (cm·h−1) CDE 0.882 0.723 0.659 0.489 0.478 0.452 TRM 0.557 0.476 0.433 0.384 0.354 0.307 D (cm2·h−1) CDE 0.602 0.212 0.409 0.264 0.281 0.265 TRM 0.140 0.120 0.108 0.118 0.274 0.220 λ CDE 0.293 0.540 0.586 0.588 0.621 0.683 TRM 0.251 0.252 0.249 0.307 0.717 0.774 β TRM 0.100 0.100 0.100 0.100 0.248 0.845 ω TRM 0.200 0.214 0.201 0.224 0.278 0.785 R2 CDE 0.997 0.972 0.979 0.973 0.979 0.976 TRM 0.997 0.998 0.998 0.996 0.993 0.976 RMSE CDE 0.770 0.835 0.619 0.828 0.602 0.691 TRM 0.114 0.781 0.580 0.134 0.246 0.350 v represents average pore water velocity, D represents hydrodynamic dispersion coefficient, λ represents the dispersion capacity of the solute in the pore medium, β represents the percentage of solute in the total soil concentration and in the mobile region under equilibrium conditions, ω represents parameter of the degree of solute exchange between movable and immovable regions, R2 represents coefficient of determination, RMSE represents the square root of the mean variance between the simulated value of the model and the measured value. To more intuitively analyze the difference and connection between measured values and simulated values, the breakthrough curves of Cd2+ under CK, 1%, 2%, 3%, 4%, and 5% treatments were simulated by the CDE equation and TRM model (Fig. 6). The simulation results from CK to T4 were shown, the fitting results from the CDE equation had different degrees of alienation from experimental data, whereas the fitting results from the TRM model were in good agreement with experimental data without the obvious estrangement, indicating that the solute transport process of Cd2+ could be better simulated by the TRM model compared to the CDE equation. The simulation results of the T5 treatment showed that both the CDE equation and the TRM model could fit well.
-
Ks represents the ease with which water flows through soil when pore spaces are filled with water, which is an important hydraulic parameter used to investigate the transport characteristics of soil solute (Shwetha et al., 2015). Ks is closely related to soil physical properties such as soil bulk density and pore distribution (Jačka et al., 2018). Similar to the results of this study, Nakhli et al. (2021) observed biochar amendments decreased Ks of soil. Another study by Lim et al. (2018) observed Ks decreased when either larger or smaller-size macadamia nutshell and pine chip biochar particles were added to the soil.
The transport equilibrium time of Cd2+ in loessial soil was significant delayed with the increasing iron-modified biochar amounts. The addition of iron-modified biochar increased the number of small pores in loessial soil, whereas the flow of water and the interconnected pores were decreased, which would lead to the complexity and uniformity of the pore structure of saturated soil. The soil pores with uneven size and distribution would cause different flow velocity, so an unbalanced solute front was formed in the soil profile, resulting in the extension of the transport time (Dong et al., 2023).
The BTC curve of Cd2+ in loessial soil was analyzed under different addition amounts of iron-modified biochar. As the BTC curve shifted to the right with the increase of the addition amounts of iron modified biochar, the penetration of Cd2+ in loessial soil was significantly delayed. The penetration time was significantly extended when the relative concentration reached the highest. This was consistent with the penetration results of Cd2+ transport in complex heavy metal contaminated sites by Liu et al. (2022). The results of the CDE equation and TRM model showed that v decreased with the increase of the amount of iron-modified biochar, indicating that the application of iron-modified biochar reduced the velocity of soil pore water and slowed down the transport of Cd2+ in loessial soil. The increase of λ from the CDE equation and TRM model with the increasing amounts of iron-modified biochar could be caused by the addition of iron-modified biochar, which increased the pore complexity of loessial soil. The iron-modified biochar caused blockage of some pores, the curvature of the water channel and unconnected pore area increased, and the pore water flow rate decreased (Berkowitz et al., 2000). Therefore, iron-modified biochar slowed down and prevented the transport of Cd2+ in loessial soil. The adsorption capacity of iron-modified biochar to heavy metals increased significantly due to the increase of surface functional groups (Zhou et al., 2018). The β was the percentage of solute in the total soil concentration and the mobile region under equilibrium conditions (Satyawali et al., 2011; Schulin et al., 1987). the adsorption capacity of iron modified biochar to heavy metals increased significantly due to the increase of surface functional groups. According to fitting of TRM, the increase of β (from 0.100 to 0.845) indicated that the physical process of solute transport was more balanced with the increasing amounts of iron-modified biochar.
Although the Cd2+ transport process of loessial soil after the application of iron-modified biochar was studied and simulated in this paper, and the characteristics and rules of soil Cd2+ transport were analyzed, this paper mainly focused on the study and analysis of the influence mechanism of iron-modified biochar, which may have certain differences and limitations from the actual application in the field. In the future, this research group will conduct a more in-depth and systematic study on the transport process of heavy metals in soil through field experiments and long-term follow-up studies, so as to provide more reliable data support for the utilization of iron-modified biochar and the prevention and control of soil contaminated by heavy metals in loessial soil.
-
In the present study, the effect of iron-modified biochar on the transport of Cl- and Cd2+ in loessial soil was investigated and then fitted using the CDE equation and TRM model.
(1) Compared to CK, Ks gradually decreased to 93.70%, 84.13%, 83.33%, 79.60%, and 66.67% with the increase of iron-modified biochar addition amounts from 1%, 2%, 3%, 4%, and 5%, respectively. The results indicated iron-modified biochar in soil could enhance the water holding capacity of soil.
(2) The total transport time of Cd2+ increased (from 1.79 to 40.81 h) with the increase of iron-modified biochar addition amounts, because the addition of iron-modified biochar decreased the flow of water and the interconnected pores, and extended the transport time of Cd2+.
(3) Compared to CDE, the transport of Cd2+ in loessial soil with adding iron-modified biochar could be better simulated by TRM model due to the higher R2 (> 0.97). According to the fitting of TRM model, the increasing amounts of iron-modified biochar slowed down and prevented the transport of Cd2+ in loessial soil. These findings were crucial for the application of iron-modified biochar in remediation of heavy metal-contaminated soil.
This study was funded by the Natural Science Foundation of Ningxia Hui Autonomous Region Project (2023AAC03046, 2023AAC02018) and the National Natural Science Foundation of China (NSFC) (32360321) and the Key Research and Development of Ningxia Hui Autonomous Region Project (2021BEG02011).
-
The authors confirm contribution to the paper as follows: writing - original draft prepration, software: Ma C; investigation: Ma C, Yuan C, Ma Y; supervision, writing - review & editing; visualization; funding acquisition: Bai Y, Wang Y. All authors reviewed the results and approved the final version of the manuscript.
-
All data generated or analyzed during this study are included in this published article.
-
The authors declare that they have no conflict of interest.
- Copyright: © 2024 by the author(s). Published by Maximum Academic Press, Fayetteville, GA. This article is an open access article distributed under Creative Commons Attribution License (CC BY 4.0), visit https://creativecommons.org/licenses/by/4.0/.
-
About this article
Cite this article
Ma C, Bai Y, Yuan C, Ma Y, Wang Y. 2024. Effect and model analysis of iron-modified biochar on chloridion and cadmium ion transport in loessial soil. Soil Science and Environment 3: e001 doi: 10.48130/sse-0024-0001
Effect and model analysis of iron-modified biochar on chloridion and cadmium ion transport in loessial soil
- Received: 21 May 2024
- Revised: 26 September 2024
- Accepted: 14 October 2024
- Published online: 18 November 2024
Abstract: Iron-modified biochar is an environmently-friendly soil amendment, which plays an important role in regulating heavy metal transport in loessial soil. In this study, the mass ratio of iron-modified biochar to loessial soil was set to 0%, 1%, 2%, 3%, 4%, and 5% as CK, T1, T2, T3, T4, and T5 treatments, respectively. Based on solute transport experiments, the transport process of chloridion (Cl−) and cadmium ion (Cd2+) in soil adding iron-modified biochar was fitted using the convection-dispersion equation (CDE) and two-zone model (TRM). The results showed that the saturated hydraulic conductivity (Ks) gradually decreased to 93.70%, 84.13%, 83.33%, 79.60%, and 66.67% compared with CK, with increased iron-modified biochar addition amount. The total duration time of the equilibrium ion concentration was increased from 1.79 to 40.81 h, indicating that the initial and complete transport time of heavy metals was significantly retarded with the increase of iron-modified biochar addition amount. The mean intervoid water velocity (v) obtained from model fitting was opposite to the trend of the amount of iron-modified biochar. The fitting data of the CDE equation and TRM model were in good agreement with the experimental data, whereas the better simulation accuracy of the TRM model was observed according to the higher correlation coefficient (R2 > 0.99) and lower root mean square error (RMSE) than the CDE equation. These findings indicate that iron-modified biochar effectively retards the transport of heavy metal ions in soil, which could provide a theoretical basis and technical ideas for the remediation of heavy metal-contaminated soil.
-
Key words:
- Cl− /
- Cd2+ /
- Convection-dispersion equation /
- Iron-modified biochar /
- Transport /
- Two-zone model


