2023 Volume 2
Article Contents
About this article
ARTICLE   Open Access    

Effects of habitat fragmentation on the coastal Vatica mangachapoi forest (Dipterocarpaceae) in Shimei Bay, Hainan Island, China

More Information
  • There is no significant difference in genetic diversity between the coastal and lowland V. mangachapoi populations.

    No fine-scale spatial genetic structure was detected in the coastal SM population.

    Strong gene flow between populations accounts for the homogenous genetic structure of the coastal and lowland populations.

    There is not enough time to accumulate differentiation between fragmented populations in the coastal forest.

  • Habitat fragmentation can cause isolation and decline of a formerly continuously distributed population, which leads to loss of genetic variation and increased risk of extinction. Vatica mangachapoi Blanco is a dominant tree species growing in the lowland rainforests of Hainan Island, China. Remarkably, this species dominates a coastal forest in Shimei Bay, Wanning City of Hainan Province (China). Due to logging, expansion of farmland and villages, and construction of tourism facilities, the coastal V. mangachapoi-dominated forest has become fragmented, threatening its future. To evaluate the effects of habitat fragmentation on this unique coastal forest, two V. mangachapoi populations (SM and RY) along the coast and one population in the lowland rainforest near the coast were selected, and their genetic diversity was assessed based on 12 SSR markers. In addition, the genetic structure of the three populations and gene flow among them, and the fine-scale spatial genetic structure (FSGS) of the SM population were also studied. The results show that the three V. mangachapoi populations had comparable levels of genetic variation, and differentiation among them is negligible (Fst = 0.008 ~ 0.013). Model-based clustering, Principal co-ordinate analysis and the Neighbor-joining (NJ) methods consistently support a homogeneous genetic structure of the three populations, and strong gene flow was detected among them by MIGRATE analyses. Moreover, there is no significant FSGS in the SM population. A relatively short time since habitat fragmentation and gene flow mediated by seed dispersal might be the likely reasons for the high levels of genetic variation and an absence of genetic structure of the coastal V. mangachapoi populations. In conclusion, even though there are no significant effects of fragmentation on the coastal V. mangachapoi forest, strict protection is required to prevent further deforestation and fragmentation. Besides, saplings of V. mangachapoi should be planted in forest gaps to reconnect fragments of the coastal forest, which would be of benefit for the long-term survival of the tropical coastal V. mangachapoi-dominated forest.
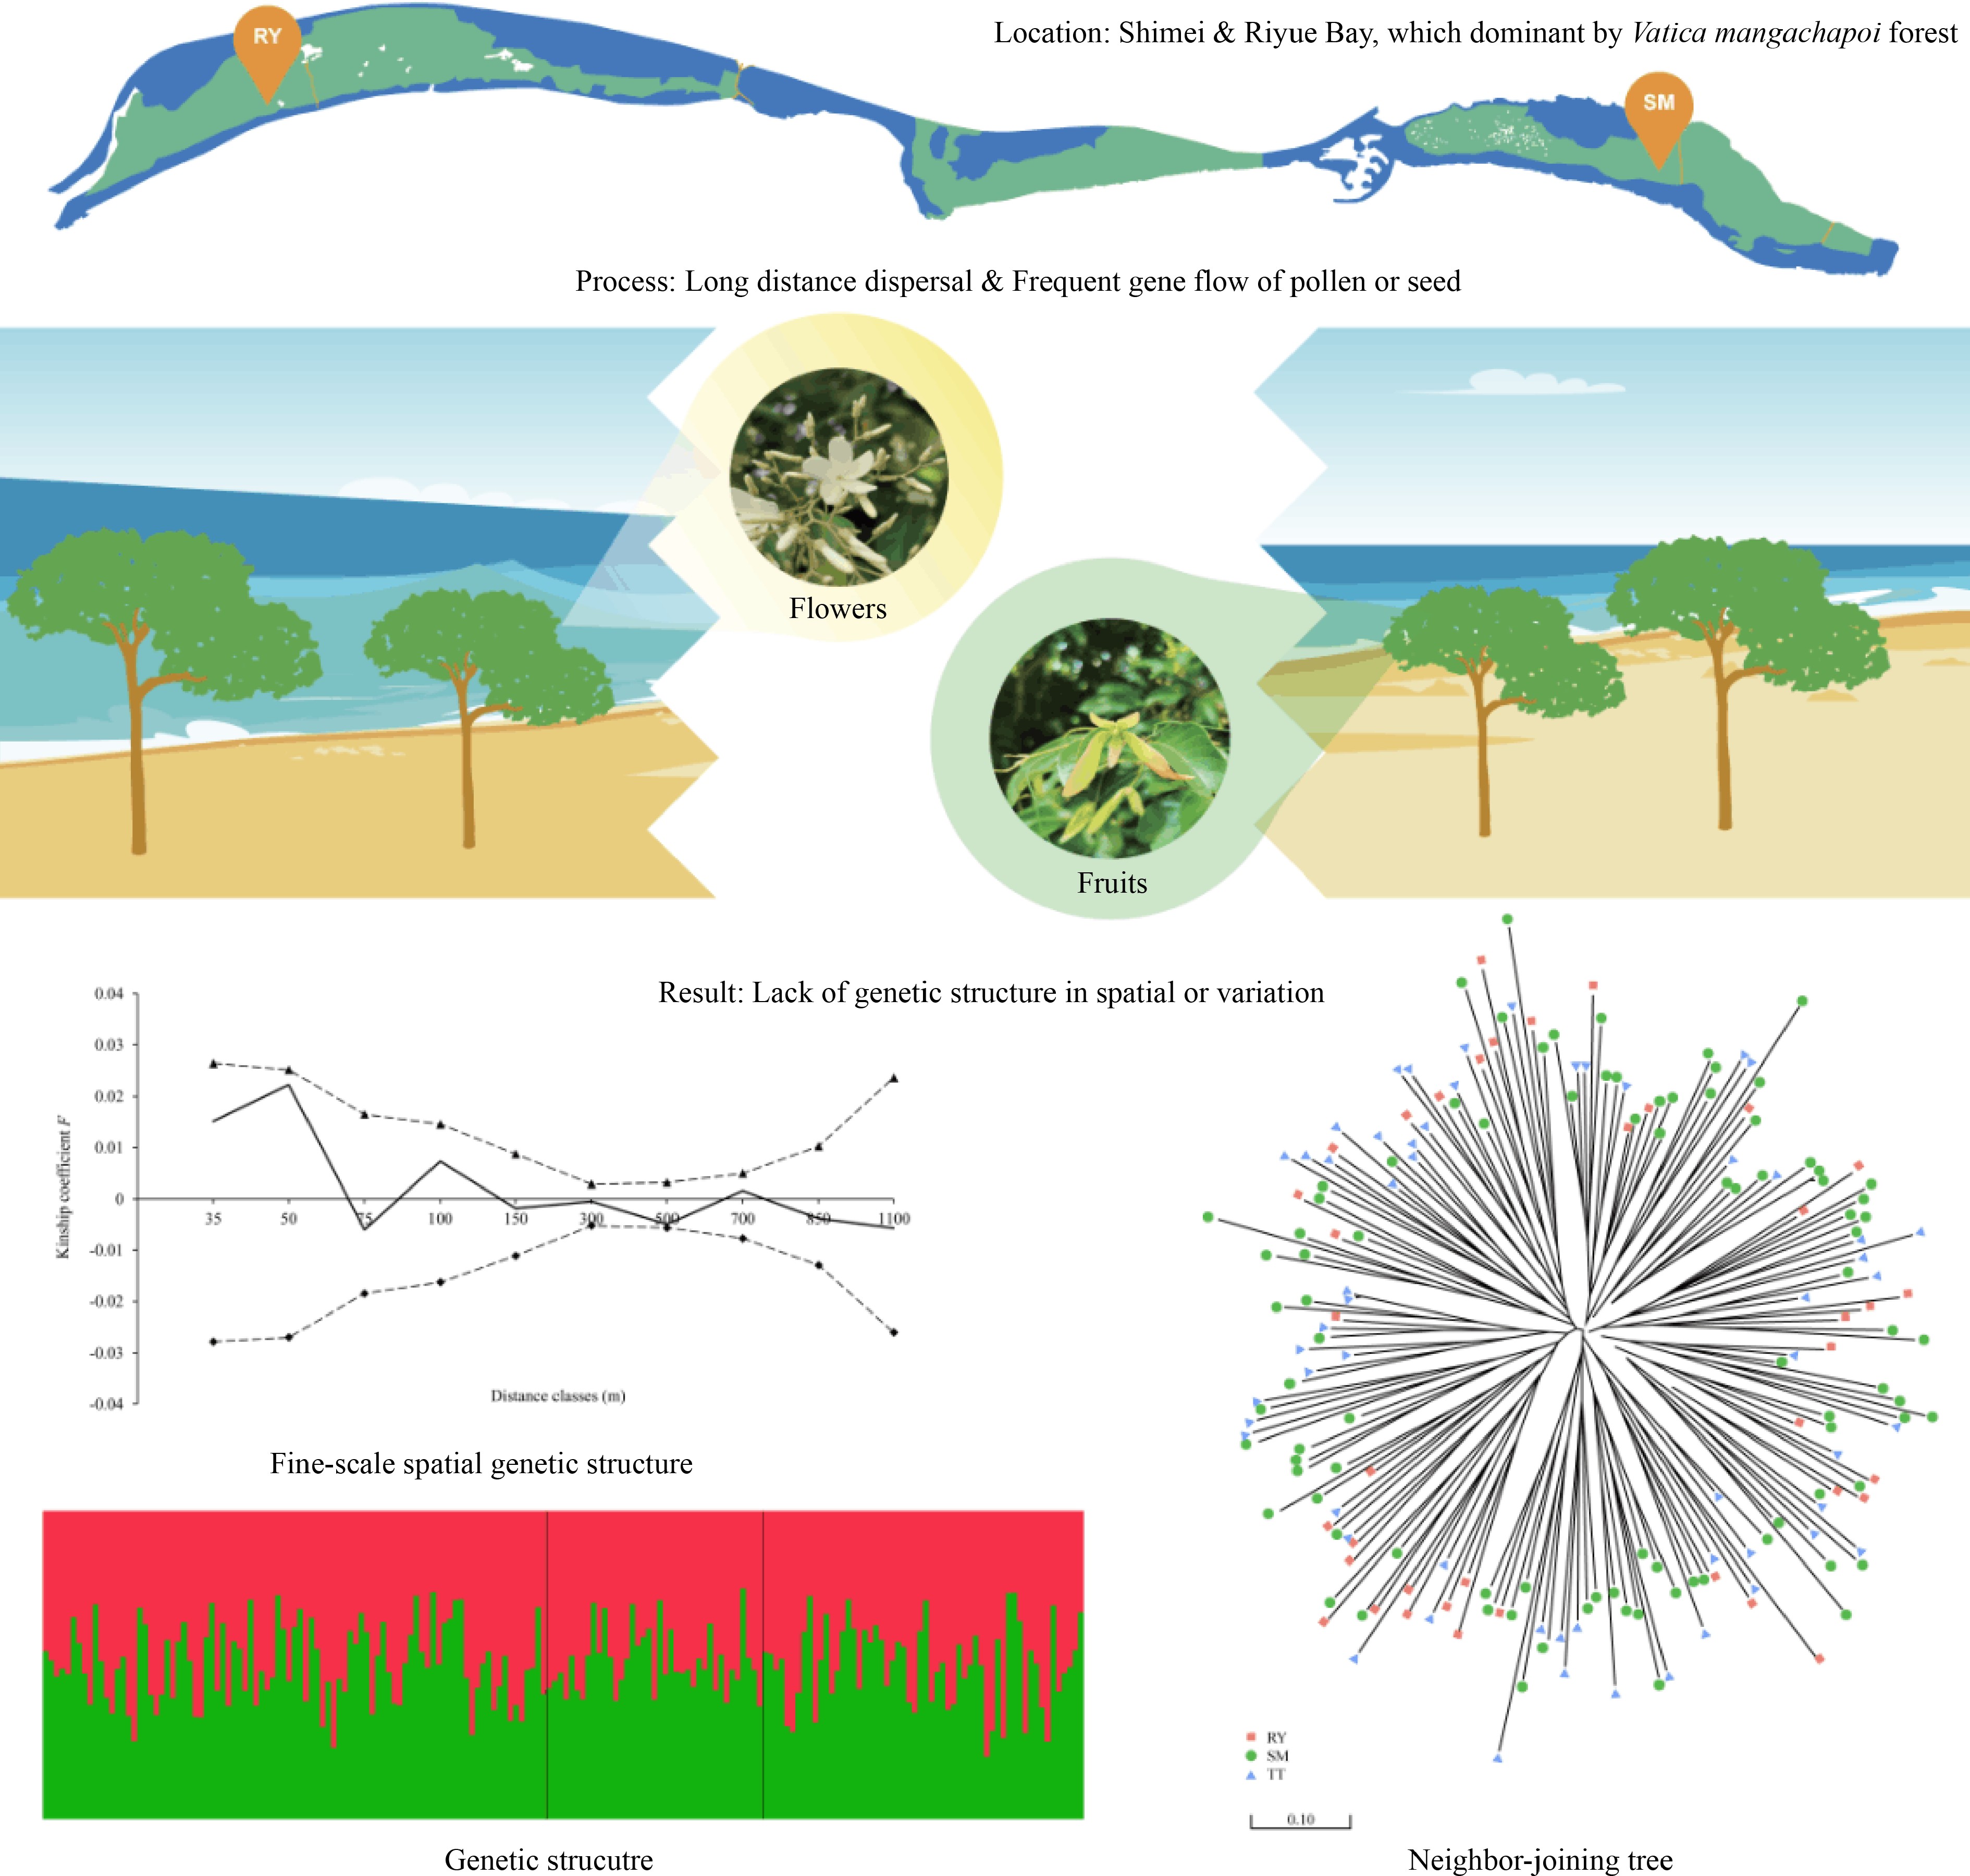
    Graphical Abstract
  • Columnar cacti are plants of the Cactaceae family distributed across arid and semi-arid regions of America, with ecological, economic, and cultural value[1]. One trait that makes it possible for the columnar cactus to survive in the desert ecosystem is its thick epidermis covered by a hydrophobic cuticle, which limits water loss in dry conditions[1]. The cuticle is the external layer that covers the non-woody aerial organs of land plants. The careful control of cuticle biosynthesis could produce drought stress tolerance in relevant crop plants[2]. In fleshy fruits, the cuticle maintains adequate water content during fruit development on the plant and reduces water loss in fruit during postharvest[3]. Efforts to elucidate the molecular pathway of cuticle biosynthesis have been carried out for fleshy fruits such as tomato (Solanum lycopersicum)[4], apple (Malus domestica)[5], sweet cherry (Prunus avium)[6], mango (Mangifera indica)[7], and pear (Pyrus 'Yuluxiang')[8].

    The plant cuticle is formed by the two main layers cutin and cuticular waxes[3]. Cutin is composed mainly of oxygenated long-chain (LC) fatty acids (FA), which are synthesized by cytochrome p450 (CYP) enzymes. CYP family 86 subfamily A (CYP86A) enzymes carry out the terminal (ω) oxidation of LC-FA[9]. Then, CYP77A carries out the mid-chain oxidation to synthesize the main cutin monomers. In Arabidopsis, AtCYP77A4 and AtCYP77A6 carry out the synthesis of mid-chain epoxy and mid-chain dihydroxy LC-FA, respectively[10,11]. AtCYP77A6 is required for the cutin biosynthesis and the correct formation of floral surfaces[10]. The expression of CYP77A19 (KF410855) and CYP77A20 (KF410856) from potato (Solanum tuberosum) restored the petal cuticular impermeability in Arabidopsis null mutant cyp77a6-1, tentatively by the synthesis of cutin monomers[12]. In eggplant (Solanum torvum), the over-expression of StoCYP77A2 leads to resistance to Verticillium dahlia infection in tobacco plants[13]. Although the function of CYP77A2 in cutin biosynthesis has not yet been tested, gene expression analysis suggests that CaCYP77A2 (A0A1U8GYB0) could play a role in cutin biosynthesis during pepper fruit development[14].

    It has been hypothesized that the export of cuticle precursors is carried out by ATP binding cassette subfamily G (ABCG) transporters. ABCG11/WBC11, ABCG12, and ABCG13 are required for the load of cuticle lipids in Arabidopsis[1517], but ABCG13 function appears to be specific to the flower epidermis[18]. The overexpression of TsABCG11 (JQ389853) from Thellungiella salsugineum increases cuticle amounts and promotes tolerance to different abiotic stresses in Arabidopsis[19].

    Once exported, the cutin monomers are polymerized on the surface of epidermal cells. CD1 code for a Gly-Asp-Ser-Leu motif lipase/esterase (GDSL) from tomato required for the cutin formation through 2-mono(10,16-dihydroxyhexadecanoyl)glycerol esterification[20]. GDSL1 from tomato carries out the ester bond cross-links of cutin monomers located at the cuticle layers and is required for cuticle deposition in tomato fruits[21]. It has been shown that the transcription factor MIXTA-like reduces water loss in tomato fruits through the positive regulation of the expression of CYP77A2, ABCG11, and GDSL1[22]. Despite the relevant role of cuticles in maintaining cactus homeostasis in desert environments[1], the molecular mechanism of cuticle biosynthesis has yet to be described for cactus fruits.

    Stenocereus thurberi is a columnar cactus endemic from the Sonoran desert (Mexico), which produces an ovoid-globose fleshy fruit named sweet pitaya[23]. In its mature state, the pulp of sweet pitaya contains around 86% water with a high content of antioxidants and natural pigments such as betalains and phenolic compounds, which have nutraceutical and industrial relevance[23]. Due to the arid environment in which pitaya fruit grows, studying its molecular mechanism of cuticle biosynthesis can generate new insights into understanding species' adaptation mechanisms to arid environments. Nevertheless, sequences of transcripts from S. thurberi in public databases are scarce.

    RNA-sequencing technology (RNA-seq) allows the massive generation of almost all the transcripts from non-model plants, even if no complete assembled genome is available[24]. Recent advances in bioinformatic tools has improved our capacity to identify long non-coding RNA (lncRNA), which have been showed to play regulatory roles in relevant biological processes, such as the regulation of drought stress tolerance in plants[25], fruit development, and ripening[2629].

    In this study, RNA-seq data were obtained for the de novo assembly and characterization of the S. thurberi fruit peel transcriptome. As a first approach, three transcripts, StCYP77A, StABCG11, and StGDSL1, tentatively involved in cuticle biosynthesis, were identified and quantified during sweet pitaya fruit development. Due to no gene expression analysis having been carried out yet for S. thurberi, stably expressed constitutive genes were identified for the first time.

    Sweet pitaya fruits (S. thurberi) without physical damage were hand harvested from plants in a native conditions field located at Carbó, Sonora, México. They were collocated in a cooler containing dry ice and transported immediately to the laboratory. The superficial part of the peels (~1 mm deep) was removed carefully from the fruits using a scalpel. Peel samples from three fruits were pooled according to their tentative stage of development defined by their visual characteristics, frozen in liquid nitrogen, and pulverized to create a single biological replicate. Four samples belonging to four different plants were analyzed. All fruits harvested were close to the ripening stage. Samples named M1 and M2 were turning from green to ripe [~35−40 Days After Flowering (DAF)], whereas samples M3 and M4 were turning from ripe to overripe (~40−45 DAF).

    Total RNA was isolated from the peels through the Hot Borate method[30]. The concentration and purity of RNA were determined in a spectrophotometer Nanodrop 2000 (Thermo Fisher) by measuring the 260/280 and 260/230 absorbance ratios. RNA integrity was evaluated through electrophoresis in agarose gel 1% and a Bioanalyzer 2100 (Agilent). Pure RNA was sequenced in the paired-end mode in an Illumina NextSeq 500 platform at the University of Arizona Genetics Core Facility. Four RNA-seq libraries, each of them from each sample, were obtained, which include a total of 288,199,704 short reads with a length of 150 base pairs (bp). The resulting sequence data can be accessed at the Sequence Read Archive (SRA) repository of the NCBI through the BioProject ID PRJNA1030439. Libraries are named corresponding to the names of samples M1, M2, M3, and M4.

    FastQC software (www.bioinformatics.babraham.ac.uk/projects/fastqc) was used for short reads quality analysis. Short reads with poor quality were trimmed or eliminated by Trimmomatic (www.usadellab.org/cms/?page=trimmomatic) with a trailing and leading of 25, a sliding window of 4:25, and a minimum read length of 80 bp. A total of 243,194,888 reads with at least a 25 quality score on the Phred scale were used to carry out the de novo assembly by Trinity (https://github.com/trinityrnaseq/trinityrnaseq/wiki) with the following parameters: minimal k-mer coverage of 1, normalization of 50, and minimal transcript length of 200 bp.

    Removal of contaminating sequences and ribosomal RNA (rRNA) was carried out through SeqClean. To remove redundancy, transcripts with equal or more than 90% of identity were merged through CD-hit (www.bioinformatics.org/cd-hit/). Alignment and quantification in terms of transcripts per million (TPM) were carried out through Bowtie (https://bowtie-bio.sourceforge.net/index.shtml) and RSEM (https://github.com/deweylab/RSEM), respectively. Transcripts showing a low expression (TPM < 0.01) were discarded. Assembly quality was evaluated by calculating the parameters N50 value, mean transcript length, TransRate score, and completeness. The statistics of the transcriptome were determined by TrinityStats and TransRate (https://hibberdlab.com/transrate/). The transcriptome completeness was determined through a BLASTn alignment (E value < 1 × 10⁻³) by BUSCO (https://busco.ezlab.org/) against the database of conserved orthologous genes from Embryophyte.

    To predict the proteins tentatively coded in the S. thurberi transcriptome, the best homology match of the assembled transcripts was found by alignment to the Swiss-Prot, RefSeq, nr-NCBI, PlantTFDB, iTAK, TAIR, and ITAG databases using the BLAST algorithm with an E value threshold of 1 × 10⁻¹⁰ for the nr-NCBI database and of 1 × 10⁻⁵ for the others[3134]. An additional alignment was carried out to the protein databases of commercial fruits Persea americana, Prunus persica, Fragaria vesca, Citrus cinensis, and Vitis vinifera to proteins of the cactus Opuntia streptacantha, and the transcriptomes of the cactus Hylocereus polyrhizus, Pachycereus pringlei, and Selenicereus undatus. The list of all databases and the database websites of commercial fruits and cactus are provided in Supplementary Tables S1 & S2. The open reading frame (ORF) of the transcripts and the protein sequences tentative coded from the sweet pitaya transcriptome was predicted by TransDecoder (https://github.com/TransDecoder/TransDecoder/wiki), considering a minimal ORF length of 75 amino acids (aa). The search for protein domains was carried out by the InterPro database (www.ebi.ac.uk/interpro). Functional categorization was carried out by Blast2GO based on GO terms and KEGG metabolic pathways[35].

    LncRNA were identified based on the methods reported in previous studies[25,29,36]. Transcripts without homology to any protein from Swiss-Prot, RefSeq, nr-NCBI, PlantTFDB, iTAK, TAIR, ITAG, P. americana, P. persica, F. vesca, C. cinensis, V. vinifera, and O. streptacantha databases, without a predicted ORF longer than 75 aa, and without protein domains in the InterPro database were selected to identify tentative lncRNA.

    Transcripts coding for signal peptide or transmembrane helices were identified by SignalP (https://services.healthtech.dtu.dk/services/SignalP-6.0/) and TMHMM (https://services.healthtech.dtu.dk/services/TMHMM-2.0/), respectively, and discarded. Further, transcripts corresponding to other non-coding RNAs (ribosomal RNA and transfer RNA) were identified through Infernal by using the Rfam database[37] and discarded. The remaining transcripts were analyzed by CPC[38], and CPC2[39] to calculate their coding potential. Transcripts with a coding potential score lower than −1 for CPC and a coding probability lower than 0.1 for CPC2 were considered lncRNA. To characterize the identified lncRNA, the length and abundance of coding and lncRNA were calculated. Bowtie and RSEM were used to align and quantify raw counts, respectively. The edgeR package[40] was used to normalize raw count data in terms of counts per million (CPM) for both coding and lncRNA.

    To obtain the transcript's expression, the aligning of short reads and quantifying of transcripts were carried out through Bowtie and RSEM software, respectively. A differential expression analysis was carried out between the four libraries by edgeR package in R Studio. Only the transcripts with a count equal to or higher than 0.5 in at least one sample were retained for the analysis. Transcripts with log2 Fold Change (log2FC) between +1 and −1 and with a False Discovery Rate (FDR) lower than 0.05 were taken as not differentially expressed (NDE).

    For the identification of the tentative reference genes two strategies were carried out as described below: i) The NDE transcripts were aligned by BLASTn (E value < 1 × 10⁻⁵) to 43 constitutive genes previously reported in fruits from the cactus H. polyrhizus, S. monacanthus, and S. undatus[4143] to identify possible homologous constitutive genes in S. thurberi. Then, the homologous transcripts with the minimal coefficient of variation (CV) were selected; ii) For all the NDE transcripts, the percentile 95 value of the mean CPM and the percentile 5 value of the CV were used as filters to recover the most stably expressed transcripts, based on previous studies[44]. Finally, transcripts to be tested by quantitative reverse transcription polymerase chain reaction (qRT-PCR) were selected based on their homology and tentative biological function.

    The fruit harvesting was carried out as described above. Sweet pitaya fruit takes about 43 d to ripen, therefore, open flowers were tagged, and fruits with 10, 20, 30, 35, and 40 DAF were collected to cover the pitaya fruit development process (Supplementary Fig. S1). The superficial part of the peels (~1 mm deep) was removed carefully from the fruits using a scalpel. Peel samples from three fruits were pooled according to their stage of development defined by their DAF, frozen in liquid nitrogen, and pulverized to create a single biological replicate. One biological replicate consisted of peels from three fruits belonging to the same plant. Two to three biological replicates were evaluated for each developmental stage. Two technical replicates were analyzed for each biological replicate. RNA extraction, quantification, RNA purity, and RNA integrity analysis were carried out as described above.

    cDNA was synthesized from 100 ng of RNA by QuantiTect Reverse Transcription Kit (QIAGEN). Primers were designed using the PrimerQuest™, UNAFold, and OligoAnalyzer™ tools from Integrated DNA Technologies (www.idtdna.com/pages) and following the method proposed by Thornton & Basu[45]. Transcripts quantification was carried out in a QIAquant 96 5 plex according to the PowerUp™ SYBR™ Green Master Mix protocol (Applied Biosystems), with a first denaturation step for 2 min at 95 °C, followed by 40 cycles of denaturation step at 95 °C for 15 s, annealing and extension steps for 30 s at 60 °C.

    The Cycle threshold (Ct) values obtained from the qRT-PCR were analyzed through the algorithms BestKeeper, geNorm, NormFinder, and the delta Ct method[46]. RefFinder (www.ciidirsinaloa.com.mx/RefFinder-master/) was used to integrate the stability results and to find the most stable expressed transcripts in sweet pitaya fruit peel during development. The pairwise variation value (Vn/Vn + 1) was calculated through the geNorm algorithm in R Studio software[47].

    An alignment of 17 reported cuticle biosynthesis genes from model plants were carried out by BLASTx against the predicted proteins from sweet pitaya. Two additional alignments of 17 charaterized cuticle biosynthesis proteins from model plants against the transcripts and predicted proteins of sweet pitaya were carried out by tBLASTn and BLASTp, respectively. An E value threshold of 1 × 10⁻⁵ was used, and the unique best hits were recovered for all three alignments. The sequences of the 17 characterized cuticle biosynthesis genes and proteins from model plants are showed in Supplementary Table S3. The specific parameters and the unique best hits for all the alignments carried out are shown in Supplementary Tables S4S8.

    Cuticle biosynthesis-related transcripts tentatively coding for a cytochrome p450 family 77 subfamily A (CYP77A), a Gly-Asp-Ser-Leu motif lipase/esterase 1 (GDSL1), and an ATP binding cassette transporter subfamily G member 11 (ABCG11) were identified by best bi-directional hit according to the functional annotation described above. Protein-conserved domains, signal peptide, and transmembrane helix were predicted through InterProScan, SignalP 6.0, and TMHMM, respectively. Alignment of the protein sequences to tentative orthologous of other plant species was carried out by the MUSCLE algorithm[48]. A neighbor-joining (NJ) phylogenetic tree with a bootstrap of 1,000 replications was constructed by MEGA11[49].

    Fruit sampling, primer design, RNA extraction, cDNA synthesis, and transcript quantification were performed as described above. Relative expression was calculated according to the 2−ΔΔCᴛ method[50]. The sample corresponding to 10 DAF was used as the calibrator. The transcripts StEF1a, StTUA, StUBQ3, and StEF1a + StTUA were used as normalizer genes.

    Normality was assessed according to the Shapiro-Wilk test. Significant differences in the expression of the cuticle biosynthesis-related transcripts between fruit developmental stages were determined by one-way ANOVA based on a completely randomized sampling design and a Tukey honestly significant difference (HSD) test, considering a p-value < 0.05 as significant. Statistical analysis was carried out through the stats package in R Studio.

    RNA was extracted from the peels of ripe sweet pitaya fruits (S. thurberi) from plants located in the Sonoran Desert, Mexico. Four cDNA libraries were sequenced in an Illumina NextSeq 500 platform at the University of Arizona Genetics Core Facility. A total of 288,199,704 reads with 150 base pairs (bp) in length were sequenced in paired-end mode. After trimming, 243,194,888 (84.38%) cleaned short reads with at least 29 mean quality scores per read in the Phred scale and between 80 to 150 bp in length were obtained to carry out the assembly. After removing contaminating sequences, redundancy, and low-expressed transcripts, the assembly included 174,449 transcripts with an N50 value of 2,110 bp. Table 1 shows the different quality variables of the S. thurberi fruit peel transcriptome. BUSCO score showed that 85.4% are completed transcripts, although out of these, 37.2% were found to be duplicated. The resulting sequence data can be accessed at the SRA repository of the NCBI through the BioProject ID PRJNA1030439.

    Table 1.  Quality metrics of the Stenocereus thurberi fruit peel transcriptome.
    Metric Data
    Total transcripts 174,449
    N50 2,110
    Smallest transcript length (bp) 200
    Largest transcript length (bp) 19,114
    Mean transcript length (bp) 1,198.69
    GC (%) 41.33
    Total assembled bases 209,110,524
    TransRate score 0.05
    BUSCO score (%) C: 85.38 (S:48.22, D:37.16),
    F: 10.69, M: 3.93.
    Values were calculated through the TrinityStats function of Trinity and TransRate software. Completeness analysis was carried out through BUSCO by aligning the transcriptome to the Embryophyte database through BLAST with an E value threshold of 1 × 10⁻³. Complete (C), single (S), duplicated (D), fragmented (F), missing (M).
     | Show Table
    DownLoad: CSV

    A summary of the homology search in the main public protein database for the S. thurberi transcriptome is shown in Supplementary Table S1. From these databases, the higher homologous transcripts were found in RefSeq with 93,993 (53.87 %). Based on the E value distribution, for 41,685 (44%) and 68,853 (49%) of the hits, it was found a strong homology (E value lower than 1 × 10−50) to proteins in the Swiss-Prot and RefSeq databases, respectively (Supplementary Fig. S2a & b). On the other hand, 56,539 (52.34%) and 99,599 (71.11%) of the matches showed a percentage of identity higher than 60% in the Swiss-Prot and RefSeq databases, respectively (Supplementary Fig. S2c & d).

    Figure 1 shows the homology between transcripts from S. thurberi and proteins of commercial fruits, as well as proteins and transcripts of cacti. Transcripts from S. thurberi homologous to proteins from fruits of commercial interest avocado (P. americana), peach (P. persica), strawberry (F. vesca), orange (C. sinensis), and grapefruit (V. vinifera) ranged from 77,285 (44.30%) to 85,421 (48.96%), with 70,802 transcripts homologous to all the five fruit protein databases (Fig. 1a).

    Transcripts homologous to transcripts or proteins from the cactus dragon fruit (H. polyrhizus), prickly pear cactus (O. streptacantha), Mexican giant cardon (P. pringlei), and pitahaya (S. undatus) ranged from 76,238 (43.70%) to 114,933 (65.88%), with 64,009 transcripts homologous to all the four cactus databases (Fig. 1b). Further, out of the total of transcripts, 44,040 transcripts (25.25%) showed homology only to sequences from cactus, but not for model plants Arabidopsis, tomato, or the commercial fruits included in this study (Fig. 1c).

    Figure 1.  Venn diagram of the homology search results against model plants databases, commercial fruits, and cactus. The number in the diagram corresponds to the number of transcripts from S. thurberi homologous to sequences from that plant species. (a) Homologous to sequences from Fragaria vesca (Fa), Persea americana (Pa), Prunus persica (Pp), Vitis vinifera (Vv), and Citrus sinensis (Cs). (b) Homologous to sequences from Opuntia streptacantha (Of), Selenicereus undatus (Su), Hylocereus polyrhizus (Hp), and Pachycereus pringlei (Pap). (c) Homologous to sequences from Solanum lycopersicum (Sl), Arabidopsis thaliana (At), from the commercial fruits (Fa, Pa, Pp, Vv, and Cs), or the cactus included in this study (Of, Su, Hp, and Pap). Homologous searching was carried out by BLAST alignment (E value < 1 × 10⁻⁵). The Venn diagrams were drawn by ggVennDiagram in R Studio.

    A total of 45,970 (26.35%), 58,704 (33.65%), and 48,186 (27.65%) transcripts showed homology to transcription factors, transcriptional regulators, and protein kinases in the PlantTFDB, iTAK-TR, and iTAK-PK databases, respectively (Supplementary Tables S1, S9S11). For the PlantTFDB, the homologous transcripts belong to 57 transcriptional factors (TF) families (Fig. 2 & Supplementary Table S9), from which, the most frequent were the basic-helix-loop-helix (bHLH), myeloblastosis-related (MYB-related), NAM, ATAF, and CUC (NAC), ethylene responsive factor (ERF), and the WRKY domain families (WRKY) (Fig. 2).

    Figure 2.  Transcription factor (TF) families distribution of S. thurberi fruit peel transcriptome. The X-axis indicates the number of transcripts with hits to each TF family. Alignment to the PlantTFDB database by BLASTx was carried out with an E value threshold of 1 × 10⁻⁵. The bar graph was drawn by ggplot2 in R Studio.

    Based on the homology found and the functional domain searches, gene ontology terms (GO) were assigned to 68,559 transcripts (Supplementary Table S12). Figure 3 shows the top 20 GO terms assigned to the S. thurberi transcriptome, corresponding to the Biological Processes (BP) and Molecular Function (MF) categories. For BP, organic substance metabolic processes, primary metabolic processes, and cellular metabolic processes showed a higher number of transcripts (Supplementary Table S13). Further, for MF, organic cyclic compound binding, heterocyclic compound binding, and ion binding were the processes with the higher number of transcripts. S. thurberi transcripts were classified into 142 metabolic pathways from the KEGG database (Supplementary Table S14). The pathways with the higher number of transcripts recorded were pyruvate metabolism, glycerophospholipid metabolism, glycolysis/gluconeogenesis, and citrate cycle. Further, among the top 20 KEEG pathways, the cutin, suberin, and wax biosynthesis include more than 30 transcripts (Fig. 4).

    Figure 3.  Top 20 Gene Ontology (GO) terms assigned to the S. thurberi fruit peel transcriptome. Bars indicate the number of transcripts assigned to each GO term. Assignment of GO terms was carried out by Blast2GO with default parameters. BP and MF mean Biological Processes and Molecular Functions GO categories, respectively. The graph was drawn by ggplot2 in R Studio.
    Figure 4.  Top 20 KEGG metabolic pathways distribution in the S. thurberi fruit peel transcriptome. Bars indicate the number of transcripts assigned to each KEGG pathway. Assignment of KEGG pathways was carried out in the Blast2GO suite. The bar graph was drawn by ggplot2 in R Studio.

    Out of the total of transcripts, 43,391 (24.87%) were classified as lncRNA (Supplementary Tables S15 & S16). Figure 5 shows a comparison of the length (Fig. 5a) and expression (Fig. 5b) of lncRNA and coding RNA. Both length and expression values were higher in coding RNA than in lncRNA. In general, coding RNA ranged from 201 to 18,629 bp with a mean length of 1,507.18, whereas lncRNA ranged from 200 to 5,198 bp with a mean length of 481.51 (Fig. 5a). The higher expression values recorded from coding RNA and lncRNA were 12.83 and 9.45 log2(CPM), respectively (Fig. 5b).

    Figure 5.  Comparison of coding RNA and long non-coding RNA (lncRNA) from S. thurberi transcriptome. (a) Box plot of transcript length distribution. The Y-axis indicates the length of each transcript in base pairs. (b) Box plot of expression levels. The Y-axis indicates the log2 of the count per million of reads (log2(CPM)) recorded for each transcript. Expression levels were calculated by the edgeR package in R studio. (a), (b) The lines inside the boxes indicate the median. The higher and lower box limits represent the 75th and 25th percentiles, respectively. The box plots were drawn by ggplot2 in R Studio.

    To identify the transcripts without significant changes in expression between the four RNA-seq libraries, a differential expression analysis was carried out. Of the total of transcripts, 4,980 were not differentially expressed (NDE) at least in one paired comparison between the libraries (Supplementary Tables S17S20). Mean counts per million of reads (CPM) and coefficient of variation (CV)[44] were calculated for these NDE transcripts. Transcripts with a CV value lower than 0.113, corresponding with the percentile 5 of the CV, and a mean CPM higher than 1,138.06, corresponding with the percentile 95 of the mean CPM were used as filters to identify the most stably expressed transcripts (Supplementary Table S21). Based on its homology and its tentative biological function, five transcripts were selected to be tested as tentative reference genes. Besides, three NDE transcripts homologous to previously identified stable expressed reference genes in other species of cactus fruit[4143] were selected (Supplementary Table S22). Homology metrics for the eight tentative reference genes selected are shown in Supplementary Table S23. The primer sequences used to amplify the transcripts by qRT-PCR and their nucleotide sequence are shown in Supplementary Tables S24 & S25, respectively.

    The amplification specificity of the eight candidate reference genes determined by melting curves analysis is shown in Supplementary Fig. S3. For the eight tentative reference transcripts selected, the cycle threshold (Ct) values were recorded during sweet pitaya fruit development by qRT-PCR (Supplementary Table S26). The Ct values obtained ranged from 16.85 to 30.26 (Fig. 6a). Plastidic ATP/ADP-transporter (StTLC1) showed the highest Ct values with a mean of 27.34 (Supplementary Table S26). Polyubiquitin 3 (StUBQ3) showed the lowest Ct values in all five sweet pitaya fruit developmental stages (Fig. 6a).

    Figure 6.  Expression stability analysis of tentative reference genes. (a) Box plot of cycle threshold (Ct) distribution of candidate reference genes during sweet pitaya fruit development (10, 20, 30, 35, and 40 d after flowering). The black line inside the box indicates the median. The higher and lower box limits represent the 75th and 25th percentiles, respectively. (b) Bar chart of the geometric mean (geomean) of ranking values calculated by RefFinder for each tentative reference gene (X-axis). The lowest values indicate the best reference genes. (c) Bar chart of the pairwise variation analysis and determination of the optimal number of reference genes by the geNorm algorithm. A pairwise variation value lower than 0.15 indicates that the use of Vn/Vn + 1 reference genes is reliable for the accurate normalization of qRT-PCR data. The Ct data used in the analysis were calculated by qRT-PCR in a QIAquant 96 5 plex (QIAGEN) according to the manufacturer's protocol. The box plot and the bar graphs were drawn by ggplot2 and Excel programs, respectively. Abbreviations: Actin 7 (StACT7), alpha-tubulin (StTUA), elongation factor 1-alpha (StEF1a), COP1-interactive protein 1 (StCIP1), plasma membrane ATPase 4 (StPMA4), BEL1-like homeodomain protein 1 (StBLH1), polyubiquitin 3 (StUBQ3), and plastidic ATP/ADP-transporter (StTLC1).

    The best stability values calculated by NormFinder were 0.45, 0.51, 0.97, and 0.99, corresponding to the transcripts elongation factor 1-alpha (StEF1a), alpha-tubulin (StTUA), plastidic ATP/ADP-transporter (StTLC1), and actin 7 (StACT7), respectively (Supplementary Table S27). For BestKeeper, the most stable expressed transcripts were StUBQ3, StTUA, and StEF1a, with values of 0.72, 0.75, and 0.87, respectively. In the case of the delta Ct method[51], the transcripts StEF1a, StTUA, and StTLC1 showed the best stability.

    According to geNorm analysis, the most stable expressed transcripts were StTUA, StEF1a, StUBQ3, and StACT7, with values of 0.74, 0.74, 0.82, and 0.96, respectively. All the pairwise variation values (Vn/Vn + 1) were lower than 0.15, ranging from 0.019 for V2/V3 to 0.01 for V6/V7 (Fig. 6c). The V value of 0.019 obtained for V2/V3 indicates that the use of the best two reference genes StTUA and StEF1a is reliable enough for the accurate normalization of qRT-PCR data, therefore no third reference gene is required[47]. Except for BestKeeper analysis, StEF1a and StTUA were the most stable transcripts for all of the methods carried out in this study (Supplementary Table S27). The comprehensive ranking analysis indicates that StEF1a, followed by StTUA and StUBQ3, are the most stable expressed genes and are stable enough to be used as reference genes in qRT-PCR analysis during sweet pitaya fruit development (Fig. 6b).

    Three cuticle biosynthesis-related transcripts TRINITY_DN17030_c0_g1_i2, TRINITY_DN15394_c0_g1_i1, and TRINITY_DN23528_c1_g1_i1 tentatively coding for the enzymes cytochrome p450 family 77 subfamily A (CYP77A), Gly-Asp-Ser-Leu motif lipase/esterase 1 (GDSL1), and an ATP binding cassette transporter subfamily G member 11 (ABCG11/WBC11), respectively, were identified and quantified. The nucleotide sequence and predicted amino acid sequences of the three transcripts are shown in Supplementary File 1. The best homology match for StCYP77A (TRINITY_DN17030_c0_g1_i2) was for AtCYP77A4 (AT5G04660) from Arabidopsis and SmCYP77A2 (P37124) from eggplant (Solanum melongena) in the TAIR and Swiss-Prot databases, respectively (Supplementary Table S23).

    TransDecoder, InterPro, and TMHMM analysis showed that StCYP77A codes a polypeptide of 518 amino acids (aa) in length that comprises a cytochrome P450 E-class domain (IPR002401) and a transmembrane region (residues 10 to 32). The phylogenetic tree constructed showed that StCYP77A is grouped in a cluster with all the CYP77A2 proteins included in this analysis, being closer to CYP77A2 (XP_010694692) from B. vulgaris and Cgig2_012892 (KAJ8441854) from Carnegiea gigantean (Supplementary Fig. S4).

    StGDSL1 (TRINITY_DN15394_c0_g1_i1) alignment showed that it is homologous to a GDSL esterase/lipase from Arabidopsis (Q9LU14) and tomato (Solyc03g121180) (Supplementary Table S23). TransDecoder, InterPro, and SignalP analysis showed that StGDSL1 codes a polypeptide of 354 aa in length that comprises a GDSL lipase/esterase domain IPR001087 and a signal peptide with a cleavage site between position 25 and 26 (Supplementary Fig. S5).

    Supplementary Figure S6 shows the analysis carried out on the predicted amino acid sequence of StABCG11 (TRINITY_DN23528_c1_g1_i1). The phylogenetic tree constructed shows three clades corresponding to the ABCG13, ABCG12, and ABCG11 protein classes with bootstrap support ranging from 40% to 100% (Supplementary Fig. S6a). StABCG11 is grouped with all the ABCG11 transporters included in this study in a well-separated clade, being closely related to its tentative ortholog from C. gigantean Cgig2_004465 (KAJ8441854). InterPro and TMHMM results showed that the StABCG11 sequence contains an ABC-2 type transporter transmembrane domain (IPR013525; PF01061.27) with six transmembrane helices (Supplementary Fig. S6b).

    The predicted protein sequence of StABCG11 is 710 aa in length, holding the ATP binding domain (IPR003439; PF00005.30) and the P-loop containing nucleoside triphosphate hydrolase domain (IPR043926; PF19055.3) of the ABC transporters of the G family. Multiple sequence alignment shows that the Walker A and B motif sequence and the ABC signature[15] are conserved between the ABCG11 transporters from Arabidopsis, tomato, S. thurberi, and C. gigantean (Supplementary Fig. S6c).

    According to the results of the expression stability analysis (Fig. 6), four normalization strategies were tested to quantify the three cuticle biosynthesis-related transcripts during sweet pitaya fruit development. The four strategies consist of normalizing by StEF1a, StTUA, StUBQ3, or StEF1a+StTUA. Primer sequences used to quantify the transcripts StCYP77A (TRINITY_DN17030_c0_g1_i2), StGDSL1 (TRINITY_DN15394_c0_g1_i1), and StABCG11 (TRINITY_DN23528_c1_g1_i1) by qRT-PCR during sweet pitaya fruit development are shown in Supplementary Table S24.

    The three cuticle biosynthesis-related transcripts showed differences in expression during sweet pitaya fruit development (Supplementary Table S28). The same expression pattern was recorded for the three cuticle biosynthesis transcripts when normalization was carried out by StEF1a, StTUA, StUBQ3, or StEF1a + StTUA (Fig. 7). A higher expression of StCYP77A and StGDSL1 are shown at the 10 and 20 DAF, showing a decrease at 30, 35, and 40 DAF. StABCG11 showed a similar behavior, with a higher expression at 10 and 20 DAF and a reduction at 30 and 35 DAF. Nevertheless, unlike StCYP77A and StGDSL1, a significant increase at 40 DAF, reaching the same expression as compared with 10 DAF, is shown for StABCG11 (Fig. 7).

    Figure 7.  Expression analysis of cuticle biosynthesis-related transcripts StCYP77A, StGDSL1, and StABCG11 during sweet pitaya (Stenocereus thurberi) fruit development. Relative expression was calculated through the 2−ΔΔCᴛ method using elongation factor 1-alpha (StEF1a), alpha-tubulin (StTUA), polyubiquitin 3 (StUBQ3), or StEF1a + StTUA as normalizing genes at 10, 20, 30, 35, and 40 d after flowering (DAF). The Y-axis and error bars represent the mean of the relative expression ± standard error (n = 4−6) for each developmental stage in DAF. The Ct data for the analysis was recorded by qRT-PCR in a QIAquant 96 5 plex (QIAGEN) according to the manufacturer's protocol. The graph line was drawn by ggplot2 in R Studio. Abbreviations: cytochrome p450 family 77 subfamily A (StCYP77A), Gly-Asp-Ser-Leu motif lipase/esterase 1 (StGDSL1), and ATP binding cassette transporter subfamily G member 11 (StABCG11).

    Characteristics of a well-assembled transcriptome include an N50 value closer to 2,000 bp, a high percentage of conserved transcripts completely assembled (> 80%), and a high proportion of reads mapping back to the assembled transcripts[52]. In the present study, the first collection of 174,449 transcripts from S. thurberi fruit peel are reported. The generated transcriptome showed an N50 value of 2,110 bp, a TransRate score of 0.05, and a GC percentage of 41.33 (Table 1), similar to that reported for other de novo plant transcriptome assemblies[53]. According to BUSCO, 85.4% of the orthologous genes from the Embryophyta databases completely matched the S. thurberi transcriptome, and only 3.9% were missing (Table 1). These results show that the S. thurberi transcriptome generated is not fragmented, and it is helpful in predicting the sequence of almost all the transcripts expressed in sweet pitaya fruit peel[24].

    The percentage of transcripts homologous found, E values, and identity distribution (Supplementary Tables S1 & S2; Supplementary Fig. S2) were similar to that reported in the de novo transcriptome assembly for non-model plants and other cactus fruits[4143,54] and further suggests that the transcriptome assembled of S. thurberi peel is robust[52]. Of the total of transcripts, 70,802 were common to all the five commercial fruit protein databases included in this study, which is helpful for the search for conserved orthologous involved in fruit development and ripening (Fig. 2a). A total of 34,513 transcripts (20%) show homology only to sequences in the cactus's databases, but not in the others (Supplementary Tables S1 & S2; Fig. 1c). This could suggest that a significant conservation of sequences among plants of the Cactaceae family exists which most likely are to have a function in this species adaptation to desert ecosystems.

    To infer the biological functionality represented by the S. thurberi fruit peel transcriptome, gene ontology (GO) terms and KEGG pathways were assigned. Of the main metabolic pathways assigned, 'glycerolipid metabolism' and 'cutin, suberine, and wax biosynthesis' suggests an active cuticle biosynthesis in pitaya fruit peel (Fig. 4). In agreement with the above, the main GO terms assigned for the molecular function (MF) category were 'organic cyclic compound binding', 'transmembrane transporter activity', and 'lipid binding' (Fig. 3). For the biological processes (BP) category, the critical GO terms for the present research are 'cellular response to stimulus', 'response to stress', 'anatomical structure development', and 'transmembrane transport', which could suggest the active development of the fruit epidermis and cuticle biosynthesis for protection to stress.

    The most frequent transcription factors (TF) families found in S. thurberi transcriptome were NAC, WRKY, bHLH, ERF, and MYB-related (Fig. 2), which had been reported to play a function in the tolerance to abiotic stress in plants[55,56]. Although the role of NAC, WRKY, bHLH, ERF, and MYB TF in improving drought tolerance in relevant crop plants has been widely documented[57,58], their contribution to the adaptation of cactus to arid ecosystems has not yet been elucidated and further experimental pieces of evidence are needed.

    It has been reported that the heterologous expression of ERF TF from Medicago truncatula induces drought tolerance and cuticle wax biosynthesis in Arabidopsis leaf[59]. In tomato fruits, the gene SlMIXTA-like which encodes a MYB transcription factor avoids water loss through the positive regulation of genes related to the biosynthesis and transport of cuticle compounds[22]. Despite the relevant role of cuticles in maintaining cactus physiology in desert environments, experimental evidence showing the role of the different TF-inducing cuticle biosynthesis has yet to be reported for cactus fruits.

    Out of the transcripts, 43,391 were classified as lncRNA (Supplementary Tables S15 & S16). This is the first report of lncRNA identification for the species S. thurberi. In fruits, 3,679 lncRNA has been identified from tomato[26], 3,330 from peach (P. persica)[29], 3,857 from melon (Cucumis melo)[28], 2,505 from hot pepper (Capsicum annuum)[27], and 3,194 from pomegranate (Punica granatum)[36]. Despite the stringent criteria to classify the lncRNA of sweet pitaya fruit (S. thurberi), a higher number of lncRNAs are shown when compared with previous reports. This finding is most likely due to the higher level of redundancy found during the transcriptome analysis. To reduce this redundancy, further efforts to achieve the complete genome assembly of S. thurberi are needed.

    Previous studies showed that lncRNA is shorter and has lower expression levels than coding RNA[6062]. In agreement with those findings, both the length and expression values of lncRNA from S. thurberi were lower than coding RNA (Fig. 5). It has been suggested that lncRNA could be involved in the biosynthesis of cuticle components in cabbage[61] and pomegranate[36] and that they could be involved in the tolerance to water deficit through the regulation of cuticle biosynthesis in wild banana[60]. Nevertheless, the molecular mechanism by which lncRNA may regulate the cuticle biosynthesis in S. thurberi fruits has not yet been elucidated.

    A relatively constant level of expression characterizes housekeeping genes because they are involved in essential cellular functions. These genes are not induced under specific conditions such as biotic or abiotic stress. Because of this, they are very useful as internal reference genes for qRT-PCR data normalization[63]. Nevertheless, their expression could change depending on plant species, developmental stages, and experimental conditions[64]. Reliable reference genes for a specific experiment in a given species must be identified to carry out an accurate qRT-PCR data normalization[63]. An initial screening of the transcript expression pattern through RNA-seq improves the identification of stably expressed transcripts by qRT-PCR[44,64].

    Identification of stable expressed reference transcripts during fruit development has been carried out in blueberry (Vaccinium bracteatum)[65], kiwifruit (Actinidia chinensis)[66], peach (P. persica)[67], apple (Malus domestica)[68], and soursop (Annona muricata)[69]. These studies include the expression stability analysis through geNorm, NormFinder, and BestKeeper algorithms[68,69], some of which are supported in RNA-seq data[65,66]. Improvement of expression stability analysis by RNA-seq had led to the identification of non-previously reported reference genes with a more stable expression during fruit development than commonly known housekeeping genes in grapevine (V. vinifera)[44], pear (Pyrus pyrifolia and P. calleryana)[64], and pepper (C. annuum)[70].

    For fruits of the Cactaceae family, only a few studies identifying reliable reference genes have been reported[4143]. Mainly because gene expression analysis has not been carried out previously for sweet pitaya (S. thurberi), the RNA-seq data generated in this work along with geNorm, NormFinder, BestKeeper, and RefFinder algorithms were used to identify reliable reference genes. The comprehensive ranking analysis showed that out of the eight candidate genes tested, StEF1a followed by StTUA and StUBQ3 were the most stable (Fig. 6b). All the pairwise variation values (Vn/Vn + 1) were lower than 0.15 (Fig. 6c), which indicates that StEF1a, StTUA, and StUBQ3 alone or the use of StEF1a and StTUA together are reliable enough to normalize the gene expression data generated by qRT-PCR.

    The genes StEF1a, StTUA, and StUBQ3 are homologous to transcripts found in the cactus species known as dragonfruit (Hylocereus monacanthus and H. undatus)[41], which have been tested as tentative reference genes during fruit development. EF1a has been proposed as a reliable reference gene in the analysis of changes in gene expression of dragon fruit (H. monacanthus and H. undatus)[41], peach (P. persica)[67], apple (M. domestica)[68], and soursop (A. muricata)[69]. According to the expression stability analysis carried out in the present study (Fig. 6) four normalization strategies were designed. The same gene expression pattern was recorded for the three target transcripts evaluated when normalization was carried out by the genes StEF1a, StTUA, StUBQ3, or StEF1a + StTUA (Fig. 7). Further, these data indicates that these reference genes are reliable enough to be used in qRT-PCR experiments during fruit development of S. thurberi.

    The plant cuticle is formed by two main layers: the cutin, composed mainly of mid-chain oxygenated LC fatty acids, and the cuticular wax, composed mainly of very long-chain (VLC) fatty acids, and their derivates VLC alkanes, VLC primary alcohols, VLC ketones, VLC aldehydes, and VLC esters[3]. In Arabidopsis CYP77A4 and CYP77A6 catalyze the synthesis of midchain epoxy and hydroxy ω-OH long-chain fatty acids, respectively[10,11], which are the main components of fleshy fruit cuticle[3].

    The functional domain search carried out in the present study showed that StCYP77A comprises a cytochrome P450 E-class domain (IPR002401) and a membrane-spanning region from residues 10 to 32 (Supplementary Fig. S4). This membrane-spanning region has been previously characterized in CYP77A enzymes from A. thaliana and Brassica napus[11,71]. It suggests that the protein coded by StCYP77A could catalyze the oxidation of fatty acids embedded in the endoplasmic reticulum membrane of the epidermal cells of S. thurberi fruit. Phylogenetic analysis showed that StCYP77A was closer to proteins from its phylogenetic-related species B. vulgaris (BvCYP772; XP_010694692) and C. gigantea (Cgig2_012892) (Supplementary Fig. S4). StCYP77A, BvCYP77A2, and Cgig2_012892 were closer to SlCYP77A2 and SmCYP77A2 than to CYP77A4 and CYP77A6 proteins, suggesting that StCYP77A (TRINITY_DN17030_c0_g1_i2) could correspond to a CYP77A2 protein.

    Five CYP77A are present in the Arabidopsis genome, named CYP77A4, CYP77A5, CYP77A6, CYP77A7, and CYP77A9, but their role in cuticle biosynthesis has only been reported for CYP77A4 and CYP77A6[72]. It has been suggested that CYP77A2 from eggplant (S. torvum) could contribute to the defense against fungal phytopathogen infection by the synthesis of specific compounds[13]. In pepper fruit (C. annuum), the expression pattern of CYP77A2 (A0A1U8GYB0) and ABCG11 (LOC107862760) suggests a role of CYP77A2 and ABCG11 in cutin biosynthesis at the early stages of pepper fruit development[14].

    In the case of the protein encoded by StGDSL1 (354 aa), the length found in this work is similar to the length of its homologous from Arabidopsis (AT3G16370) and tomato (Solyc03g121180) (Supplementary Fig. S5). A GDSL1 protein named CD1 polymerizes midchain oxygenated ω-OH long-chain fatty acids to form the cutin polyester in the extracellular space of tomato fruit peel[20,21]. It has been suggested that the 25-amino acid N-signal peptide found in StGDSL1 (Supplementary Fig. S5), previously reported in GDSL1 from Arabidopsis, B. napus, and tomato, plays a role during the protein exportation to the extracellular space[21,73].

    A higher expression of StCYP77A, StGDSL1, and StABCG11 is shown at the 10 and 20 DAF of sweet pitaya fruit development (Fig. 7), suggesting the active cuticle biosynthesis at the early stages of sweet pitaya fruit development. In agreement with that, two genes coding for GDSL lipase/hydrolases from tomato named SGN-U583101 and SGN-U579520 are highly expressed in the early stages and during the expansion stages of tomato fruit development, but their expression decreases in later stages[74]. It has been shown that the expression of GDSL genes, like CD1 from tomato, is higher in growing fruit[20,21]. Like tomato, the increase in expression of StCYP77A and StGDSL1 shown in pitaya fruit development could be due to an increase in cuticle deposition during the expansion of the fruit epidermis[20].

    The phylogenetic analysis, the functional domains, and the six transmembrane helices found in the StABCG11 predicted protein (Supplementary Fig. S6), suggests that it is an ABCG plasma membrane transporter of sweet pitaya[15]. Indeed, an increased expression of StABCG11 at 40 DAF was recorded in the present study (Fig. 7). Further, this data strongly suggests that it could be playing a relevant role in the transport of cuticle components at the beginning and during sweet pitaya fruit ripening.

    In Arabidopsis, ABCG11 (WBC11) exports cuticular wax and cutin compounds from the plasma membrane[15,75]. It has been reported that a high expression of the ABC plasma membrane transporter from mango MiWBC11 correlates with a higher cuticle deposition during fruit development[7]. The expression pattern for StABCG11, StCYP77A, and StGDSL1 suggests a role of StABCG11 as a cutin compound transporter in the earlier stages of sweet pitaya fruit development (Fig. 7). Further, its increase at 40 DAF suggests that it could be transporting cuticle compounds other than oxygenated long-chain fatty acids, or long-chain fatty acids that are not synthesized by StCYP77A and StGDSL1 in the later stages of fruit development.

    Like sweet pitaya, during sweet cherry fruit (Prunus avium) development, the expression of PaWCB11, homologous to AtABCG11 (AT1G17840), increases at the earlier stages of fruit development decreases at the intermediate stages, and increases again at the later stages[76]. PaWCB11 expression correlated with cuticle membrane deposition at the earlier and intermediate stages of sweet cherry fruit development but not at the later[76]. The increased expression of StABCG11 found in the present study could be due to the increased transport of cuticular wax compounds, such as VLC fatty acids and their derivates, in the later stages of sweet pitaya development[15,75].

    Cuticular waxes make up the smallest amount of the fruit cuticle. Even so, they mainly contribute to the impermeability of the fruit's epidermis[3]. An increase in the transport of cuticular waxes at the beginning of the ripening stage carried out by ABCG transporters could be due to a greater need to avoid water loss and to maintain an adequate amount of water during the ripening of the sweet pitaya fruit. Nevertheless, further expression analysis of cuticular wax biosynthesis-related genes, complemented with chemical composition analysis of cuticles could contribute to elucidating the molecular mechanism of cuticle biosynthesis in cacti and their physiological contribution during fruit development.

    In this study, the transcriptome of the sweet pitaya (S. thurberi) fruit peel was assembled for the first time. The reference genes found here are a helpful tool for further gene expression analysis in sweet pitaya fruit. Transcripts tentatively involved in cuticle compound biosynthesis and transport are reported for the first time in sweet pitaya. The results suggest a relevant role of cuticle compound biosynthesis and transport at the early and later stages of fruit development. The information generated will help to improve the elucidation of the molecular mechanism of cuticle biosynthesis in S. thurberi and other cactus species in the future. Understanding the cuticle's physiological function in the adaptation of the Cactaceae family to harsh environmental conditions could help design strategies to increase the resistance of other species to face the increase in water scarcity for agricultural production predicted for the following years.

    The authors confirm contribution to the paper as follows: study conception and design: Tiznado-Hernández ME, Tafolla-Arellano JC, García-Coronado H, Hernández-Oñate MÁ; data collection: Tiznado-Hernández ME, Tafolla-Arellano JC, García-Coronado H, Hernández-Oñate MÁ; analysis and interpretation of results: Tiznado-Hernández ME, García-Coronado H, Hernández-Oñate MÁ, Burgara-Estrella AJ; draft manuscript preparation: Tiznado-Hernández ME, García-Coronado H. All authors reviewed the results and approved the final version of the manuscript.

    All data generated or analyzed during this study are included in this published article and its supplementary information files. The sequence data can be accessed at the Sequence Read Archive (SRA) repository of the NCBI through the BioProject ID PRJNA1030439.

    The authors wish to acknowledge the financial support of Consejo Nacional de Humanidades, Ciencias y Tecnologías de México (CONAHCYT) through project number 579: Elucidación del Mecanismo Molecular de Biosíntesis de Cutícula Utilizando como Modelo Frutas Tropicales. We appreciate the University of Arizona Genetics Core and Illumina for providing reagents and equipment for library sequencing. The author, Heriberto García-Coronado (CVU 490952), thanks the CONAHCYT (acronym in Spanish) for the Ph.D. scholarship assigned (749341). The author, Heriberto García-Coronado, thanks Dr. Edmundo Domínguez-Rosas for the technical support in bioinformatics for identifying long non-coding RNA.

  • The authors declare that they have no conflict of interest.

  • Supplemental Fig. S1 Neighbor-joining tree based on Nei's (1983) genetic distance for V. mangachapoi.
    Supplemental Table S1 Analysis of molecular variance (AMOVA) for the three V. mangachapoi populations.
  • [1]

    Ghazoul J. 2016. Dipterocarp Biology, Ecology, and Conservation. 1st Edition. UK: Oxford University Press. https://doi.org/10.1093/acprof:oso/9780199639656.001.0001

    [2]

    Ashton PS. 1988. Dipterocarp biology as a window to the understanding of tropical forest structure. Annual Review of Ecology and Systematics 19:347−70

    doi: 10.1146/annurev.es.19.110188.002023

    CrossRef   Google Scholar

    [3]

    Sodhi NS, Posa MRC, Lee TM, Bickford D, Koh LP, et al. 2010. The state and conservation of Southeast Asian biodiversity. Biodiversity and Conservation 19:317−28

    doi: 10.1007/s10531-009-9607-5

    CrossRef   Google Scholar

    [4]

    Edwards DP, Tobias JA, Sheil D, Meijaard E, Laurance WF. 2014. Maintaining ecosystem function and services in logged tropical forests. Trends in Ecology and Evolution 29:511−20

    doi: 10.1016/j.tree.2014.07.003

    CrossRef   Google Scholar

    [5]

    Hu YJ, Li YX. 1992. The Tropical of Rain Forest of Hainan Island. 1st Edition. Guangdong, China: Guangdong Higher Education Press

    [6]

    Hu YJ. 1983. The phytocoenological features and types of Dipterocap forest in Hainan island. Ecological Science 2:16−24

    Google Scholar

    [7]

    Xu H, Li YD, Luo SS, Chen DX, Lin MX. 2007. Review of Vatica mangachapoi, a national key protected plant on Hainan Island. Tropical Forestry 35:8−11

    Google Scholar

    [8]

    Liang SQ, Lin Y, Yang XB, Huang SM, Fu SX, et al. 1993. The Vatica hainanensis Forest of Li Ji, Wan Ning County, Hainan Island. Natural Science Journal of Hainan University 11:1−9

    Google Scholar

    [9]

    Yang XB, Hu RG. 2000. The floral components and soil properties of forest on the tropical sandy beach. Chinese Journal of Ecology 19:6−11

    Google Scholar

    [10]

    Hu RG, Liang SQ, Lin Y. 1995. A study on the soil properties of Vatica mangachapoi forest in Li Ji, Wan Ning County, Hainan Province. Natural Science Journal of Hainan University 13:203−10

    Google Scholar

    [11]

    Wu YH, Huang QM, Liang SQ, Lin Y. 1996. Disease and pest control of Vatica mangachapoi forest in Liji Town, Wanning City, Hainan Province. Tropical Forestry 24:47−51

    Google Scholar

    [12]

    Wang G, Zhao JM, Hao QY. 2012. Landscape fragmentation of coastal Vatica mangachapoi forest nature reserve in Shimei bay. Guangdong Agricultural Sciences 39:171−4

    Google Scholar

    [13]

    Kwak MM, Velterop O, Van Andel J. 1998. Pollen and gene flow in fragmented habitats. Applied Vegetation Science 1:37−54

    doi: 10.2307/1479084

    CrossRef   Google Scholar

    [14]

    Kolb A, Diekmann M. 2005. Effects of life-history traits on responses of plant species to forest fragmentation. Conservation Biology 19:929−38

    doi: 10.1111/j.1523-1739.2005.00065.x

    CrossRef   Google Scholar

    [15]

    Lowe AJ, Boshier D, Ward M, Bacles CFE, Navarro C. 2005. Genetic resource impacts of habitat loss and degradation; reconciling empirical evidence and predicted theory for neotropical trees. Heredity 95:255−73

    doi: 10.1038/sj.hdy.6800725

    CrossRef   Google Scholar

    [16]

    Ward M, Dick CW, Gribel R, Lowe AJ. 2005. To self, or not to self.. A review of outcrossing and pollen-mediated gene flow in neotropical trees. Heredity 95:246−54

    doi: 10.1038/sj.hdy.6800712

    CrossRef   Google Scholar

    [17]

    Vekemans X, Hardy OJ. 2004. New insights from fine-scale spatial genetic structure analyses in plant populations. Molecular Ecology 13:921−35

    doi: 10.1046/j.1365-294X.2004.02076.x

    CrossRef   Google Scholar

    [18]

    Sebbenn AM, Carvalho ACM, Freitas MLM, Moraes SMB, Gaino APSC, et al. 2011. Low levels of realized seed and pollen gene flow and strong spatial genetic structure in a small, isolated and fragmented population of the tropical tree Copaifera langsdorffii Desf. Heredity 106:134−45

    doi: 10.1038/hdy.2010.33

    CrossRef   Google Scholar

    [19]

    Suzuki E, Ashton PS. 1996. Sepal and nut size ratio of fruits of Asian Dipterocarpaceae and its implications for dispersal. Journal of Tropical Ecology 12:853−70

    doi: 10.1017/S0266467400010129

    CrossRef   Google Scholar

    [20]

    Smith JR, Bagchi R, Ellens J, Kettle CJ, Burslem DFRP, et al. 2015. Predicting dispersal of auto-gyrating fruit in tropical trees: a case study from the Dipterocarpaceae. Ecology and Evolution 5(9):1794−801

    doi: 10.1002/ece3.1469

    CrossRef   Google Scholar

    [21]

    Momose K, Yumoto T, Nagamitsu T, Kato M, Nagamasu H, et al. 1998. Pollination biology in a lowland dipterocarp forest in Sarawak, Malaysia. I. Characteristics of the plant-pollinator community in a lowland dipterocarp forest. American Journal of Botany 10:1477−501

    doi: 10.2307/2446404

    CrossRef   Google Scholar

    [22]

    Lee SL, Ng KKS, Ng CH, Tnah LH, Lee CT, et al. 2016. Spatial studies of Shorea parvifolia ssp parvifolia (Dipterocarpaceae) in a lowland and hill dipterocarp forest. Journal of Tropical Forest Science 28:309−17

    Google Scholar

    [23]

    Kettle CJ, Maycock CR, Ghazoul J, Hollingsworth PM, Khoo E, et al. 2011. Ecological implications of a flower size/number trade-off in tropical forest trees. PLoS One 6:e16111

    doi: 10.1371/journal.pone.0016111

    CrossRef   Google Scholar

    [24]

    Harata T, Nanami S, Yamakura T, Matsuyama S, Chong L, et al. 2012. Fine-scale spatial genetic structure of ten Dipterocarp tree species in a Bornean rain forest. Biotropica 44:586−94

    doi: 10.1111/j.1744-7429.2011.00836.x

    CrossRef   Google Scholar

    [25]

    Finger A, Kettle CJ, Kaiser-Bunbury CN, Valentin T, Mougal J, et al. 2012. Forest fragmentation genetics in a formerly widespread island endemic tree: Vateriopsis seychellarum (Dipterocarpaceae). Molecular Ecology 21:2369−82

    doi: 10.1111/j.1365-294X.2012.05543.x

    CrossRef   Google Scholar

    [26]

    Widiyatno, Indrioko S, Na’iem M, Purnomo S, Hosaka T, et al. 2017. Effects of logging rotation in a lowland dipterocarp forest on mating system and gene flow in Shorea parvifolia. Tree Genetics and Genomes 13:85

    doi: 10.1007/s11295-017-1167-3

    CrossRef   Google Scholar

    [27]

    Doyle JJ. 1990. Isolation of Plant DNA from Fresh Tissue. Focus 12:13−15

    Google Scholar

    [28]

    Guo JJ, Shang SB, Wang CS, Zhao ZG, Zeng J. 2017. Twenty microsatellite markers for the endangered Vatica mangachapoi (Dipterocarpaceae). Applications in Plant Sciences 5:1600134

    doi: 10.3732/apps.1600134

    CrossRef   Google Scholar

    [29]

    Peakall R, Smouse PE. 2006. GENALEX 6: genetic analysis in Excel. Population genetic software for teaching and research. Molecular Ecology Notes, 6:288−95

    doi: 10.1111/j.1471-8286.2005.01155.x

    CrossRef   Google Scholar

    [30]

    Nei M, Chesser RK. 1983. Estimation of fixation indices and gene diversities. Annals of Human Genetics 47:253−59

    doi: 10.1111/j.1469-1809.1983.tb00993.x

    CrossRef   Google Scholar

    [31]

    Liu K, Muse SV. 2005. PowerMarker: an integrated analysis environment for genetic marker analysis. Bioinformatics 21:2128−29

    doi: 10.1093/bioinformatics/bti282

    CrossRef   Google Scholar

    [32]

    Excoffier L, Lischer HEL. 2010. Arlequin suite ver 3.5: a new series of programs to perform population genetics analyses under Linux and Windows. Molecular Ecology Resources 10:564−7

    doi: 10.1111/j.1755-0998.2010.02847.x

    CrossRef   Google Scholar

    [33]

    Piry S, Luikart G, Cornuet JM. 1999. BOTTLENECK: a computer program for detecting recent reductions in the effective size using allele frequency data. Journal of Heredity 90:502−3

    doi: 10.1093/jhered/90.4.502

    CrossRef   Google Scholar

    [34]

    Falush D, Stephens M, Pritchard JK. 2003. Inference of population structure using multilocus genotype data: linked loci and correlated allele frequencies. Genetics 164:1567−87

    doi: 10.1093/genetics/164.4.1567

    CrossRef   Google Scholar

    [35]

    Earl DA, VonHoldt BM. 2012. STRUCTURE HARVESTER: a website and program for visualizing STRUCTURE output and implementing the Evanno method. Conservation Genetics Resources 4:359−61

    doi: 10.1007/s12686-011-9548-7

    CrossRef   Google Scholar

    [36]

    Jakobsson M, Rosenberg NA. 2007. CLUMPP: a cluster matching and permutation program for dealing with label switching and multimodality in analysis of population structure. Bioinformatics 23:1801−6

    doi: 10.1093/bioinformatics/btm233

    CrossRef   Google Scholar

    [37]

    Rosenberg NA. 2004. DISTRUCT: a program for the graphical display of population structure. Molecular Ecology Notes 4:137−38

    doi: 10.1046/j.1471-8286.2003.00566.x

    CrossRef   Google Scholar

    [38]

    Tamura K, Stecher G, Kumar S. 2021. MEGA11: Molecular Evolutionary Genetics Analysis Version 11. Molecular Biology and Evolution 38:3022−27

    doi: 10.1093/molbev/msab120

    CrossRef   Google Scholar

    [39]

    Beerli P. 2006. Comparison of Bayesian and maximum-likelihood inference of population genetic parameters. Bioinformatics 22:341−5

    doi: 10.1093/bioinformatics/bti803

    CrossRef   Google Scholar

    [40]

    Hardy OJ, Vekemans X. 2002. SPAGeDi: a versatile computer program to analyse spatial genetic structure at the individual or population levels. Molecular Ecology Notes 2:618−20

    doi: 10.1046/j.1471-8286.2002.00305.x

    CrossRef   Google Scholar

    [41]

    Loiselle BA, Sork VL, Nason J, Graham C. 1995. Spatial genetic structure of a tropical understory shrub, Psychotria officinalis (Rubiaceae). American Journal of Botany 82:1420−25

    doi: 10.1002/j.1537-2197.1995.tb12679.x

    CrossRef   Google Scholar

    [42]

    Doligez A, Joly HI. 1997. Genetic diversity and spatial structure within a natural stand of a tropical forest tree species, Carapa procera (Meliaceae), in French Guiana. Heredity 79:72−82

    doi: 10.1038/hdy.1997.124

    CrossRef   Google Scholar

    [43]

    Cavers S, Degen B, Caron H, Lemes MR, Margis R, et al. 2005. Optimal sampling strategy for estimation of spatial genetic structure in tree populations. Heredity 95:281−89

    doi: 10.1038/sj.hdy.6800709

    CrossRef   Google Scholar

    [44]

    Chen W, Qi H, Fu R, Li D, Jiang D. 2021. Survey and population dynamics analysis of Vatica mangachapoi germplasm resource in Hainan Island. Molecular Plant Breeding 14:4846−54

    Google Scholar

    [45]

    Hamrick JL, Godt MJW, Sherman-Broyles SL. 1992. Factors influencing levels of genetic diversity in woody plant species. New Forest 6:95−124

    doi: 10.1007/BF00120641

    CrossRef   Google Scholar

    [46]

    Ony MA, Nowicki M, Boggess SL, Klingeman WE, Zobel JM, et al. 2020. Habitat fragmentation influences genetic diversity and differentiation: Fine-scale population structure of Cercis canadensis (eastern redbud). Ecology and Evolution 10:3655−70

    doi: 10.1002/ece3.6141

    CrossRef   Google Scholar

    [47]

    Bacles CFE, Burczyk J, Lowe AJ, Ennos RA. 2005. Historical and contemporary mating patterns in remnant populations of the forest tree Fraxinus excelsior L. Evolution 59:979−90

    doi: 10.1111/j.0014-3820.2005.tb01037.x

    CrossRef   Google Scholar

    [48]

    Kikuchi S, Shibata M, Tanaka H. 2015. Effects of forest fragmentation on the mating system of a cool-temperate heterodichogamous tree Acer mono. Global Ecology and Conservation 3:789−801

    doi: 10.1016/j.gecco.2015.04.005

    CrossRef   Google Scholar

    [49]

    Tito de Morais C, Ghazoul J, Maycock CR, Bagchi R, Burslem DFRP, et al. 2015. Understanding local patterns of genetic diversity in dipterocarps using a multi-site, multi-species approach: Implications for forest management and restoration. Forest Ecology and Management 356:153−65

    doi: 10.1016/j.foreco.2015.07.023

    CrossRef   Google Scholar

    [50]

    Smith JR, Ghazoul J, Burslem DFRP, Itoh A, Khoo E, et al. 2018. Are patterns of fine-scale spatial genetic structure consistent between sites within tropical tree species? PLoS One 13(3):e0193501

    doi: 10.1371/journal.pone.0193501

    CrossRef   Google Scholar

    [51]

    Lü B, Wang N, Liu S, Hao Q. 2015. Reproductive phenological characteristics of hainan coastal Vatica mangachapoi forest. Acta Ecologica Sinica 35:416−23

    doi: 10.5846/stxb201304010572

    CrossRef   Google Scholar

    [52]

    Tackenberg O. 2003. Modeling long-distance dispersal of plant diaspores by wind. Ecological Monographs 73:173−89

    doi: 10.1890/0012-9615(2003)073[0173:MLDOPD]2.0.CO;2

    CrossRef   Google Scholar

    [53]

    Maurer KD, Bohrer G, Medvigy D, Wright SJ. 2013. The timing of abscission affects dispersal distance in a wind-dispersed tropical tree. Functional Ecology 27:208−18

    doi: 10.1111/1365-2435.12028

    CrossRef   Google Scholar

    [54]

    Kettle CJ, Hollingsworth PM, Burslem DFRP, Maycock CR, Khoo E, et al. 2011. Determinants of fine-scale spatial genetic structure in three co-occurring rain forest canopy trees in Borneo. Perspectives in Plant Ecology, Evolution and Systematics 13:47−56

    doi: 10.1016/j.ppees.2010.11.002

    CrossRef   Google Scholar

    [55]

    Wang B. 1987. Approach to the horizontal zonation of monsoon forests. Acta Phytoecologica et Geobotanica Sinica 11:154−58

    Google Scholar

    [56]

    Liang S, Lin Y, Yang X, Huang S, Fu S, et al. 1994. The Vatica mangachapoi Forest of Li Ji, Wan Ning County, Hainan Island. Natural Science Journal of Hainan University 12:14−19

    Google Scholar

  • Cite this article

    Duan J, Wang H, Tang L. 2023. Effects of habitat fragmentation on the coastal Vatica mangachapoi forest (Dipterocarpaceae) in Shimei Bay, Hainan Island, China. Tropical Plants 2:8 doi: 10.48130/TP-2023-0008
    Duan J, Wang H, Tang L. 2023. Effects of habitat fragmentation on the coastal Vatica mangachapoi forest (Dipterocarpaceae) in Shimei Bay, Hainan Island, China. Tropical Plants 2:8 doi: 10.48130/TP-2023-0008

Figures(6)  /  Tables(3)

Article Metrics

Article views(4185) PDF downloads(529)

Other Articles By Authors

ARTICLE   Open Access    

Effects of habitat fragmentation on the coastal Vatica mangachapoi forest (Dipterocarpaceae) in Shimei Bay, Hainan Island, China

Tropical Plants  2 Article number: 8  (2023)  |  Cite this article

Abstract: Habitat fragmentation can cause isolation and decline of a formerly continuously distributed population, which leads to loss of genetic variation and increased risk of extinction. Vatica mangachapoi Blanco is a dominant tree species growing in the lowland rainforests of Hainan Island, China. Remarkably, this species dominates a coastal forest in Shimei Bay, Wanning City of Hainan Province (China). Due to logging, expansion of farmland and villages, and construction of tourism facilities, the coastal V. mangachapoi-dominated forest has become fragmented, threatening its future. To evaluate the effects of habitat fragmentation on this unique coastal forest, two V. mangachapoi populations (SM and RY) along the coast and one population in the lowland rainforest near the coast were selected, and their genetic diversity was assessed based on 12 SSR markers. In addition, the genetic structure of the three populations and gene flow among them, and the fine-scale spatial genetic structure (FSGS) of the SM population were also studied. The results show that the three V. mangachapoi populations had comparable levels of genetic variation, and differentiation among them is negligible (Fst = 0.008 ~ 0.013). Model-based clustering, Principal co-ordinate analysis and the Neighbor-joining (NJ) methods consistently support a homogeneous genetic structure of the three populations, and strong gene flow was detected among them by MIGRATE analyses. Moreover, there is no significant FSGS in the SM population. A relatively short time since habitat fragmentation and gene flow mediated by seed dispersal might be the likely reasons for the high levels of genetic variation and an absence of genetic structure of the coastal V. mangachapoi populations. In conclusion, even though there are no significant effects of fragmentation on the coastal V. mangachapoi forest, strict protection is required to prevent further deforestation and fragmentation. Besides, saplings of V. mangachapoi should be planted in forest gaps to reconnect fragments of the coastal forest, which would be of benefit for the long-term survival of the tropical coastal V. mangachapoi-dominated forest.

    • Trees from family Dipterocarpaceae serve an important ecosystem function in the rainforest community of Asian tropical forests, where 20%−50% of the canopy layer belong to this family[1]. With high-quality timber that has a high economic value, dipterocarp forests also form a major pillar of the global tropical timber trade[2]. Due to long-term over-harvesting and land use change, tropical rainforests have become severely fragmented, and a large number of dipterocarps are today listed as endangered species and are at risk of extinction[3]. As a result, ecosystem services of Asian tropical rainforests in which dipterocarps are the dominant species have been seriously impaired[4]. Therefore, conservation genetics studies focusing on Dipterocarpaceae are urgently needed[1].

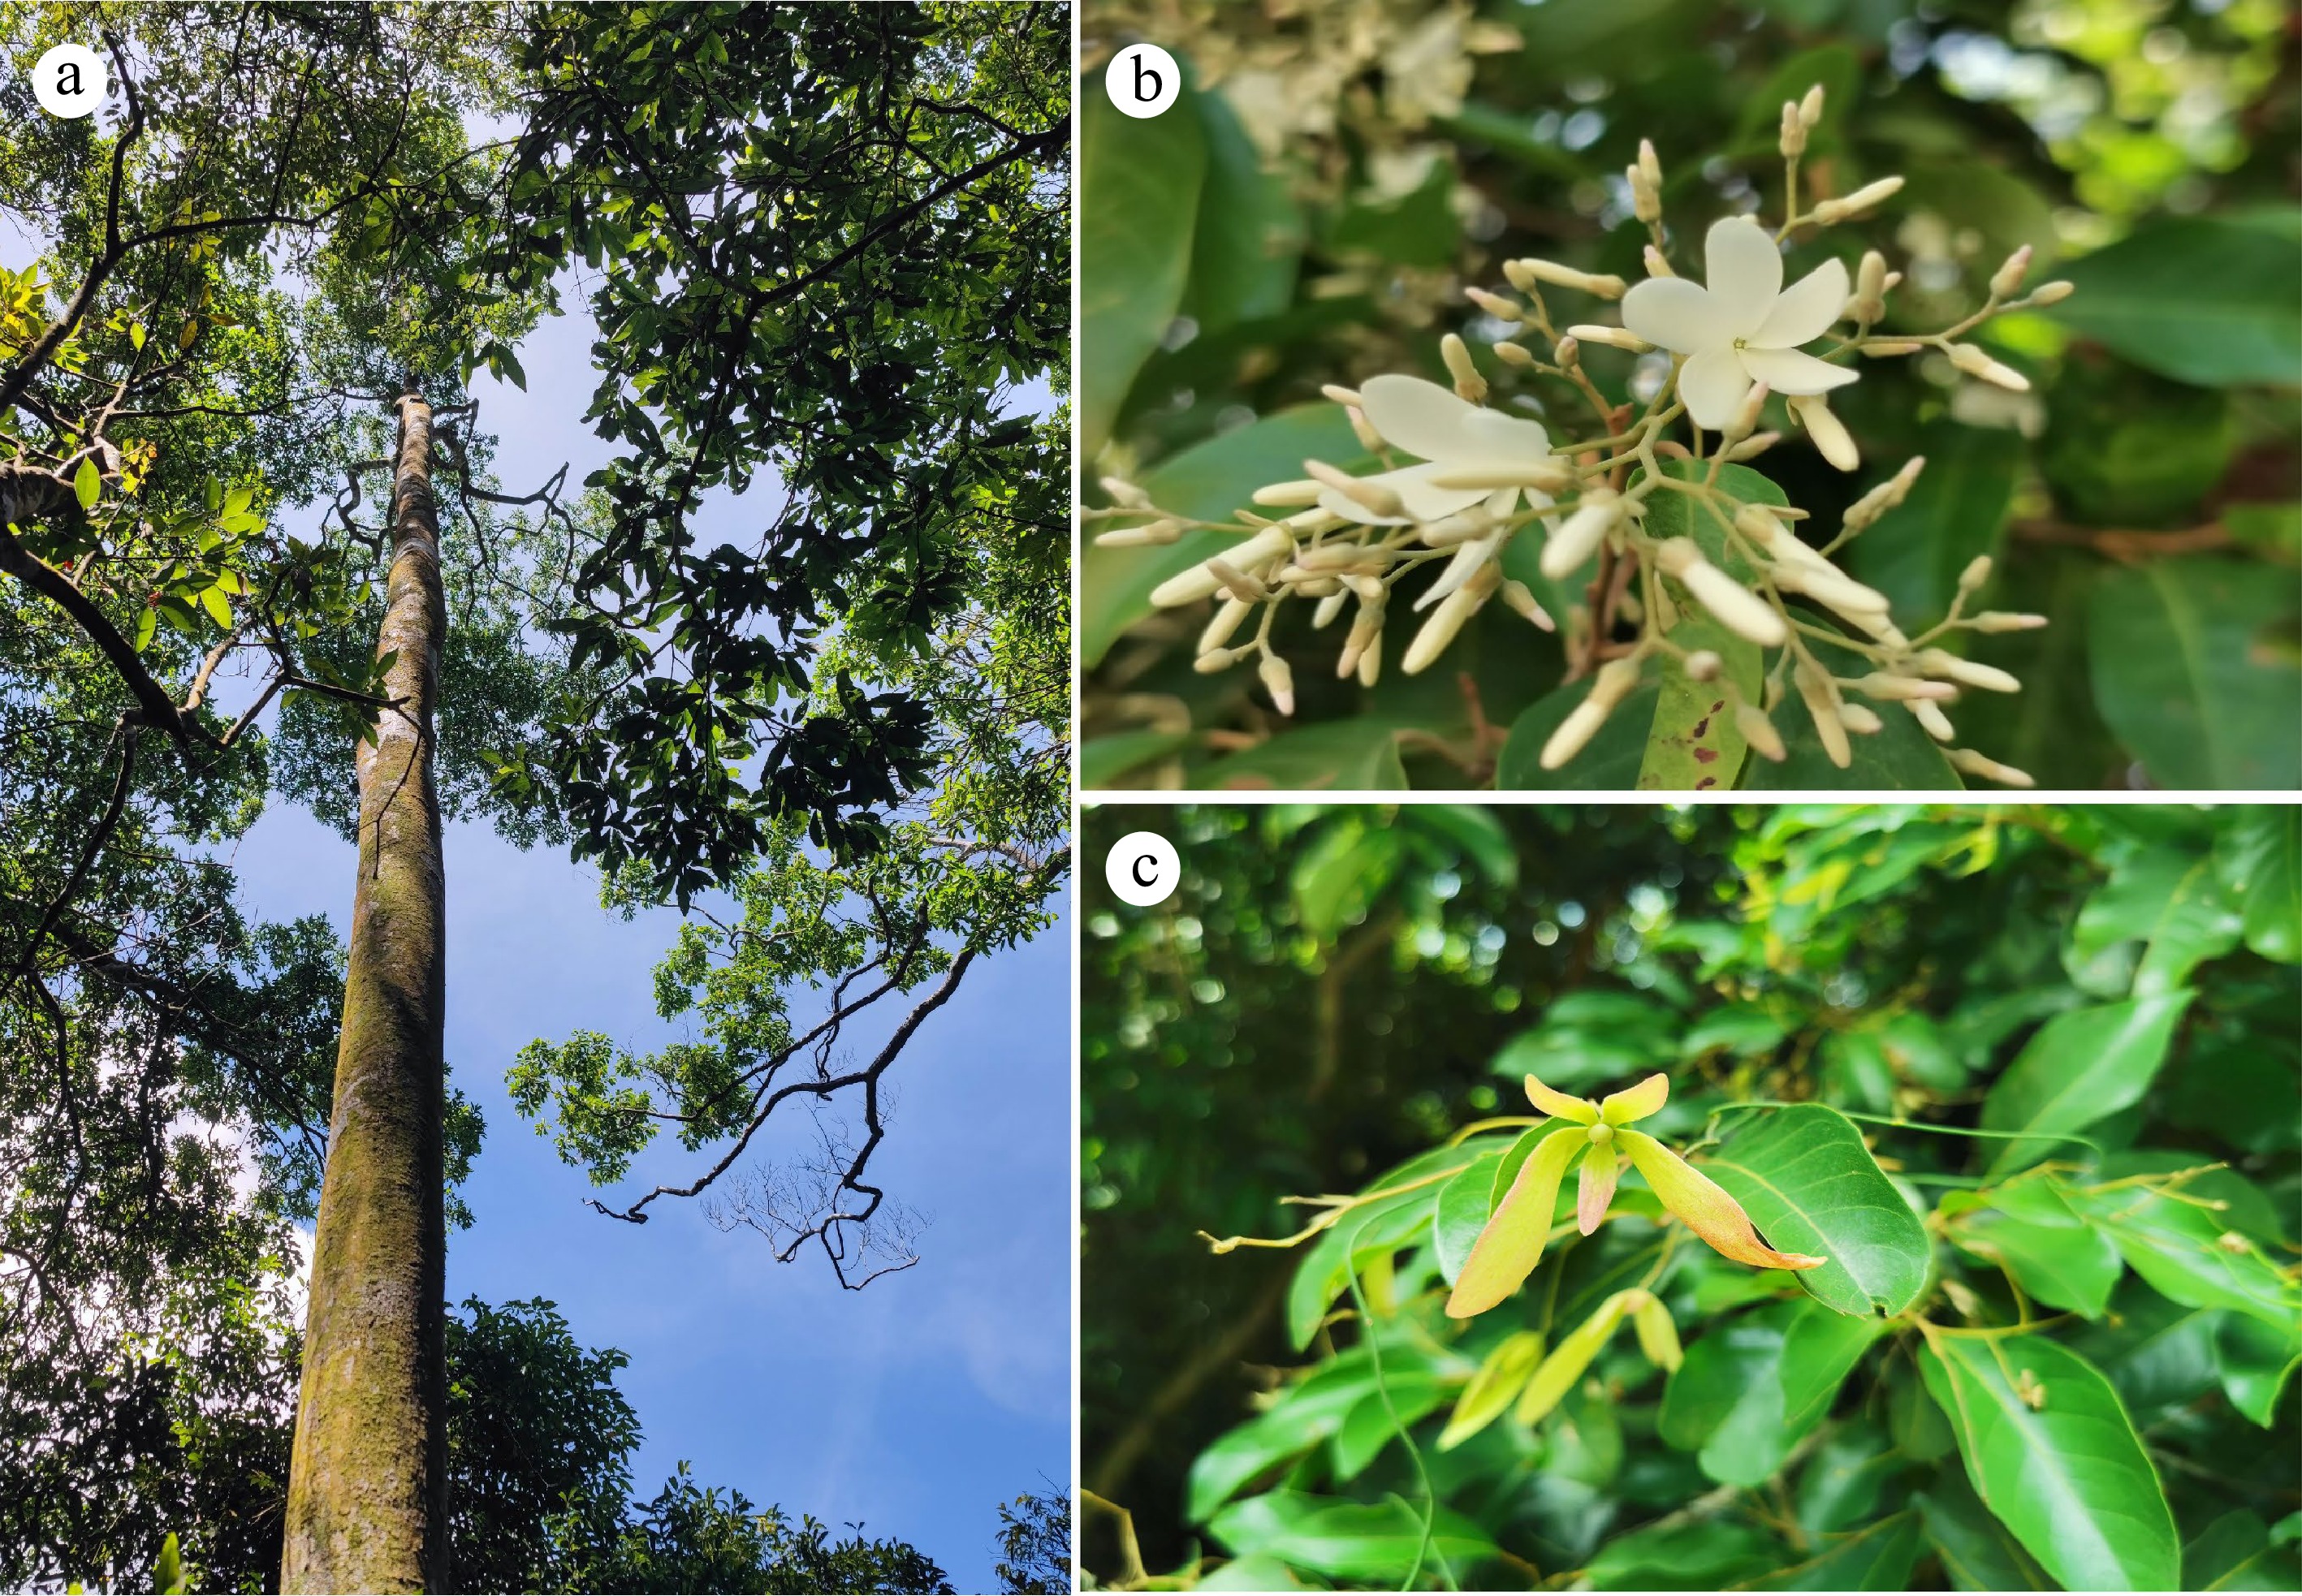
      The tropical forests in Hainan Island, China are located at the northern edge of tropical Asia and are distinct from the typical tropical rainforests of Southeast Asia in terms of species composition, community structure and appearance as a consequence of the influence of the Asian monsoon[5]. Only three species of Dipterocarpaceae, Hopea hainanensis Merrill & Chun, H. reticulata Tardieu and Vatica mangachapoi Blanco can be found on this island. Although the species diversity of Dipterocarpaceae in Hainan Island has been greatly reduced as compared to that in Southeast Asia, the three species, especially V. mangachapoi (Fig. 1), play a key role in community assembly and ecosystem functioning of the lowland rainforests of this island[57]. It is remarkable that V. mangachapoi has developed into a continuously distributed coastal forest growing on sand substrate with 25 kilometers-long and 400 to 500 meters-wide at Shimei Bay, Wanning City (China), which is estimated to be at least 4000 years old[8, 9]. A study showed that soil moisture and organic matters of the sand substrate are much lower than those of normal tropical soils[10]. The formation of the coastal V. mangachapoi-dominated forest on barren and harsh sandy beach is unique and rare in itself, which could serve as an example to study the underlying physiological and genetical adaptation of V. mangachapoi to arid and poor substrate. In recent years, due to such factors as coastal development and village expansion, the area of the coastal V. mangachapoi-dominated forest in Shimei Bay has been reduced, and the formerly intact population has fragmented into several isolated patches. Coupled with the presence of forest gaps and fungal disease caused by human interference, the survival of the coastal V. mangachapoi is seriously threatened[9, 11, 12]. Conservation management is thus needed to protect this unique coastal forest dominated by V. mangachapoi.

      Figure 1. 

      Morphology of Vatica mangachapoi. (a) An individual tree, (b) flowers, (c) fruits.

      Habitat fragmentation can cause an intact population into small, isolated patches, with reduced gene flow between patches and increased genetic drift and inbreeding within patches[1316]. If seed dispersal is limited and restricted within patches, genotypes are likely to be spatially clustered, producing a strong fine-scale spatial genetic structure (FSGS)[17, 18]. Vatica magachapoi has winged fruits, which may promote seed dispersal by wind. Studies indeed showed that the dispersal distance of winged fruits are generally further than non-winged fruits in dipterocarps[19, 20]. On the other hand, the strength of FSGS was also affected by pollen dispersal. Dipterocarps that are pollinated by large insects, such as bees, can achieve longer distance of pollen flow than those pollinated by small insects, such as thrips, because large pollinators can move further than small ones[21, 22]. The limited seed and pollen dispersal were confirmed as the main reason for significant FSGS of most dipterocarps in fragmented habitats[2326]. Is there a significant FSGS in the coastal forest of V. mangachapoi? Is genetic diversity lower in the coastal V. mangachapoi populations than the undisturbed rainforest populations nearby? Does significant genetic differentiation occur between patches of the coastal V. mangachapoi forest? These questions are important for the conservation and management of the unique coastal dipterocarp forest but remain to be resolved.

      To answer the above questions, two coastal populations of V. mangachapoi (SM and RY) were sampled, and one population in the lowland rainforest near the coast (TT) were further collected for comparison. Genetic diversity, structure and population differentiation were assessed for the three V. mangachapoi populations using 12 SSR markers. Gene flow was estimated to test whether habitat fragmentation interrupted genetic exchange between them or not. Finally, FSGS were analyzed using the SM population to show whether significant spatial genetic structure has occurred within patches. Answering these questions could shed light on the conservation and continued survival of this unique coastal V. mangachapoi-dominated forest.

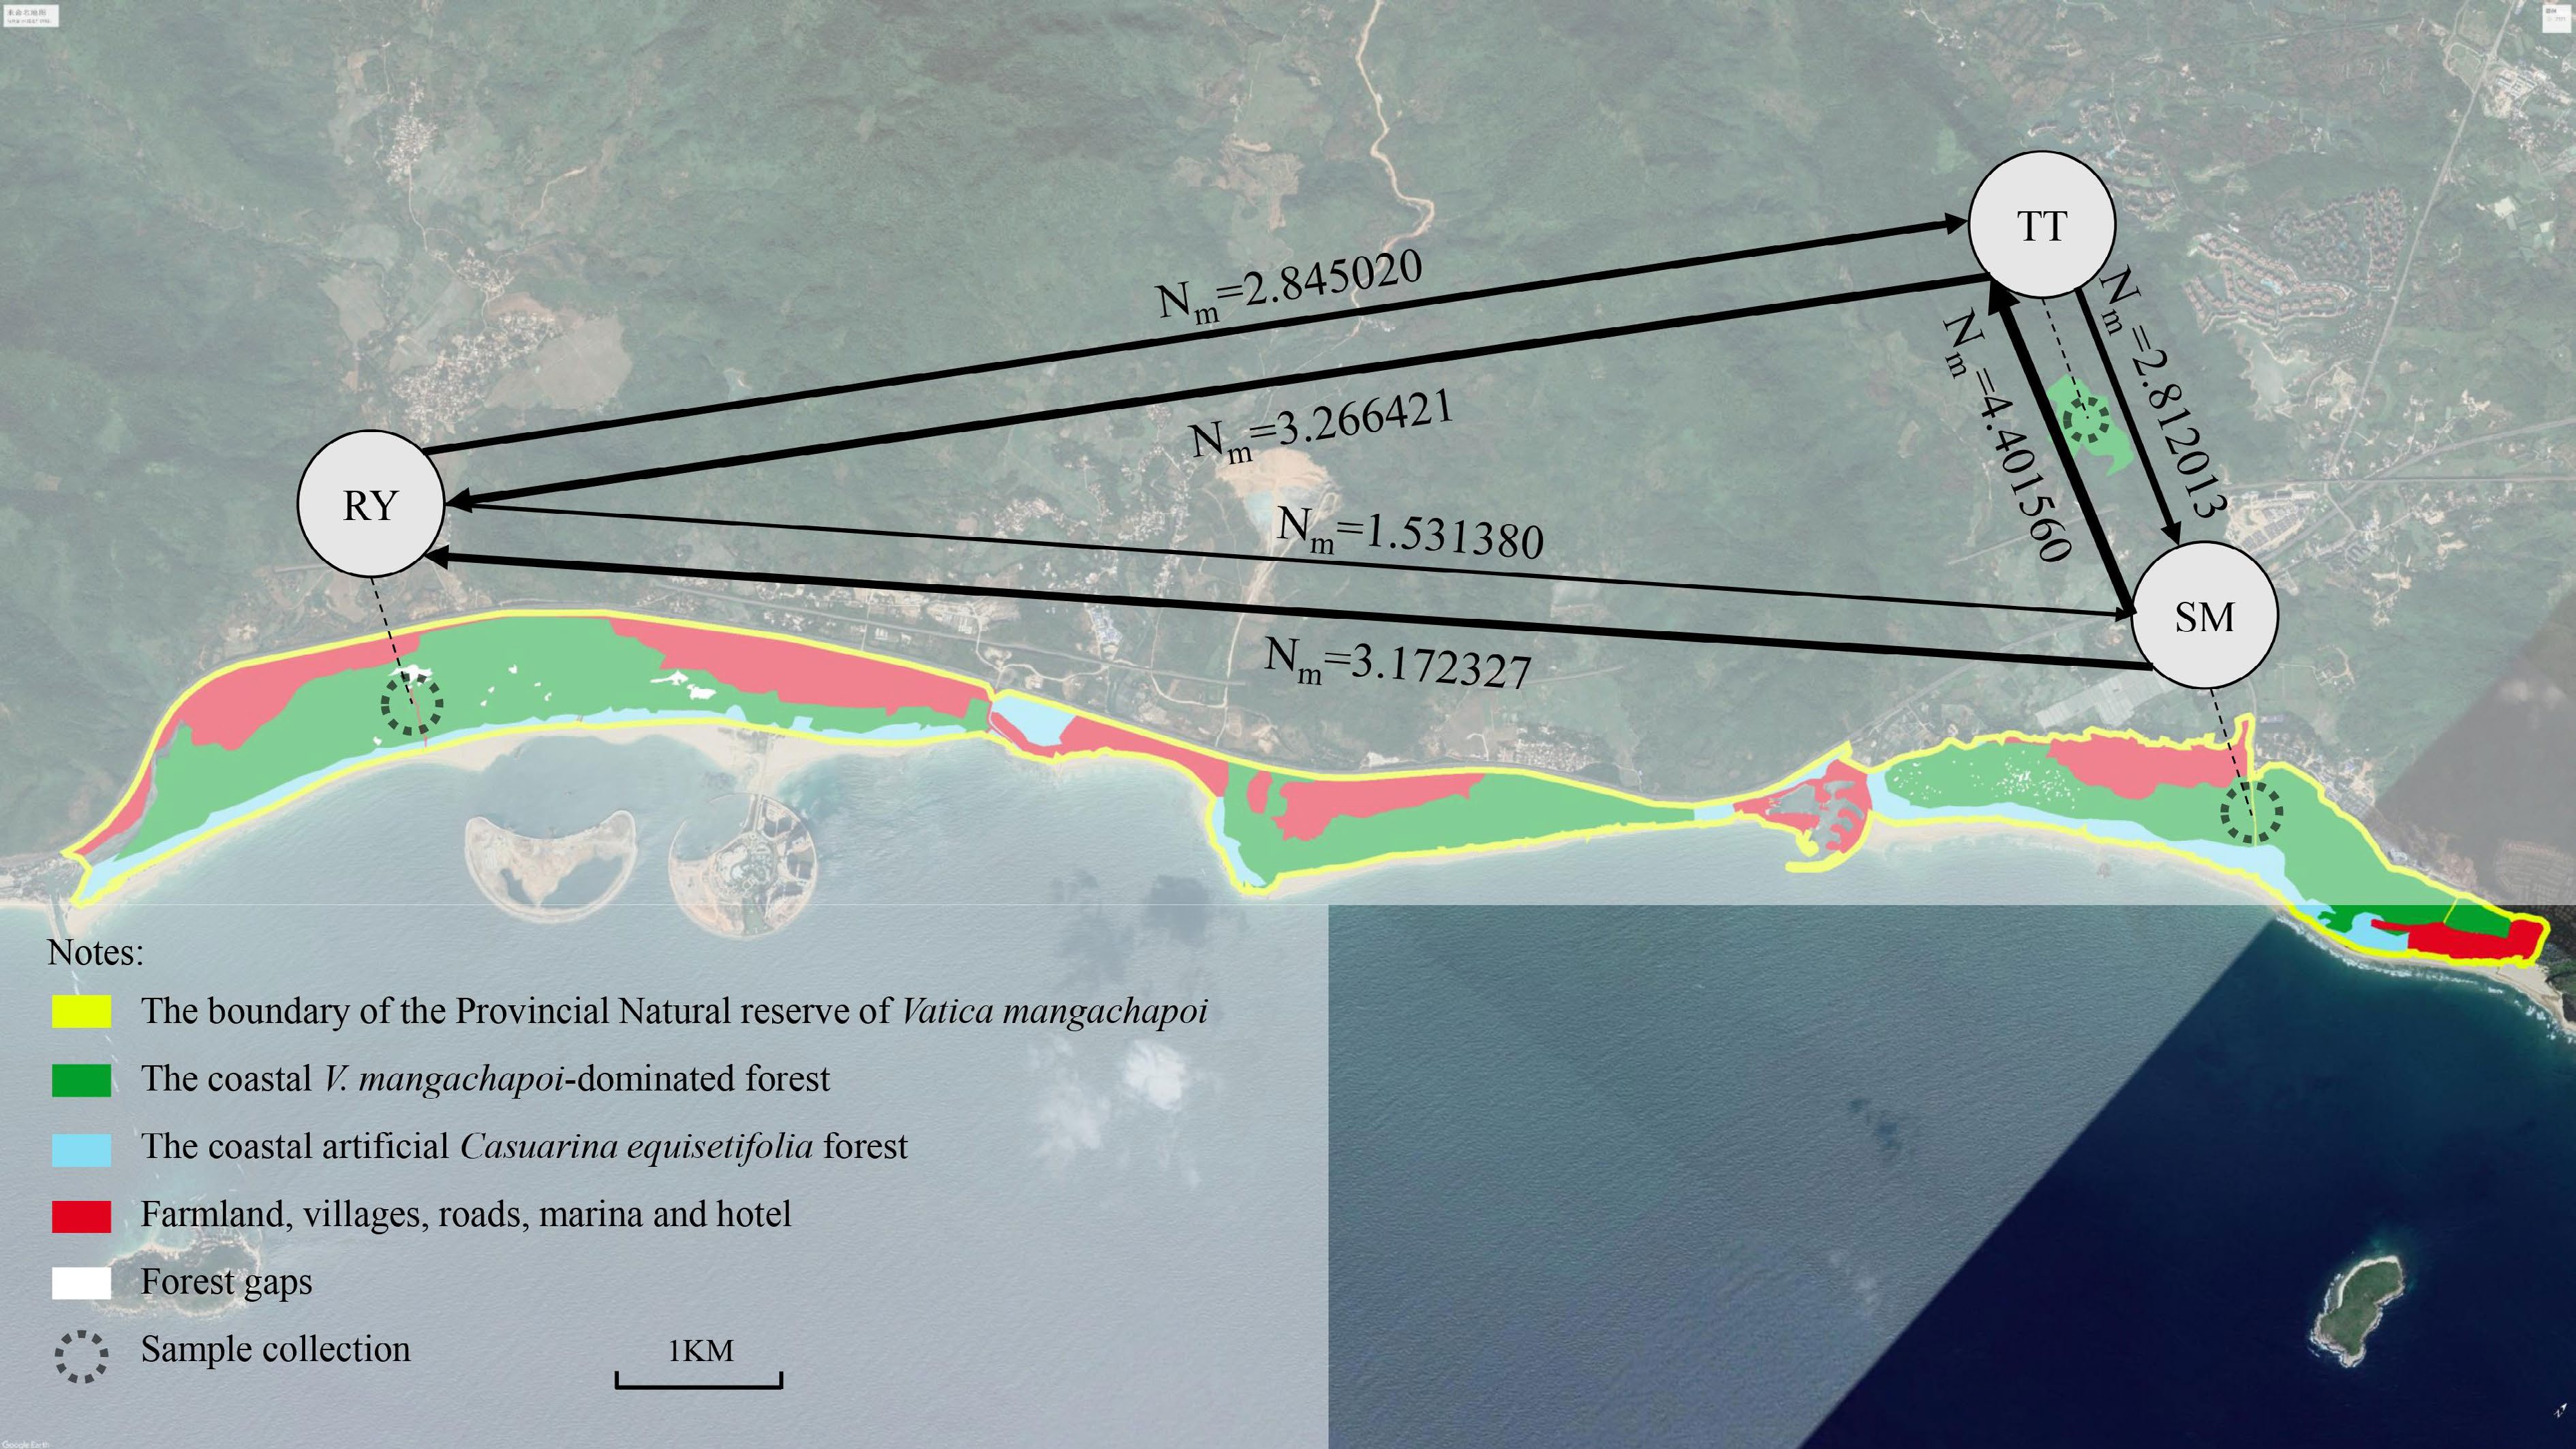
    • The study area is located in the Provincial Nature Reserve of V. mangachapoi, Wanning City, Hainan Province (China). Two V. mangachapoi populations (SM and RY) in the coastal forest separated by villages, roads and human facilities, and one population (TT) in the lowland rainforest near the coast were selected (Table 1, Fig. 2). In total, 188 V. mangachapoi trees individually spaced out more than 25 m apart and with DBH > 5 cm were sampled. Mature leaves lacking disease spots were selected, dried by silica gel and then were stored in a −20 °C refrigerator. The voucher specimens of V. mangachapoi were kept in Hainan University (Hainan, China).

      Table 1.  Genetic diversity indices of the three V. mangachapoi populations based on 12 SSR markers.

      PopulationLocationNNaNeHoHeFis
      SM110.26691° E, 18.66671° N9183.6470.5470.6900.207
      RY110.17952° E, 18.59768° N3973.7040.6050.7000.142
      TT110.24941° E, 18.67744° N587.53.6940.5660.6920.167
      Average7.53.6820.5720.6940.172

      Figure 2. 

      Geographic distribution of the coastal V. mangachapoi-dominated forest and the locations of the three sampled V. mangachapoi populations. Gene flow among them was estimated, with the width of lines being proportional to the intensity of gene flow.

    • A modified CTAB method[27] was used to extract the genomic DNA of V. mangachapoi. Twelve pairs of polymorphic SSR primers developed by Guo et al.[28] were used in this study. PCR amplification were performed in a total volume of 10 μL, containing 1.0 μL of genomic DNA (around 50 ng), 5.0 μL of Taq PCR Master Mix (GeneTech), 0.5 μL of forward and reverse primers, and 3.0 μL of ddH2O. Amplification was carried out as follows: pre-denaturation at 95 °C for 5 min, followed by 35 cycles of denaturation at 95 °C for 20 s, annealing at 52−62 °C for 15 s, extension at 72 °C for 30 s, and finally extension at 72 °C for 7 min. PCR products were separated by capillary electrophoresis using ABI3730xl (Applied Biosystem) and SSR genotypes were analyzed by the GeneMarker software.

    • Population genetic parameters, including number of alleles (Na), effective number of alleles (Ne), observed heterozygosity (Ho), expected heterozygosity (He), inbreeding coefficient (Fis) and genetic differentiation among populations (Fst) were estimated using GenAlex 6.51[29]. Polymorphism information content (PIC) and Nei & Chessers[30] genetic distances were calculated by PowerMarker 3.25[31]. Analysis of molecular variance (AMOVA) of the V. mangachapoi population was performed using Arlequin 3.5[32]. Potential population bottleneck was examined by Wilcoxon sign-rank test and model shift using the Stepwise Mutation Model and Two-phased Mutation Model implemented in Bottleneck 1.3.2[33].

      Bayesian clustering analysis was performed using Structure 2.3.4[34]. The values of K were set from 1 to 10, and for each value of K, 10 independent replicates were run with 100,000 burn-in iterations followed by 200,000 MCMC (Markov chain Monte Carlo) iterations. The best K was determined according to the delta K of STRUCTURE Harvester[35]. The results of the 10 replicates were combined by the Greedy algorithm implemented in Clumpp1.1.2[36], and the result of individual clustering were drawn using Distruct1.1[37]. NJ trees were constructed using MEGA 11.0[38] based on Nei & Chessers[30] genetic distances. Principal co-ordinate analysis (PCoA) was performed with GenAlex 6.51.

      The effective population size (θ) of the three V. mangachapoi populations and the migration rate (M) between them were calculated using MIGRATE[39], a software based on the coalescent theory and Bayesian inference to estimate values of parameters of a user-specified population model. MIGRATE analyses were run under a Brownian motion model, and four heat chains with different temperatures of 1.0, 1.5, 3.0 and 1.0 × 10⁵ were simulated. Gene flow was calculated according to the equation Nm = θ*M/x. For SSR markers, x was set to 4. Three independent replications were run to ensure the convergence of the Markov chain Monte Carlo methods implemented in MIGRATE.

      The fine-scale spatial genetic structure (FSGS) within-population was assessed using SPAGeDi 1.5[40]. The kinship coefficients (Fij, kinship coefficients) between any two individuals were calculated and regressed against the natural logarithm of the spatial distance to obtain the regression slope bF[41]. We divided the distance between any pair of individuals sampled from the SM population into 10 distance classes (35, 50, 75, 100, 150, 300, 500, 700, 850, 1,100 m), with at least 30 pairs of individuals per distance class[42, 43].

      The 95% confidence intervals of Fij were calculated from 9,999 permutations of spatial distance among pairs of adults for 10 distance classes. If the Fij was higher than the upper bound of the 95% confidence interval, there is significant spatial genetic structure in population and a high level of genetic similarity among individuals; if the Fij fell within the 95% confidence interval, there is no spatial genetic structure in population and individuals were considered to be spatially randomly distributed; if the Fij was less than the lower bound of the 95% confidence interval, individuals were considered to be uniformly distributed in space without spatial genetic structure. The value of the Sp statistic reflects the strength of FSGS and is defined as Sp = -bF / (1-F(1) ), where bF is the regression slope, and F(1) is the mean pairwise kinship coefficient of the first distance class.

    • There is no significant difference in the level of genetic diversity between the coastal (SM and RY) and the rainforest (TT) populations (Table 1). The inbreeding coefficient was greater than 0, indicating inbreeding and an excess of homozygotes in the three V. mangachapoi populations. Totally 90 alleles were detected from the 12 SSR loci, and the number of alleles at a single locus ranged from 4.667 to 11.000, with an average of 7.500 alleles per locus. The observed and expected heterozygosity ranged from 0.303 to 0.769 and from 0.415 to 0.808, respectively. The primer sequences, range of allele sizes and genetic diversity indices of the 12 SSR loci are shown in Table 2.

      Table 2.  Primer sequences, allele size and genetic diversity indices of the 12 SSR markers.

      LociPrimer sequences (5’-3’)Repeat
      motif
      Allele sizeGenAlexPowerMarker
      NaNeHoHePIC
      VM1F:GAACCCTTATTGGCCTGCCTAC(AT)11166−1847.3334.2310.7400.7630.7430
      R:GGGACCAAATGACTTGAGTAATCT
      VM2F:ACCCTAACAATTCTCTTTGTTTCCT(TAA)11152−1959.6674.1200.5130.7550.7364
      R:CCCCAATCTCAGTAAGGACTCA
      VM3F:CTTGTGTCGAGCATGCATGTAT(AT)11175−1918.3334.8570.7610.7930.7659
      R:TGCTGGCCTTTTATGTTAGGGT
      VM4F:ATAGCAGGCACTTCGGAAGTAC(TA)8261−2778.6674.6130.3700.7810.7533
      R:CCTGAGAAACAAAGCAACGCAT
      VM5F:GCACTAGCACTAGCACTAGCTT(CT)11218−2264.6672.9080.6290.6510.6026
      R:GGCTTTTCCAATTTCCATGGCT
      VM6F:AGTTAAGGGACCAAATTTAGCGT(TA)7259−2695.0002.7940.5930.6360.5902
      R:GTGTTTGTCAACTGGGCTTCAA
      VM7F:CCCATGTGCTAGGCTAATGCTA(AT)6229−2395.0002.3940.3030.5820.5409
      R:AAATCAGCATGAAACTTCTCCATT
      VM8F:CACCACCACAGGCTTGAGTATA(TA)7168−1825.6671.7220.3740.4150.4044
      R:GAAGGCCAACTAATCAAGCTGC
      VM9F:TCATTTCTGTCTCACTCGACCC(TTC)10148−1685.6673.0100.6390.6660.6097
      R:TCATCGACGAATCACTGTTCGA
      VM10F:ACGGATAAGTTAACGGACTAGACA(TA)10215−2279.3334.7130.5680.7760.7997
      R:AGATTTTCCCCCAGTCATCGAC
      VM11F:GCTGGCACTTAGGATGCCTTAA(ATT)11138−15011.0003.5640.6100.7020.6657
      R:AGCAACCAATTAGCTCAAATCAA
      VM12F:GGGCAGCCTCGTAAATCAATTAC(ATT)13225−2499.6675.2530.7690.8080.7958
      R:ATTACCTGGCACAACCTTAGCC

      Genetic differentiation was weak among the three V. mangachapoi populations (Fst = 0.008~0.013). The result of AMOVA showed that 99% of genetic variation was partitioned within population, in line with little divergence among populations (Supplemental Table S1).

      The Wilcoxon sign rank test found that the p-values were not significant under either the S.M.M or the T.P.M model for the three V. mangachapoi populations, and their allele frequency distributions were generally L-shaped (Fig. 3), indicating that the three populations have not experienced genetic bottlenecks recently.

      Figure 3. 

      Allele frequency distribution of the three V. mangachapoi populations.

    • STRUCTURE analysis found that delta K was maximized at K = 2, indicating two genetic clusters of the studied V. mangachapoi populations. The distribution of the two clusters did not differ significantly between the three populations, and this is also true for K = 3 or 5 (Fig. 4). Consistent with the results of STRUCTURE analyses, NJ tree (Supplemental Fig. S1) and PCoA analysis (Fig. 5) also suggest a homogeneous genetic structure of the three V. mangachapoi populations.
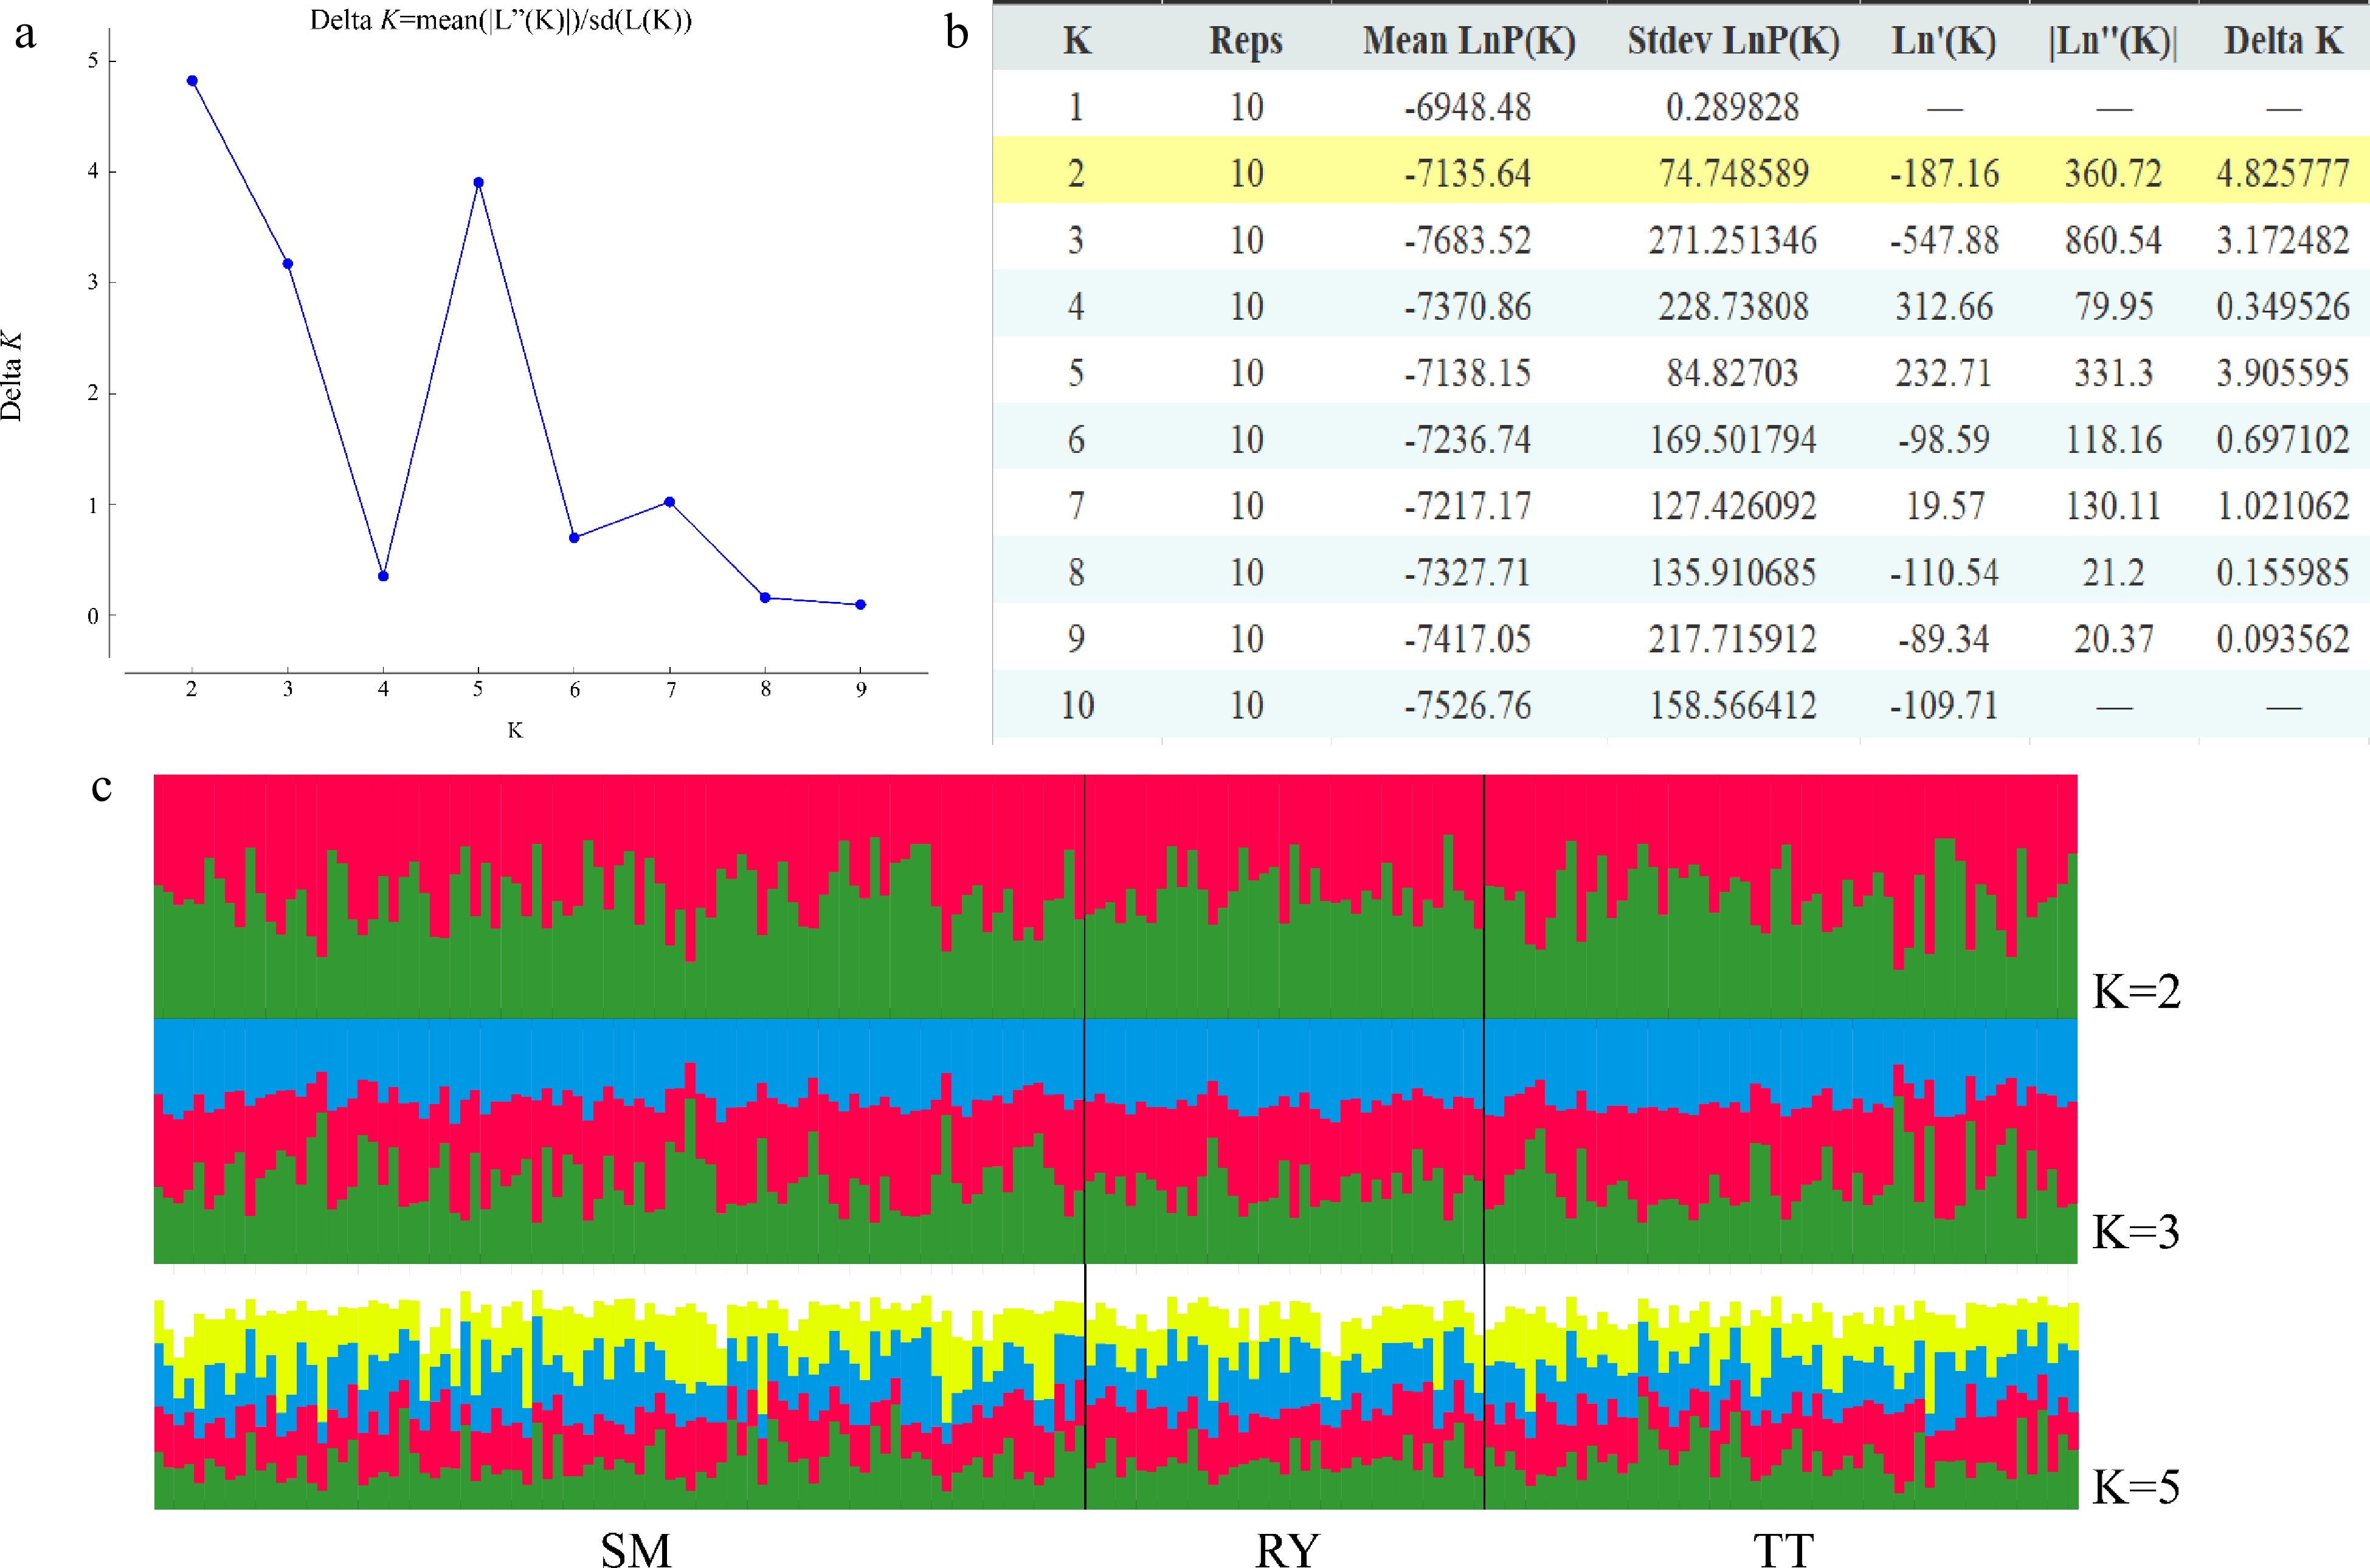
      Figure 4. 

      Results of STRUCTURE analysis. (a) Best K determined using the delta K method. (b) Log probabilities and delta K values for K from two to ten. (c) The results of individual assignment at K = 2, 3 and 5. Each vertical bar represents an individual, and the proportion of the colors corresponds to the posterior probability of genetic clusters assigned to each individual.
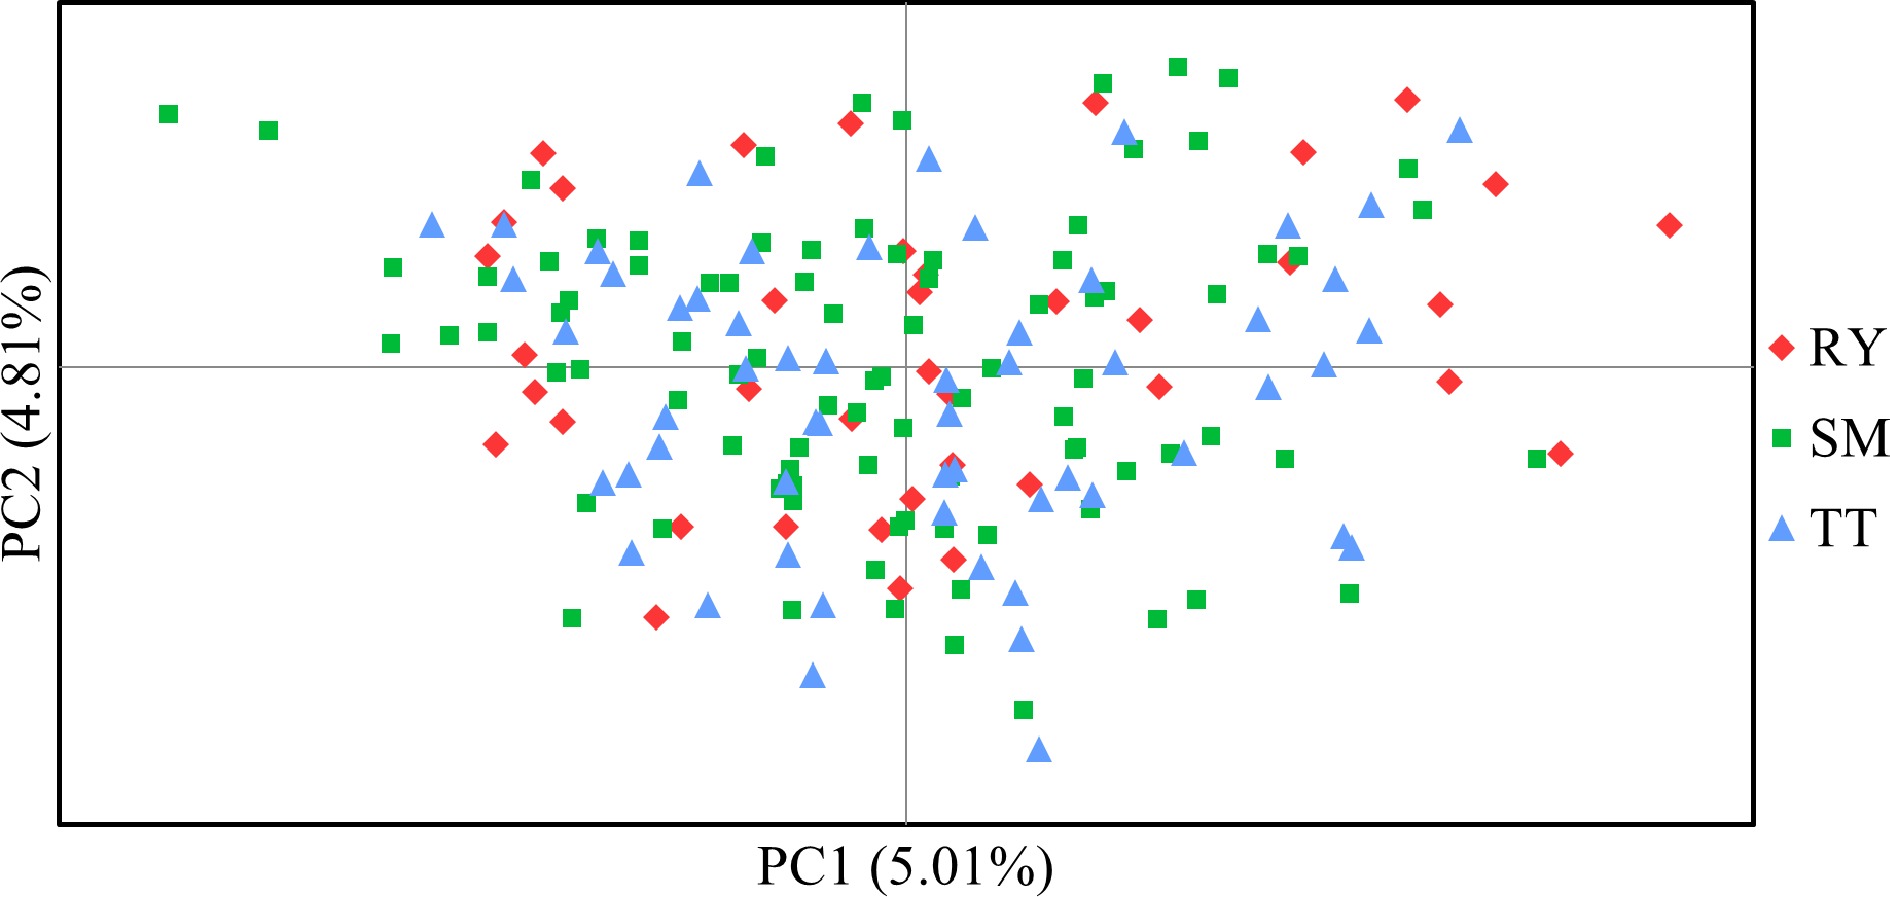
      Figure 5. 

      Principal co-ordinate analysis (PCoA) based on Nei & Chessers[30] genetic distance among individual samples of V. mangachapoi.

    • The effective population sizes of the three V. mangachapoi populations estimated by MIGRATE were similar, but the intensity of gene flow varied among them (Fig. 2, Table 3). The gene flows from RY to the other two populations were less than their reverse gene flows, however, the gene flows from SM to the other two populations were greater than their reverse gene flows. These results suggested that gene flows between the V. mangachapoi populations were asymmetric.

      Table 3.  Mutation-scaled migration rate, effective population size and gene flow estimated by program MIGRATE.

      Direction of
      gene flow
      Migration
      rate (M)
      Effective population
      size (θ)
      Gene flow (Nm)
      SM→RY129.615θSM = 0.097903.172327
      SM→TT179.8394.401560
      RY→SM63.241θRY = 0.096861.531380
      RY→TT117.4902.845020
      TT→SM115.412θTT = 0.097462.812013
      TT→RY134.0623.266421
    • No spatial genetic structure was detected at any of the 10 distance classes in the SM population (Fig. 6). The values of Fij were less than zero over multiple distance classes, indicating that individual trees of V. mangachapoi were spatially uniformly distributed. Based on the mean affinity (F(1)) for the first distance class (0.0151) and the regression slope bF (−0.004605), the strength of FSGS (Sp) was derived as 0.004675 for the V. mangachapoi population in Shimei Bay.
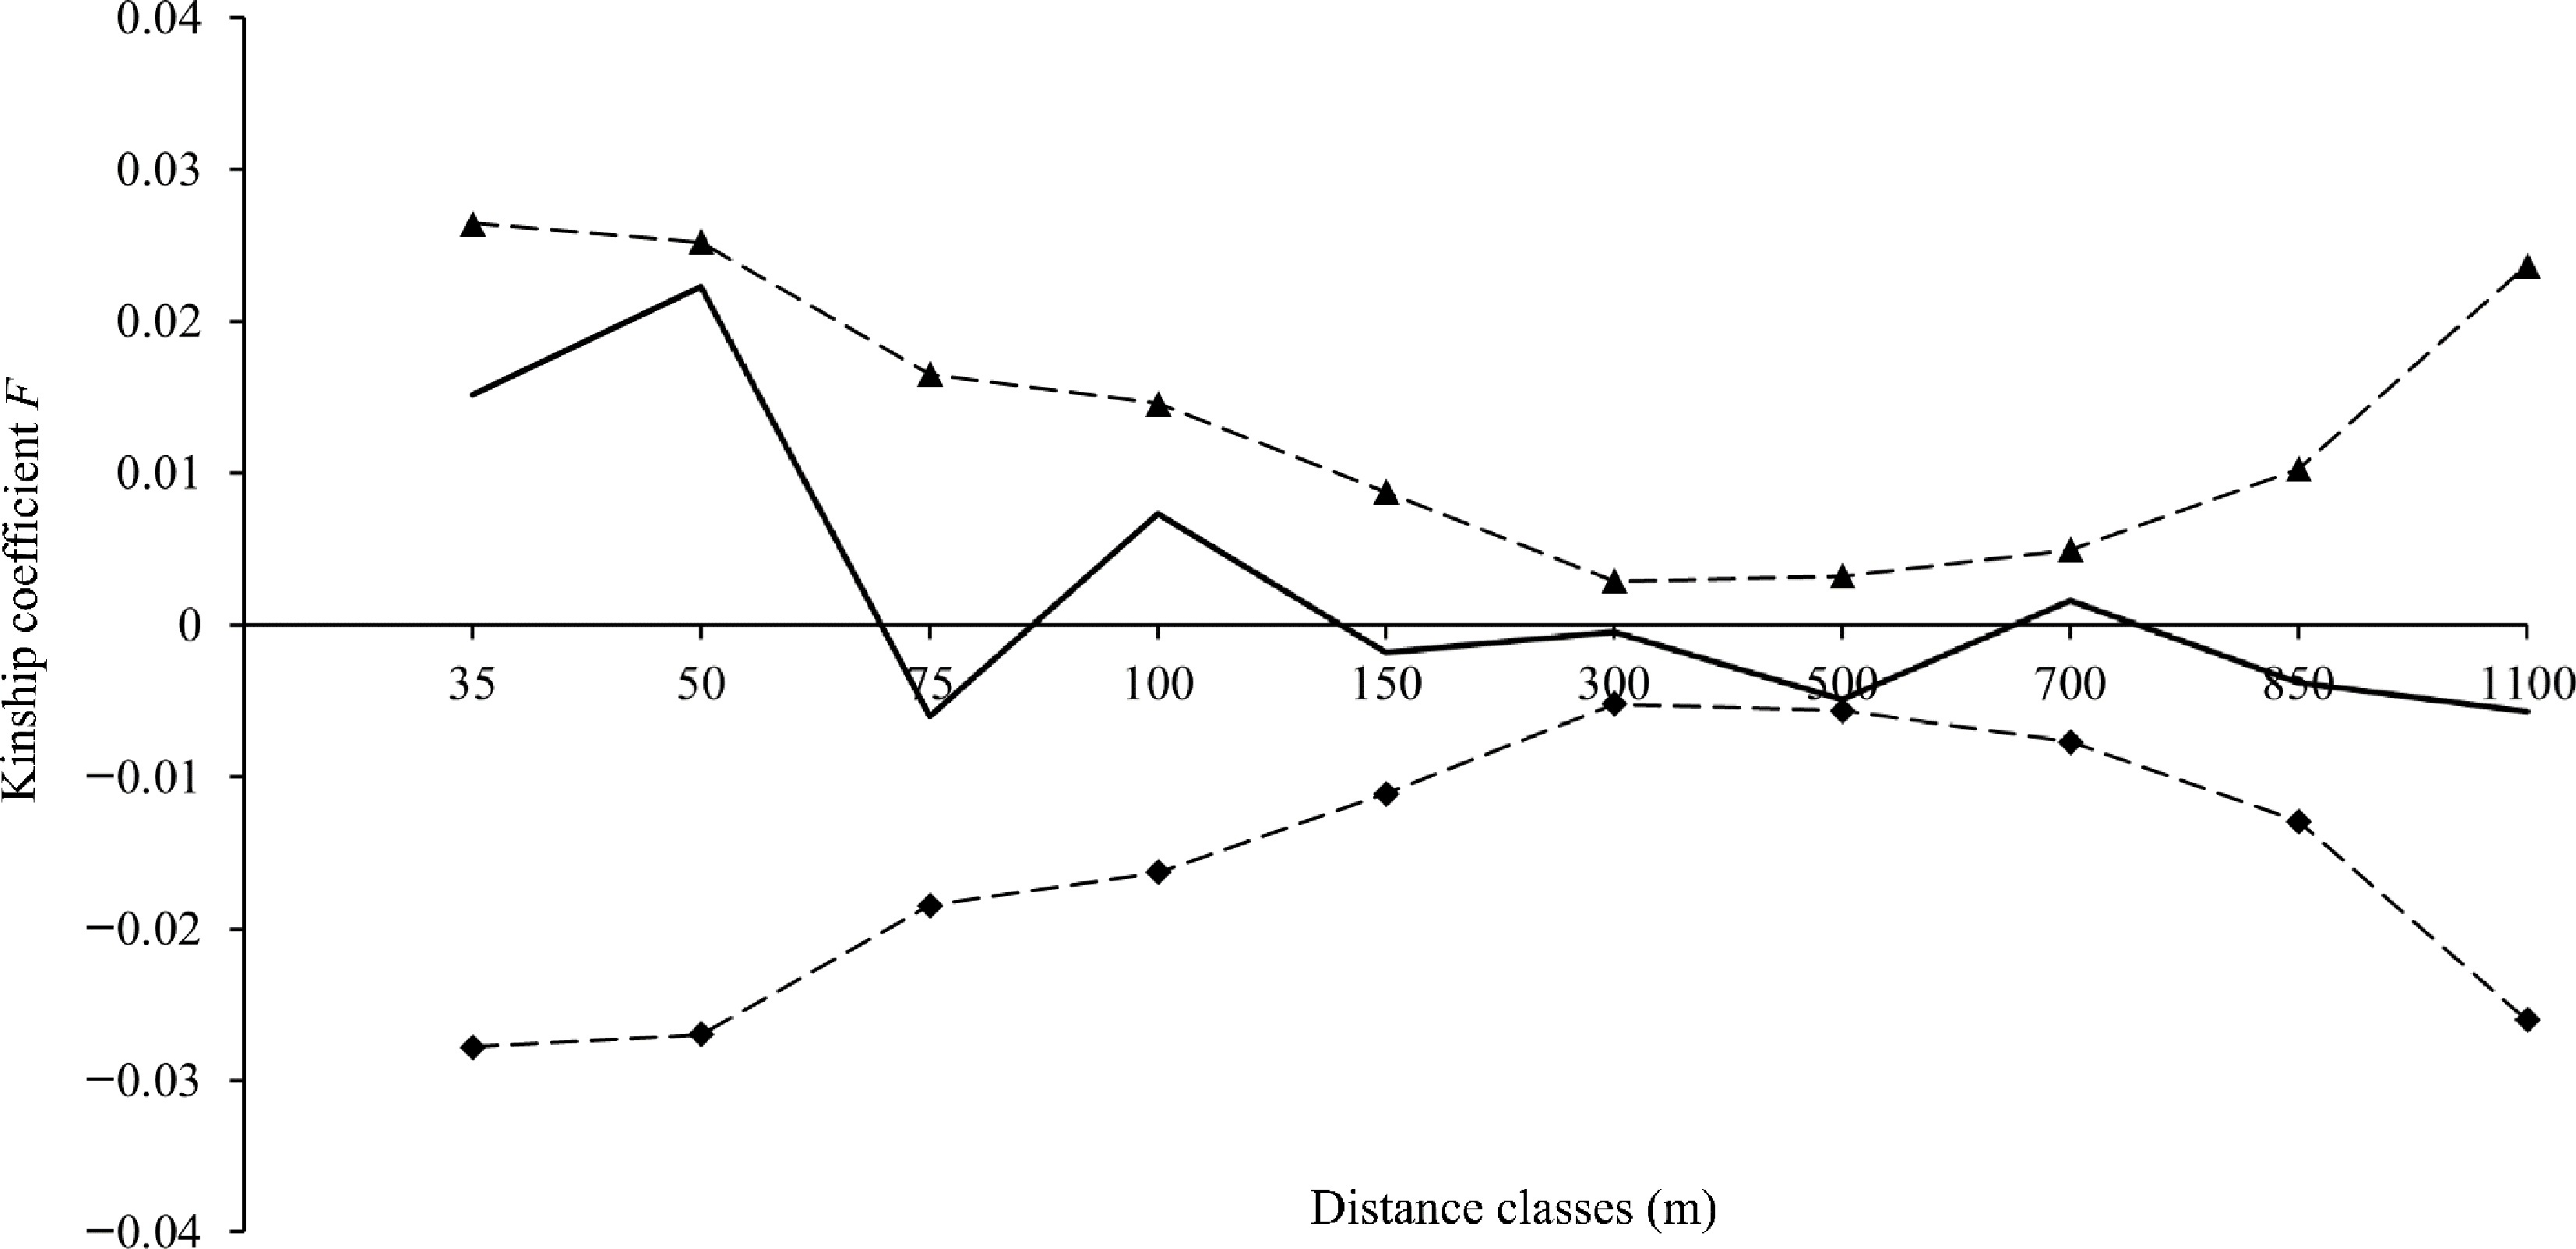
      Figure 6. 

      Fine-scale genetic structure of V. mangachapoi in Shimei Bay. The solid line represents the mean Kinship coefficient F (Loiselle et al.[41]), and the dashed lines represent the 95% confidence intervals of the mean Kinship coefficient F.

    • Due to rapid coastal development and village expansion, the coastal population of V. mangachapoi declined and fragmented into several small and discontinuous patches[12] (Fig. 2). However, there was no significant difference in genetic diversity between the coastal (SM and RY) and the rainforest (TT) populations (Table 1), and the effective sizes of the three populations are quite close (Table 3). Besides, no recent bottleneck could be detected in these populations (Fig. 3). The results indicated that the sizes of the two coastal populations are still large to maintain a comparative level of genetic diversity relative to that of the rainforest population nearby[44]. In addition, the three V. mangachapoi populations were demonstrated to share a homogenous genetic structure and there is little differentiation between them (Figs 4 & 5). In summary, patterns of SSR variation observed in V. mangachapoi suggested either genetic connection through gene flow or not enough time to accumulate divergence after fragmentation of the coastal forest dominated by V. mangachapoi.

      Frequent gene flow can prevent rapid loss of genetic variation and differentiation between patches in a fragmented population[45, 46]. Vateriopsis seychellarum is endemic in the Seychelles, after a long period of logging, only a few hundred adult trees remained. Nevertheless, a relatively high level of genetic diversity was found in this species. Long-distance gene flow between isolated patches of Va. seychellarum was considered as the main reason to maintain genetic variation in this species[25]. If pollinators can travel across the gaps created by fragmentation, pollen-mediated gene flow could be maintained between patches, as a result, genetic drift happened within patches would be mitigated in the short term[26, 47, 48]. In this study, frequent gene flow (Nm > 1) was detected between the three V. mangachapoi populations. Besides, the time of fragmentation of the coastal V. mangachapoi forest is relatively short comparing with the generation time of this species. Differentiation between patches is probably impeded by gene flow or there is not enough time to accumulate significant divergence among them, and genetic variation could be largely maintained within the coastal V. mangachapoi forest.

    • No significant FSGS was detected in the SM population of V. mangachapoi, which may result from long distance dispersal of seeds and/or pollens within population[24, 49]. Two of the five sepals of V. mangachapoi flowers keep growing and develop into functional wings of the fruits that would promote seed dispersal by wind[19, 50]. Hainan Island will experience frequent Pacific typhoon from June to October each year, and the time of fruit ripening of V. mangachapoi (mid to late July-August) coincides well with the activities of the Pacific typhoon[51]. Moreover, Wanning City is one of the locations where typhoons frequently make landfall on Hainan Island. The coastal V. mangachapoi forest at Shimei Bay would be highly likely to encounter a Pacific typhoon during its fruit ripening period. Strong convection currents can carry winged fruits of V. mangachapoi into the upper air and achieve a long-distance horizontal dispersal with hundreds of meters, which may account for the lack of significant FSGS in the SM population[52, 53].

      Pollen-mediated gene flow can also influence the strength of FSGS, and restricted gene flow generally results in significant FSGS[22, 24, 54]. Kettle et al. studied the FSGS of three dipterocarp species from the tropical rainforests at Borneo[54]. No clear signal of FSGS was detected in Dipterocarpus grandiflorus, a species pollinated by large pollinators with strong mobility, which may facilitate long-distance pollen flow. On the contrary, S. xanthophylla and Parashorea tomentella had significant FSGS, probably because they were pollinated by small pollinators and consequently short distances of pollen flow. Lee et al. studied the FSGS of S. parvifolia populations in different habitats[22]. They found that populations in montane rainforests, which were mainly pollinated by large pollinators, had no FSGS, whereas populations in lowland rainforests, which were pollinated by small pollinators, had significant FSGS. Lee et al. suggested that it is the restricted pollen flow that leads to strong FSGS in the lowland dipterocarp rainforests[22]. However, as the distance of pollen-mediated gene flow of V. mangachapoi is unclear at present, the relative contribution of seed and pollen dispersal to the random distribution of genotypes in space deserve further studies.

    • In this study, we demonstrated that there was no significant difference in genetic diversity among the two coastal V. mangachapoi populations and one rainforest population near the coast. Moreover, little differentiation and frequent gene flow were detected between the three populations. Even though the coastal populations maintain a relatively high level of genetic diversity, the extremely simple community structure and poor species richness of the coastal V. mangachapoi-dominated forests indicate that this unique community is much more fragile than other dipterocarp communities[55, 56]. In addition, the coastal V. mangachapoi-dominated forest is likely to degrade into a sandy scrub community or bare sandy beach in the near future if intense anthropogenic disturbance persists. Therefore, further logging and invasion of the coastal forest must be strictly prohibited, and saplings of V. mangachapoi should be planted in forest gaps to promote the restoration of the coastal V. mangachapoi-dominated forest landscape.

    • The fragmented coastal V. mangachapoi-dominated forest in Shimei Bay have not yet exhibited significant genetic differentiation and diversity loss. The winged fruits of V. mangachapoi may promote seed dispersal and maintain gene flow between populations, which could mitigate genetic drift and lead to random distribution of genotypes within population. In addition, comparing with the generation time of V. mangachapoi, the time of fragmentation of the coastal V. mangachapoi forest is relatively short, so there is not enough time to accumulate differentiation for populations from the fragmented forest. Based on the above findings, we suggest to strengthen the protection of the coastal V. mangachapoi forest to prevent further deforestation. Besides, saplings of V. mangachapoi should be planted to connect isolated populations and facilitate the restoration of the unique coastal V. mangachapoi forest.

      • We thank W-Q Xiang, S-Q Zhu and Y Cai of Hainan University for their help on data analysis and collection of samples. We also thank the Provincial Nature Reserve of Vatica mangachapoi at Wanning City for their help on field research. This study was supported by the National Natural Science Foundation of China (Grant No. 32060236) and the Key R&D Projects of Hainan Province (Grant No. ZDYF2022XDNY260).

      • The authors declare that they have no conflict of interest.

      • Received 6 May 2023; Accepted 14 June 2023; Published online 5 July 2023

      • There is no significant difference in genetic diversity between the coastal and lowland V. mangachapoi populations.

        No fine-scale spatial genetic structure was detected in the coastal SM population.

        Strong gene flow between populations accounts for the homogenous genetic structure of the coastal and lowland populations.

        There is not enough time to accumulate differentiation between fragmented populations in the coastal forest.

      • Supplemental Fig. S1 Neighbor-joining tree based on Nei's (1983) genetic distance for V. mangachapoi.
      • Supplemental Table S1 Analysis of molecular variance (AMOVA) for the three V. mangachapoi populations.
      • Copyright: © 2023 by the author(s). Published by Maximum Academic Press on behalf of Hainan University. This article is an open access article distributed under Creative Commons Attribution License (CC BY 4.0), visit https://creativecommons.org/licenses/by/4.0/.
    Figure (6)  Table (3) References (56)
  • About this article
    Cite this article
    Duan J, Wang H, Tang L. 2023. Effects of habitat fragmentation on the coastal Vatica mangachapoi forest (Dipterocarpaceae) in Shimei Bay, Hainan Island, China. Tropical Plants 2:8 doi: 10.48130/TP-2023-0008
    Duan J, Wang H, Tang L. 2023. Effects of habitat fragmentation on the coastal Vatica mangachapoi forest (Dipterocarpaceae) in Shimei Bay, Hainan Island, China. Tropical Plants 2:8 doi: 10.48130/TP-2023-0008

Catalog

  • About this article

/

DownLoad:  Full-Size Img  PowerPoint
Return
Return