


-
Tea plant, Camellia sinensis, belonging to genus Camellia is one of the most popular and widely consumed beverages and important economic crops in the world, which contains nearly 700 bioactive compounds, including catechins, theanine, caffeine, and volatiles[1−4]. Tea plants originated in the Yunnan Guizhou Plateau of China and gradually spread to the east, southeast and east of China. Hunan is located in central China, a transitional zone of biodiversity from southwest to southeast and northeast, which created an excellent natural environment for broad genetic variations of tea plants in Hunan.
Plant genetic resources have been known as one of the most important natural resources, and they have become a significant research topic. As a result, major advances have been made in the field. Gene banks are associated with the maintenance of germplasm and genetic diversity. In recent years, the conservation of plant genetic resources has attracted immense attention. Aimed at developing effective and efficient conservation practices for plant genetic resources, understanding the genetic diversity between and within the population is important[5−7]. Analysis of genetic diversity and a populations genetic structure is significant to verify domestication events and genetic relationships of tea plants. In the past, molecular markers, including restriction fragment length polymorphism (RFLP), amplified fragment length polymorphism (AFLP), random amplified polymorphic DNA (RAPD), inter-simple sequence repeat (ISSR) and simple sequence repeats (SSR) have been effectively used to assess the genetic diversity of tea resources in Hunan, and this analysis showed that Hunan origined tea plant germplasm could be categorized into five subpopulations, these being: 'Rucheng Baimaocha'[8], 'Chengbu Dongcha'[9], 'Huangjincha'[10,11], 'Jianghua Kucha'[12−14] and 'Anhua Yuntaishancha'[15]. With the development of high-throughput sequencing technologies, GBS has been successfully applied into germplasm diversity analysis, and it provides accurate results independently of the target species or population. Due to the characteristics of simple operation, high cost performance and good stability, GBS technology has become a hot spot in the research of genetic relationships, genetic diversity and genetic evolution[16]. Recently, GBS has been applied in the origin and evolution of many crops, such as cucumber[17], pear[18], wheat[19], and so on. In the present study, the population structure, genetic diversity and core collection of 110 tea accessions from Hunan (including 15 Yunnan origin cultivars as control) were analyzed by GBS. Our findings will provide a valuable resource for further understanding the genetic composition and genetic relationship of tea resources in Hunan, which will provide scientific reference for protection and utilization of Hunan tea plants.
Plant materials and growth conditions
-
A total of 110 tea plant accessions were collected in this study (Supplemental Table S1) and all accessions were classified into seven populations according to geographical location, including six populations from six different regions of Hunan province and one population from Yunnan province in China, which was composed of six accessions used as control that were collected from Yunnan Tea Research Institute. One population with 17 accessions was collected from Mangshan nature reserve, and the remains of five populations with 87 accessions were collected from Hunan tea germplasm resource garden (Fig. 1).
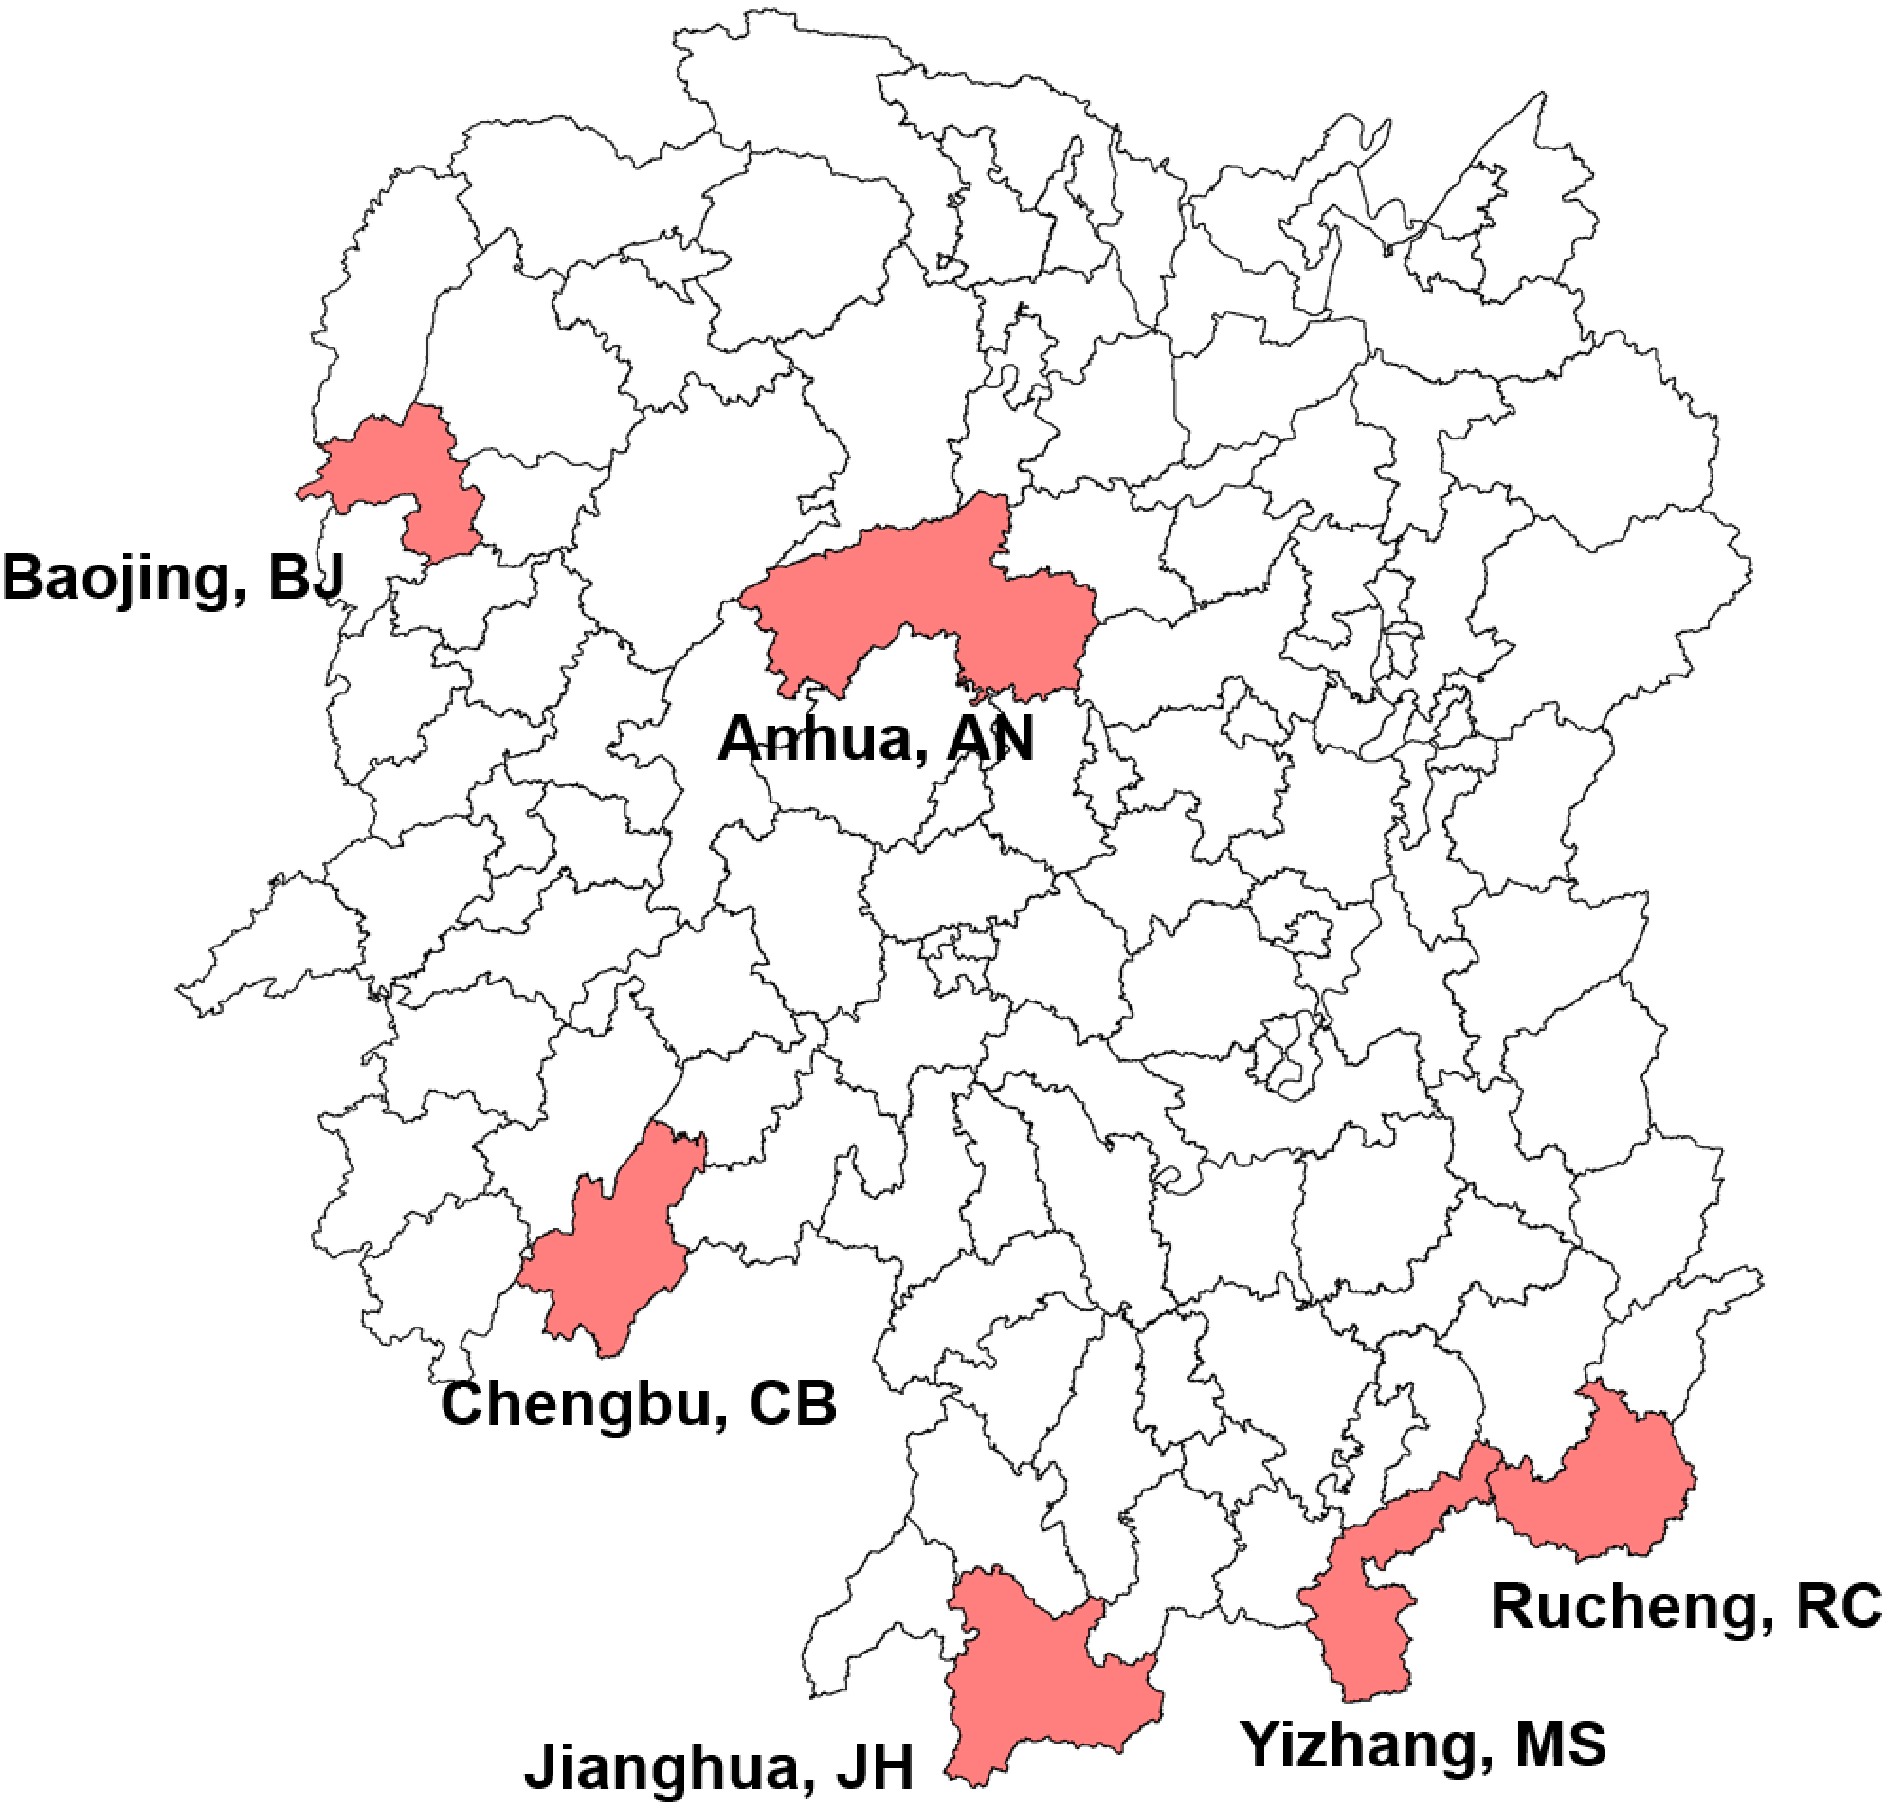
Figure 1.
Geographical distribution of Hunan tea plant accessions used in this study. The geographical locations were indicated under the corresponding regions, followed by the abbreviated population name.
DNA extraction, library preparation, and sequencing
-
DNA was extracted from 200 mg of fresh leaf tissue of each sample with QIAGEN plant mini kit (Qiagen, Valencia, CA, USA). DNA purity and concentration were analyzed by NanoPhotometer® spectrophotometer (IMPLEN, CA, USA) and Qubit® 2.0 Flurometer (Life Technologies, CA, USA), respectively. Subsequently, genomic DNA of the accessions was digested with restriction enzyme MseI and NlaIII, and the degradation and contamination was monitored on 1% agarose gels. After adding the adaptors with barcode, DNA fragments with 375−400 bp in length were selected for amplification to construct a paired end sequencing library and subsequently were subjected to sequencing using Illumina Hi-Seq PE150 system.
Sequence processing and SNP calling
-
The original image data obtained via sequencing was transformed into raw reads in FASTQ format by base calling analysis. Joint reads and low quality paired reads (reads with ≥10% unidentified nucleotides (N), > 10 nt aligned to the adaptor, allowing ≤ 10% mismatches, > 50% bases having phred quality < 5) were filtered out to obtain clean data. The clean reads were mapped to the 'Shuchazao' reference genome[3] (
http://tpia.teaplant.org/download.html ) using BWA (Burrows-Wheeler Aligner) (V ersion: 0.7.8)[20]. SNP calling was performed using SAMtools[21].Population structure, evolutionary tree and principal component analysis
-
Heterozygosity analysis was performed by Plink v1.9[22]. A phylogenetic tree was constructed using MEGA (
www.megasoftware.net ) with neighbor-joining (NJ) method. A web tool called iTol (https://itol.embl.de ) was used for data visualization. Population structure was analyzed using the ADMIXTURE v1.3.0[23] with 10 independent simulations for each K value ranging from 1−5 (Fig. 2). The optimal number of clusters was determined based on the minimum cross entropy and population structure map was drawn by R language package plot. Plink was used for principal component analysis based on default parameters[22], and the principal component distribution map was drawn in R language package plot3d.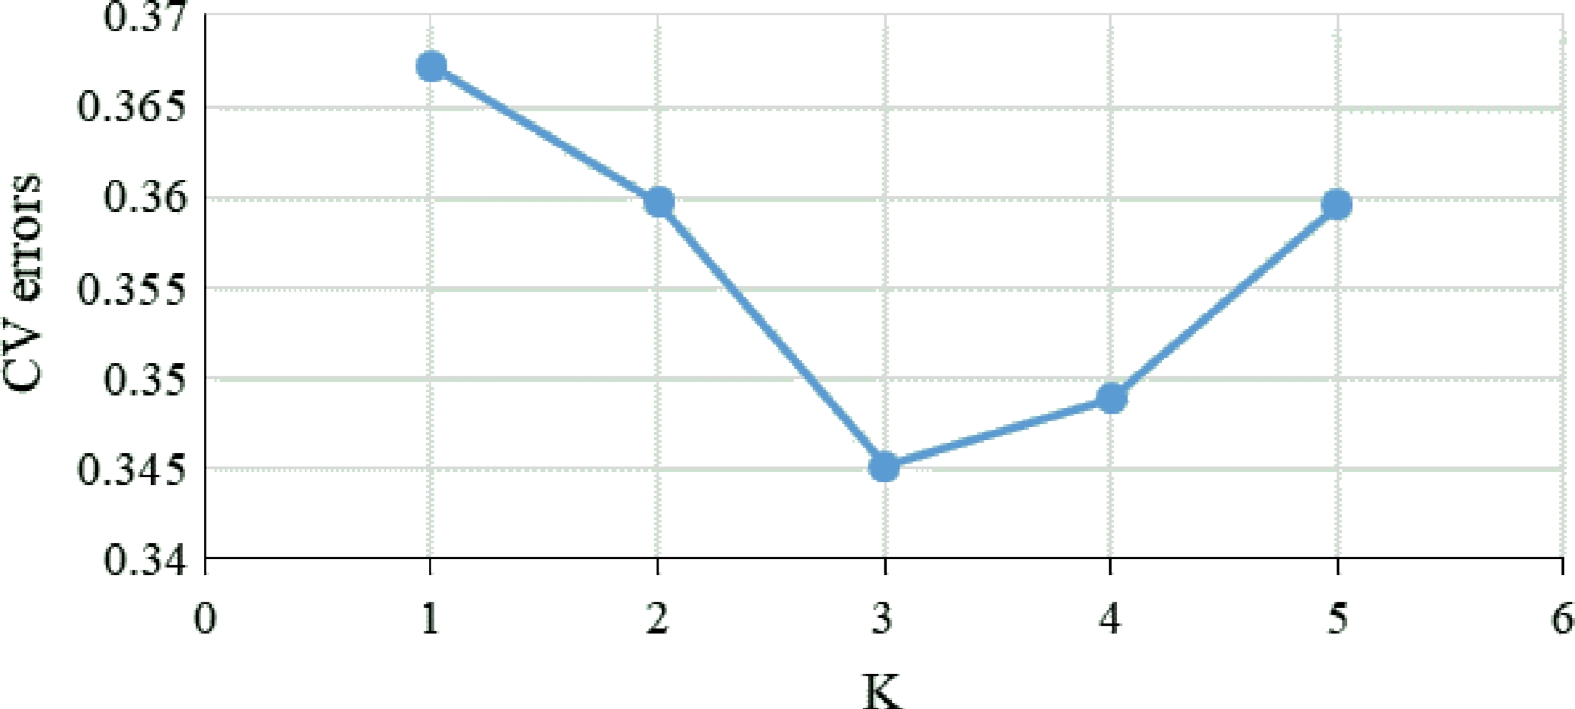
Figure 2.
Calculation of CV errors for K values from 1 to 5.
Genetic diversity analysis and core germplasm development
-
Genetic diversity analysis, including Nei's genetic diversity index (H), polymorphic information content (PIC), minor allele frequency (MAF) and observed heterozygosity (Ho)[24,25], was analyzed using R language package snpReady-popgen. R package poppr.amova was used for the analysis of molecular variance (AMOVA)[26,27]. The core collection of Hunan tea plant germplasm was developed using R package Core Hunter 3.0.
-
A total of 195.85 GB sequencing data was obtained from 110 tea plant collections. After filtering out the low-quality data, 195.82 GB high-quality sequence data was finally obtained. On average, 6,178,038 clean reads were obtained for each sample. The average high-quality sequence data of each sample was 1.78 GMB, accounting for about 60.75% of the genome size (2.93 GB) of tea plant. The filtered sequences were compared with the tea reference genome. The results showed that the average mapping rate of 110 samples was 96.76%. Samtools was used to detect the variation of the sequence of each material compared to the reference genome. After filtering, 311,044 high-quality SNP were obtained, and transformation type SNPs (TS, a/g or C/T) accounted for 76.6%, the transversion type SNPs (TV) for 23.4%. The annotation results of gene structure distribution showed that 89.3% of high-quality SNP loci were distributed in the intergenic region. Further analysis of SNP loci in gene region showed that 18,330 SNPs were distributed in intron, 3,657 SNPs were distributed upstream and 3,607 SNPs were distributed downstream, while 2,952 SNPs distributed in the exon region resulted in synonymous mutation, and 3,534 SNPs resulted in nonsynonymous mutation. The average of Q30 was 89.31% and the average of GC was 49.36% within 110 accessions (Supplemental Table S2).
Population structure analysis
-
A total of 311,044 high quality SNPs were used to analyze population structure using ADMIXTURE. Firstly, the values of cross-validation error (CV) were calculated using ADMIXTURE for each K to select an optimal number of populations. The results showed that the CV value reached the lowest when K = 3, which indicated that the optimal number of populations should be three, and the whole population was divided into three groups under that condition. When K = 2, the YN (Yunnan) population could not be separated from the populations of Hunan. Under that condition, accessions in AN and HJ were clustered into one group, while the rest of the populations were clustered into another group (Fig. 3). The SNP panel set separated the populations into three geographical types, these were the Yunnan group, south of Hunan group and north of Hunan group, at the CV value at K = 3 (Fig. 3). However, some of accessions in the MS population were assigned to YN groups. When K = 4, the YN population was clearly separated from the populations of Hunan and accessions in RC were clearly separated from those in CB, MS, and JH (Fig. 3). When K = 5, the group clustered by AN and HJ, which were assigned to the north of Hunan type, was divided into two subgroups (Fig. 3). However, the south of Hunan group, including CB, MS, and JH could not be clearly separated at any K value (Fig. 3), which indicated that extensive gene flow should happen among the three geographical populations.
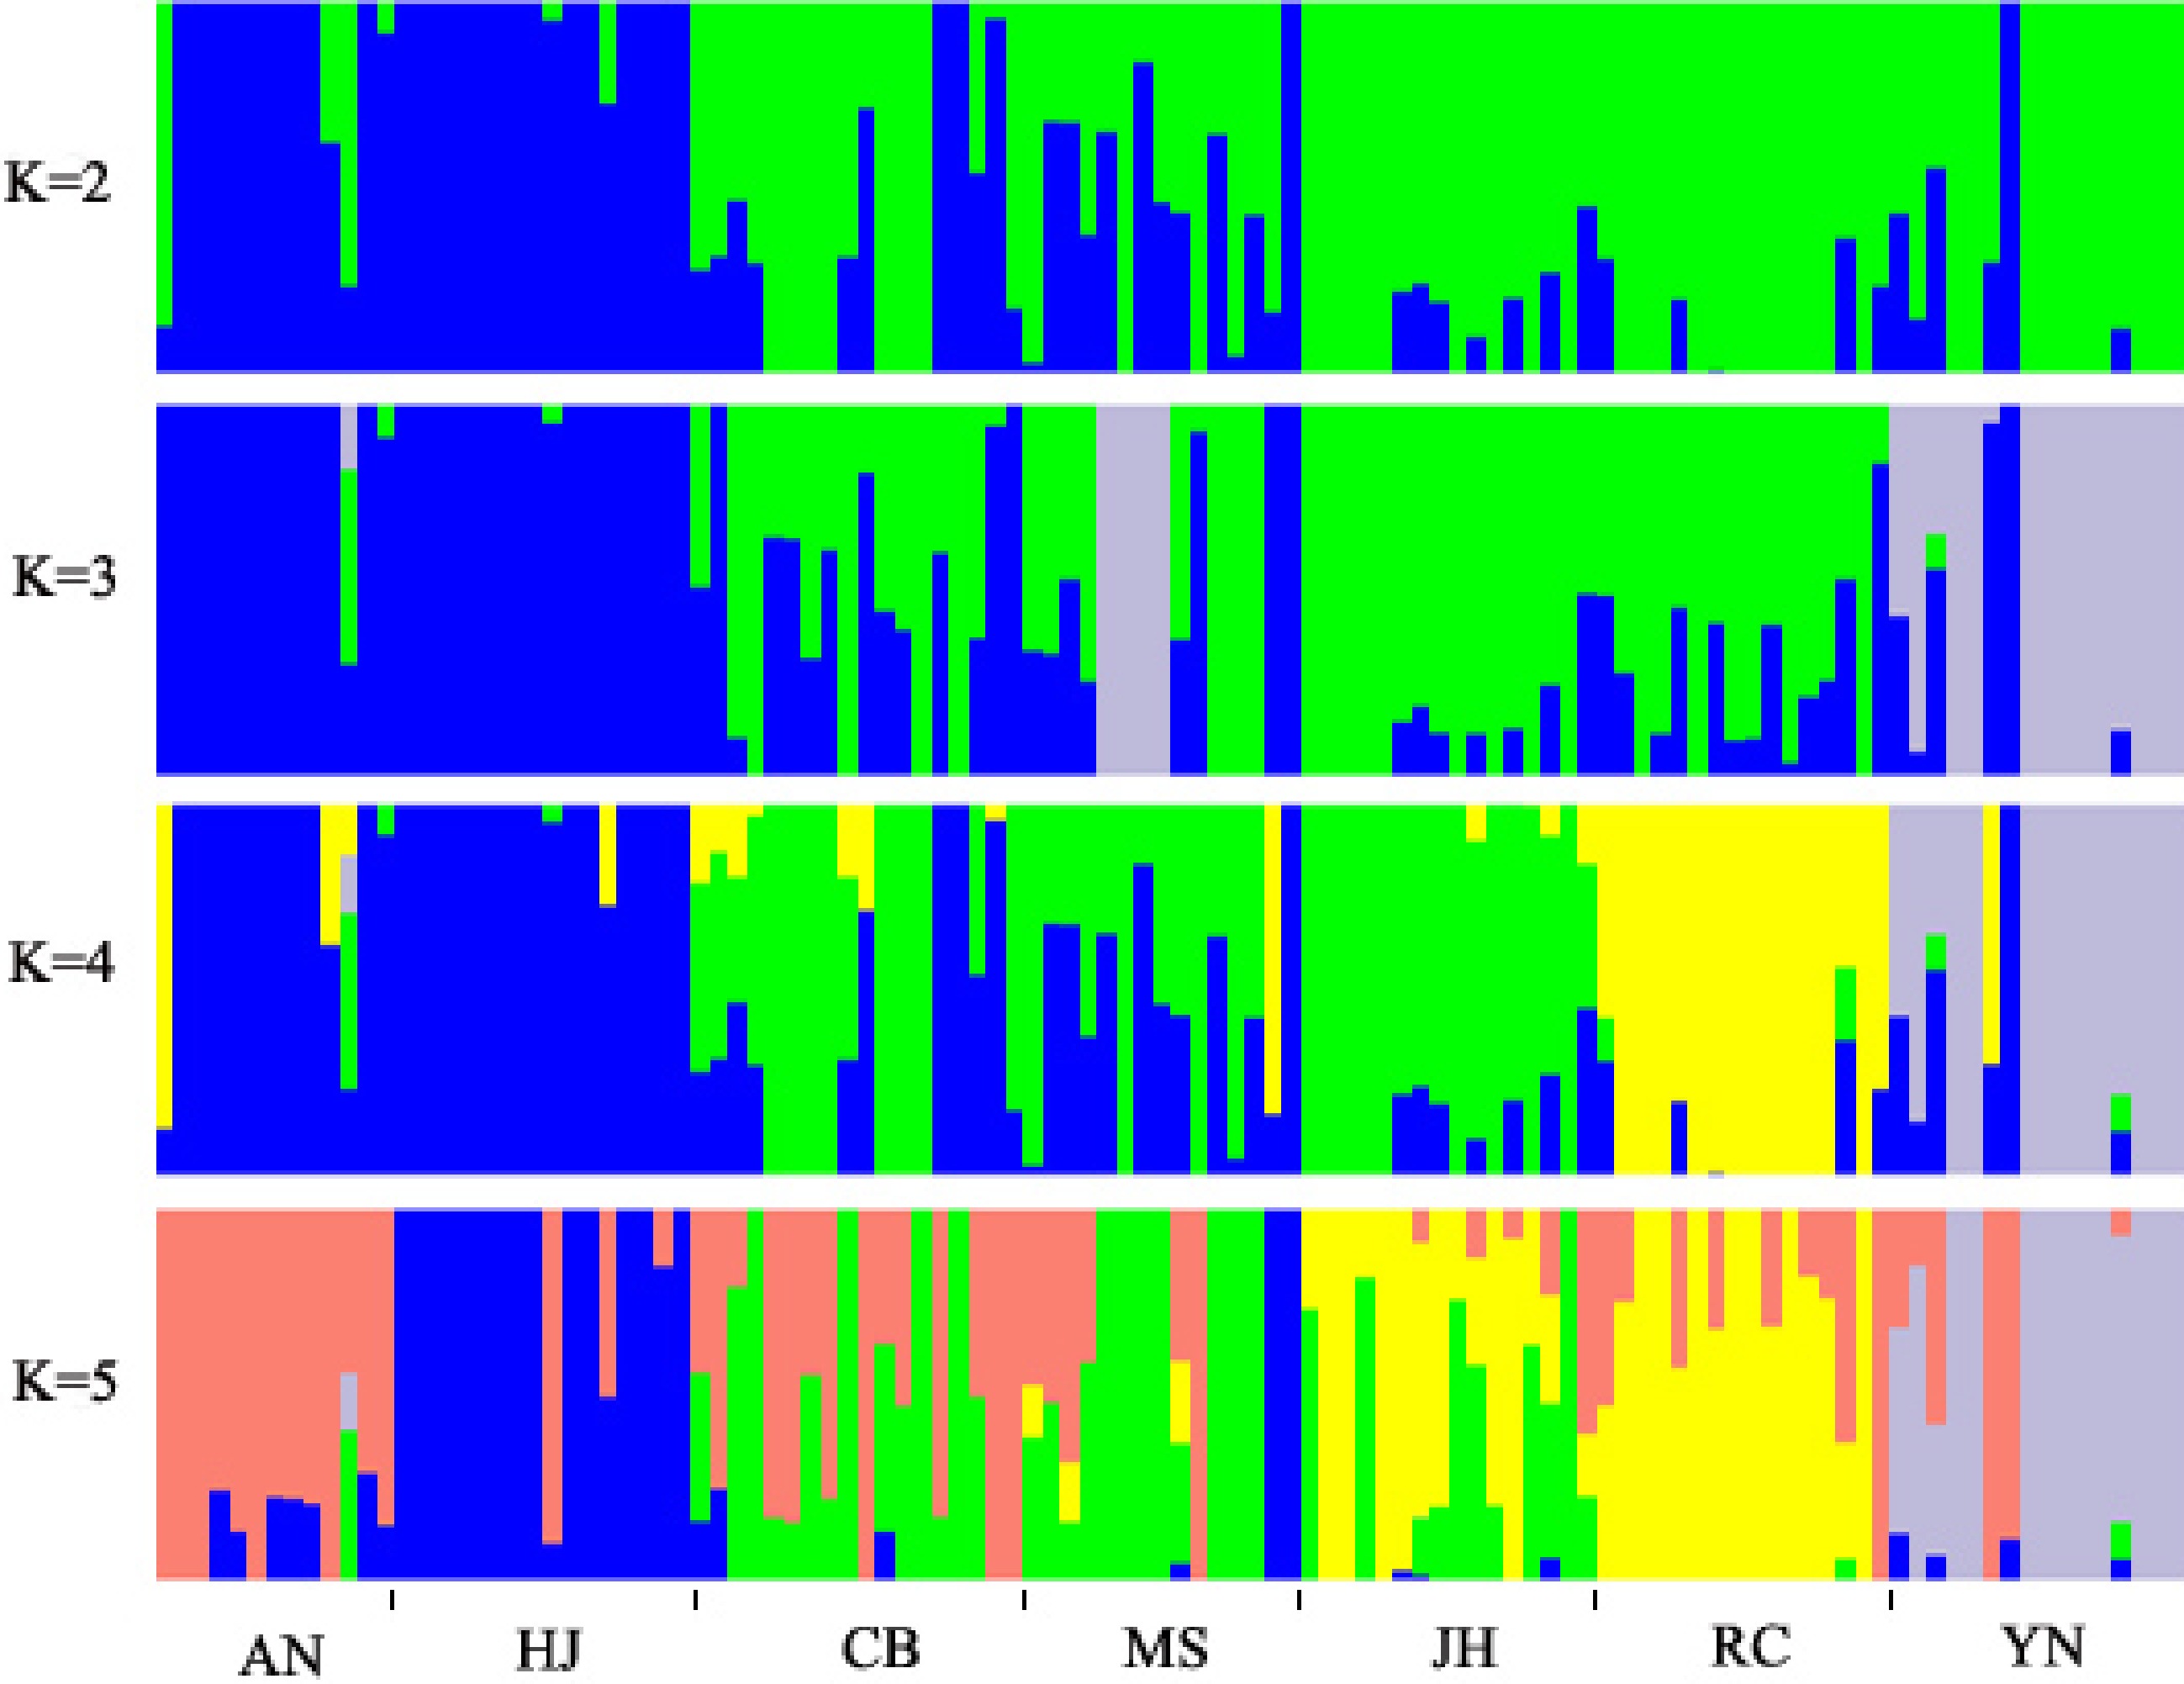
Figure 3.
Analysis of population structure by ADMIXTURE. The x-axis indicates different research materials and the y-axis shows membership probability belonging to different populations.
In order to validate the results of structural analysis, PCA was performed using an R package, and the result showed that all of the 110 accessions were clearly clustered into three groups (Fig.4), which was consistent with the results of structure analysis at K = 3 (Fig. 3). A NJ tree (Fig. 5) built on the basis of SNPs was used to determine the genetic relationship among tea plant accessions, and a similar result of structure analysis at K = 3 was obtained. All the tea plant accessions in seven geographical populations are located in three independent branches (Fig. 5). Fourteen, 33 and 63 accessions were assigned to group I, II, III, respectively (Fig.5). Eighty-seven percent of all accessions in YN population were distinguished from other accessions from Hunan, and they belonged to a single group (Fig. 5), which confirmed the results of PCA (Fig. 4) and structure analysis with K = 3 (Fig. 3). Most accessions of MS, JH and part of CB were clustered into group II. Most of RC, AN, HJ and part of CB were clustered into group III, and three subgroups were formed in this group (Fig. 5). Eighty-seven of the accessions in population RC were clustered into one subgroup, while eight accessions in CB were assigned to one subgroup (Fig. 5). Meanwhile, most accessions in AN and HJ were clustered into one subgroup (Fig. 5).
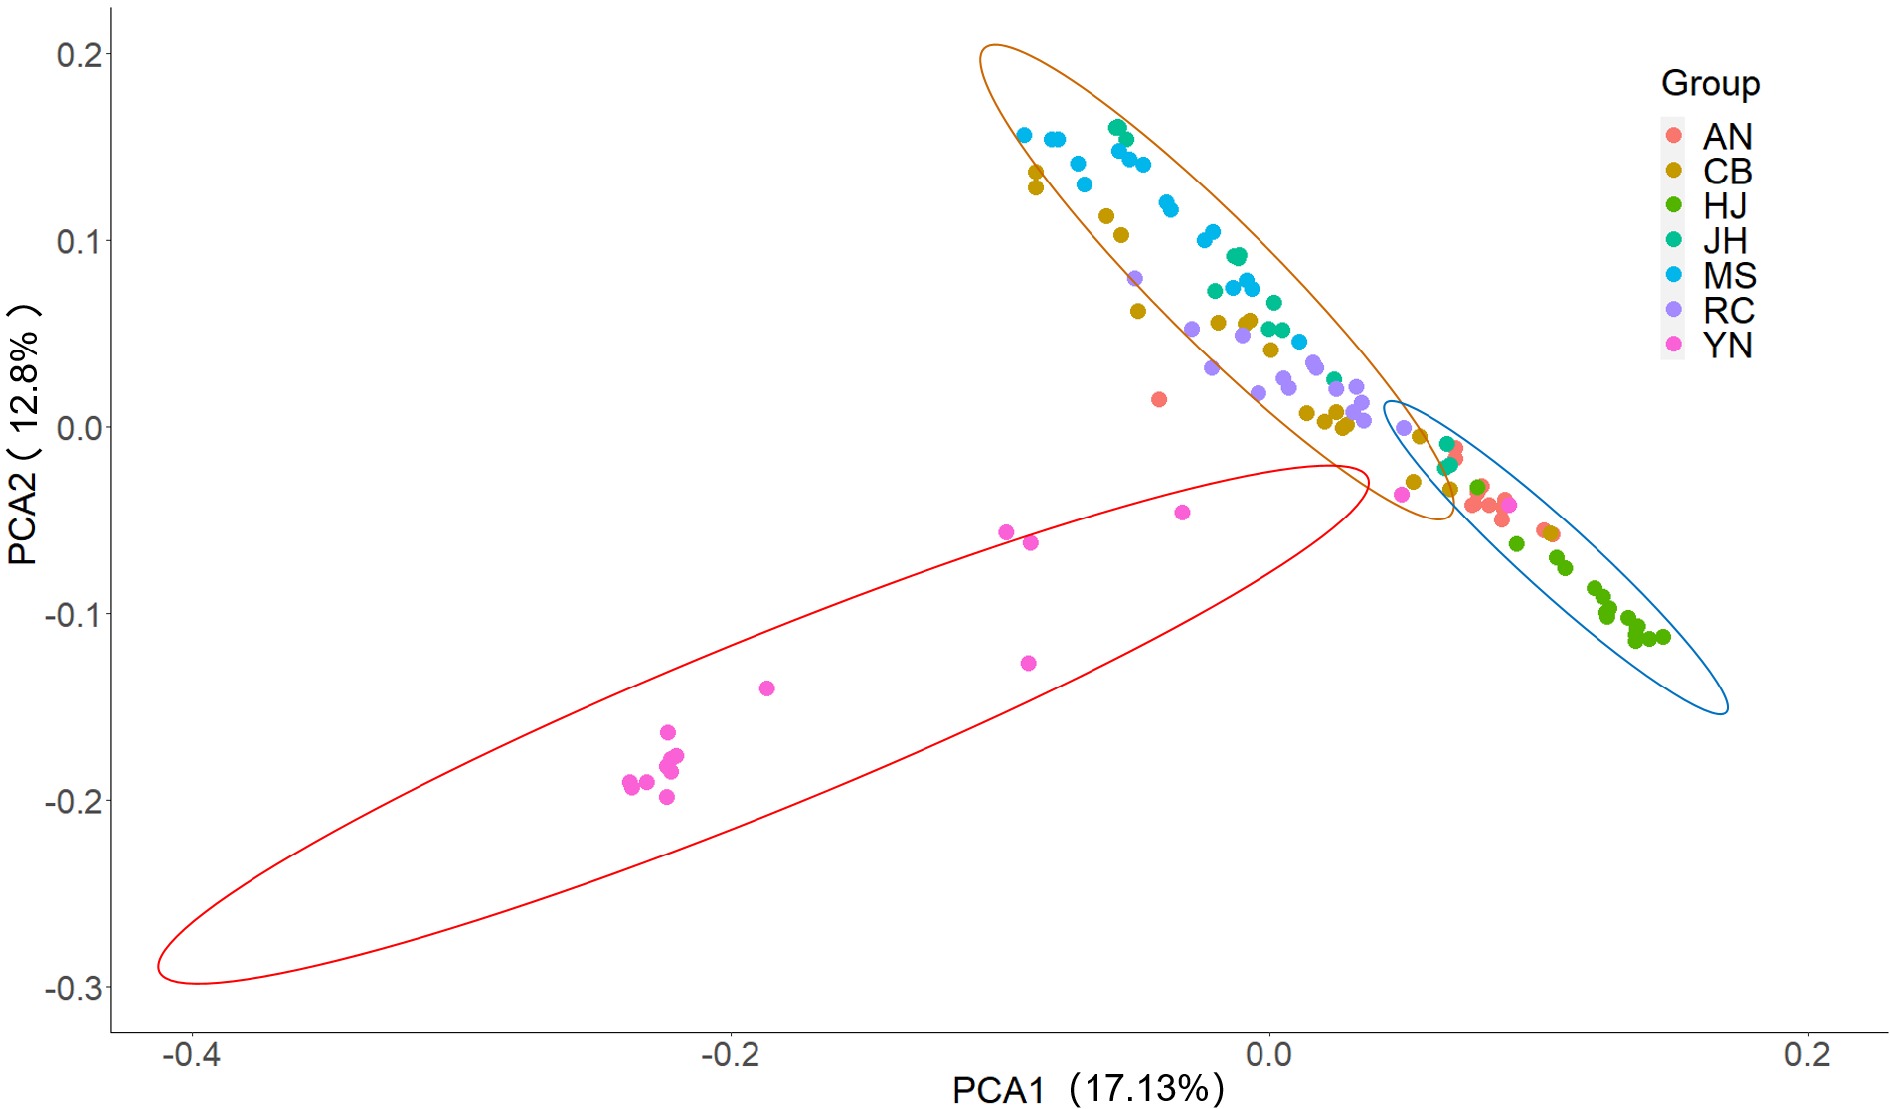
Figure 4.
PCA plot of the 110 samples based on the top three principal components with different colors representing the populations, which were divided into three groups by the range of circles with 95% confidence level.
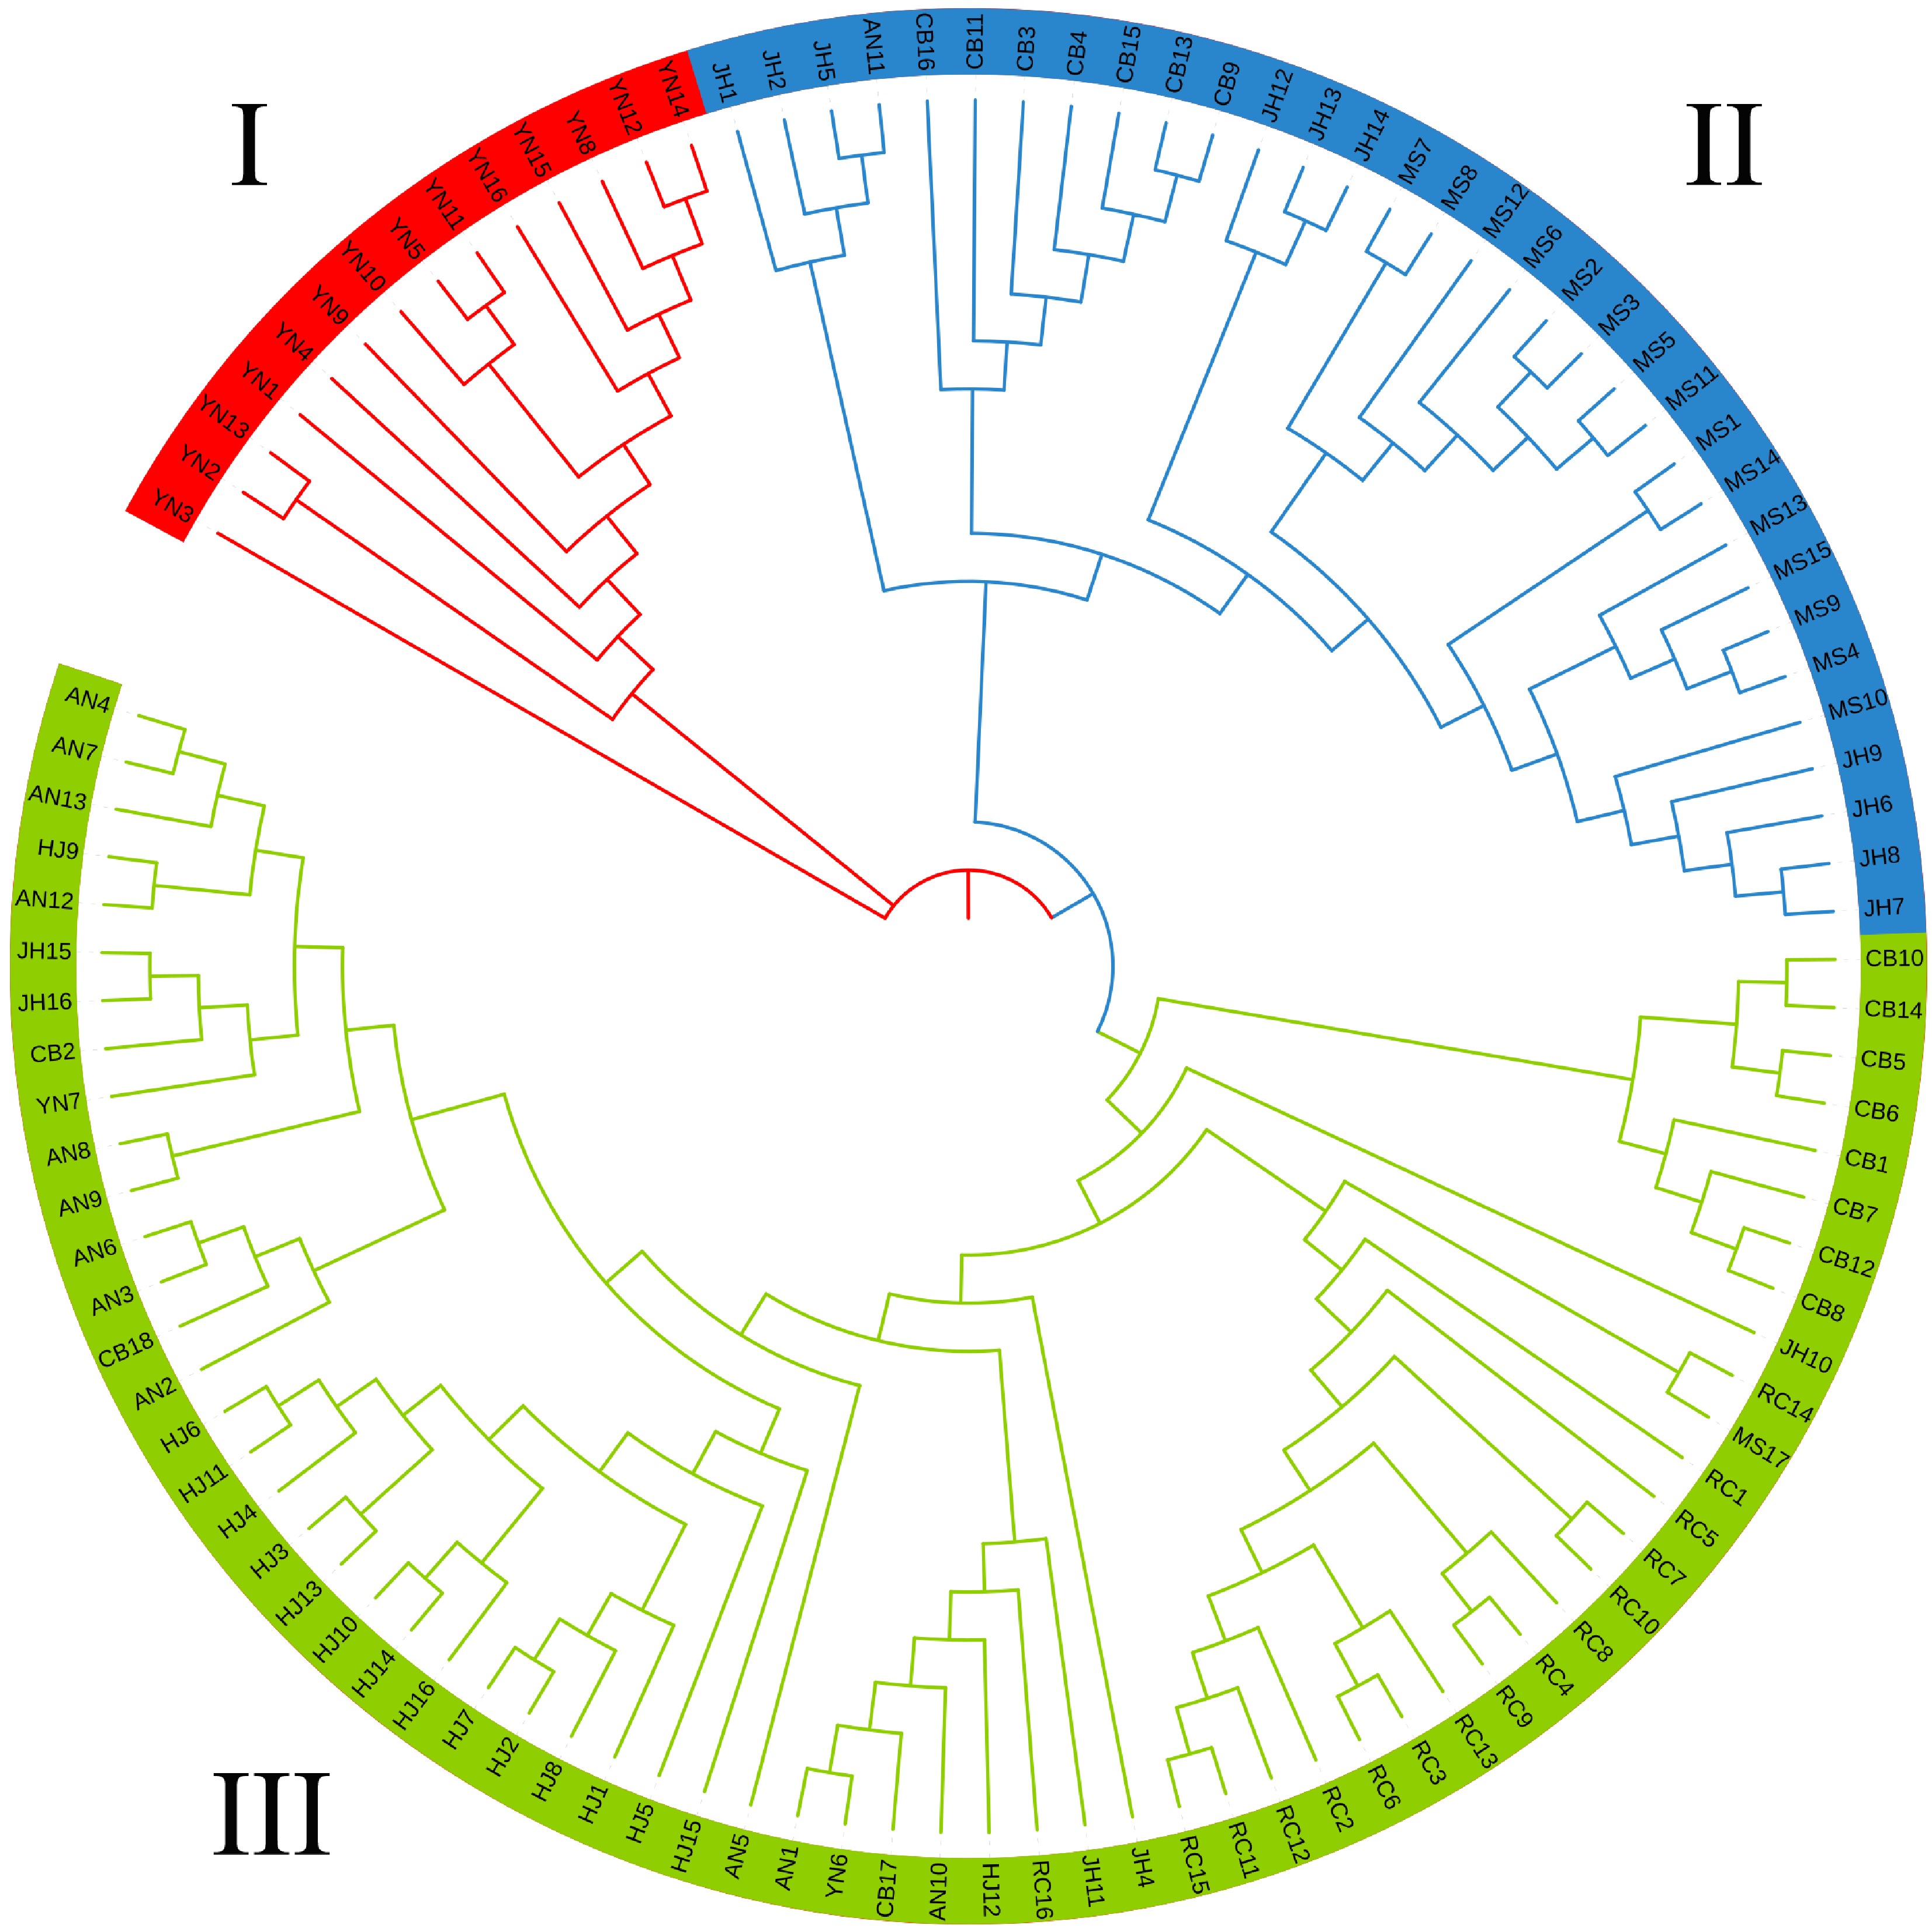
Figure 5.
Phylogenetic tree of the 110 samples with three different colors indicating three groups obtained from the ADMIXTURE analysis result.
Genetic diversity analysis
-
In order to analyze the genetic diversity of the seven tea plant populations, the genetic parameters, containing PIC H, Ho and MAF were calculated respectively. As shown in Table 1, the value of H suggested that population HJ showed the highest genetic variation, while the population of YN indicated the lowest genetic variance. At the same time, the mean Ho ranged from 0.16 (YN) to 0.24 (HJ) (Table 1). The lowest PIC value was 0.14, whereas the highest PIC value reached 0.17. It was found that the mean MAF values ranged from 0.11 in YN population to 0.14 in HJ population (Table 1), which showed a similar tendency as the PIC values.
Table 1. H, Ho, PIC and MAF values among seven tea plant populations and three inferred groups.
Population H Ho PIC MAF Mean Range Mean Range Mean Range Mean Range Seven population accessions YN 0.16 0.08−0.50 0.16 0.11−0.25 0.14 0.11−0.38 0.11 0.08−0.50 RC 0.18 0.07−0.50 0.20 0.15−0.22 0.15 0.09−0.38 0.12 0.09−0.50 CB 0.20 0.10−0.50 0.21 0.18−0.24 0.17 0.12−0.38 0.12 0.08−0.50 MS 0.20 0.10−0.52 0.22 0.17−0.25 0.16 0.07−0.38 0.13 0.10−0.50 JH 0.20 0.11−0.53 0.22 0.18−0.25 0.17 0.09−0.38 0.13 0.10−0.50 AN 0.20 0.10−0.50 0.23 0.17−0.28 0.17 0.12−0.38 0.13 0.11−0.50 HJ 0.22 0.12−0.54 0.24 0.20−0.31 0.16 0.10−0.38 0.14 0.12−0.50 Three groups based on Mega and ADMIXTURE I 0.15 0.10−0.50 0.15 0.11−0.25 0.12 0.05−0.38 0.10 0.07−0.50 II 0.21 0.17−0.50 0.21 0.15−0.28 0.18 0.10−0.38 0.13 0.08−0.50 III 0.21 0.16−0.50 0.22 0.17−0.31 0.17 0.09−0.38 0.14 0.09−0.50 Population differentiation analysis
-
Fst analysis and AMOVA were used to assess the genetic differentiation among the seven population groups. The results showed that the Fst value ranged from 0.052 to 0.221, and the highest population differentiation existed between YN and HJ, then between MS and HJ (Table 2). The Fst value between YN population and any other population originating from Hunan was higher than that within Hunan groups, which was consistent with geographical differences. In Hunan region groups, the HJ population showed the biggest population differentiation with other populations in Hunan except the AN population, based on Fst analysis (Table 2). Moreover, there was a lower Fst between the CB population and other populations from Hunan (Table 2). AMOVA results indicated that only 18.6% of the total variance was attributed to genetic differentiation among the seven populations, while 81.38% of the variance was attributed to genetic differentiation within a population (Table 3), which implied that a rich genetic diversity existed in the Hunan tea plant germplasm. Furthermore, the AMOVA in three groups categorized according to ADMIXTURE were performed, and the results showed that the majority of the variance (about 80.77 %), came from within group (Table 3), which further supported the idea that the genetic diversity contributed the most to the differentiation of Hunan tea plant resource than geographical factors.
Table 2. Matrix of pairwise Nei's genetic distance and Fst among the seven populations.
Population YN RC CB MS JH AN HJ YN 0.162 0.133 0.165 0.154 0.170 0.221 RC 0.035 0.076 0.102 0.083 0.088 0.145 CB 0.043 0.042 0.076 0.058 0.052 0.114 MS 0.051 0.043 0.031 0.070 0.128 0.185 JH 0.046 0.037 0.038 0.038 0.077 0.136 AN 0.046 0.038 0.035 0.044 0.038 0.078 HJ 0.046 0.052 0.044 0.059 0.053 0.035 Notes: Above diagonal Fst; below diagonal: Nei's genetic distance. Table 3. AMOVA of the whole population.
Source of variation Degree of freedom Sum of square Mean of square Components of covariance Sigma % Seven populationsaccessions Between population 6 17,773.89 2,962.31 147.64 18.62 Within population 103 66,455.06 645.19 645.19 81.38 Total 219 84,228.95 772.74 792.84 100.00 Three groups based on Mega and ADMIXTURE Between groups 2 11,758.90 5,879.45 161.28 19.23 Within groups 107 72,470.05 677.29 677.29 80.77 Total 109 84,228.95 772.74 838.57 100.00 Development of the core collection
-
A core collection containing 22 individuals from seven populations was constructed using the R package Corehunter (Table 4). In order to check if the core germplasm could effectively represent the genetic diversity of the whole tea germplasm, the genetic parameters of the core collection were estimated, and the results revealed that H, Ho, PIC, and MAF values of the developed core collection were consistent with the entire collection (Table 5). The results of AMOVA indicated that no significant difference was observed between the rest of the entire collection and the core germplasm set developed in the present work, and that 100.41% of the total variation was attributed to genetic differences within the collection, suggesting that the core germplasm set completely represented the whole germplasm (Table 6).
Table 4. The core collection.
Population Core collection YN YN2, YN9 RC RC11, RC14, RC16 CB CB1, CB6, CB8, CB9, CB11 MS MS4, MS5, MS14, MS17 JH JH9, JH16 AN AN1, AN2, AN5, AN11, AN12 HJ HJ1 Table 5. Genetic parameters of the core collection and the whole germplasm.
Germplasm H Ho PIC MAF Mean Range Mean Range Mean Range Mean Range Entire germplasm 0.22 0.06−0.50 0.21 0.13−0.31 0.19 0.05−0.38 0.14 0.03−0.50 Core germplasm set 0.21 0.00−0.50 0.20 0.11−0.28 0.18 0.00−0.38 0.13 0.00−0.50 Table 6. The AMOVA results among the core germplasm and non-core germplasm.
Source of variation Degree of freedom Sum of square Mean of square Components of covariance P-value Sigma % Between germplasm 1 660.86 660.86 −3.21 −0.42 0.85 Within germplasm 108 83,568.10 773.78 773.78 100.41 Total 110 84,228.95 772.74 770.57 100.00 -
Genomics research of tea plants has developed rapidly over the recent decade. Several reference genomes of tea plants, including 'Yunkang 10'[3], 'Shuchazao'[28], wild tea plant[29], 'Longjing 43'[30], 'Tieguanyin'[31], 'Biyun'[32] and 'Huangdan'[33], have been released. Recently, genetic diversity analysis of C. sinensis has been identified using genome sequencing technology[34−36]. In this study, the genetic diversity, population structure, population differentiation and core germplasm of Hunan tea plant resources have been evaluated using GBS.
Analysis of cross-validation errors demonstrated the lowest value was reached at K = 3, and PCA and phylogenetic tree analysis showed that seven geographical populations were clearly clustered into three groups. Based on the high quality SNPs, multiple analyses, including population structure analysis, PCA and phylogenetic analysis, it was confirmed that the YN population were clearly clustered to one single group, and most of accessions in An and HJ from the north of Hunan were assigned to one group, while the rest of accessions in RC, MS and JH from the south of Hunan were classified into one group. Therefore, the YN population could be separated from Hunan populations which verified that the SNPs data obtained by GBS were reliable and indicated that geographical barriers led to genetic differences between Hunan and YN populations. At the same time, three populations from southern Hunan and two populations from northern Hunan were divided into two groups, which was consistent with geographical distribution[37]. The analysis of the results of population structure, phylogenetic relationships, and PCA showed that the RC population was clustered into one subgroup, which is in agreement with morphological results[38] and RAPD molecular marker[14] analysis, which indicated that the RC population was derived from other tea plant populations in Hunan. Results of phylogenetic tree analysis showed that RC shared a nearer evolutionary relationship with MS, JH, CB, AN, or HJ than that of C. sinensis var. pubilimba in Yunnan[39]. However, accessions in CB were divided into two different subgroups, which indicated population differentiation occurred in the CB population[29]. Accessions in CB, MS, JH and other populations from Hunan contained more gene exchanges, which was also confirmed by the results of genetic structure analysis. The above results confirmed the reliability of phylogenetic evolutionary tree analysis, and they suggested that there were obvious gene flows between different cohabitation groups at the genomic level.
AMOVA results revealed that the population differentiation between the seven surveyed regions and three groups (Table 3) contributed only 18.62% and 19.23% of the total variances respectively, and the main genetic variation came from differentiation within populations, which was similar to that observed by Yao et al.[40]. Therefore, the AMOVA results indicated rich genetic diversity among Hunan tea germplasm within populations. These results could explain the NJ tree analysis, which showed that accessions from the same geographical region, such as GB, JH and AN populations, were not completely clustered into the same group in the NJ tree. The introduction of frequent tea plant breeding from different geographical regions, possibly promoted genetic material exchange, which led to a similar genetic background between different locations. The geographical locations have less effect on the genetic diversity, and revealed a lack of geographical differentiation, which were also found in crops of taro[41], potato[42]and sweet potato[43].
Furthermore, a core tea germplasm set, containing 22 tea accessions, was developed in this study, according to 311,044 genome-wide SNPs. The core collection preserved the genetic diversity of the whole resource population to the greatest extent with the least amount of genetic resources, as well as representing the genetic diversity and the geographical distribution of the whole resource population (Table 4), which should effectively improve the efficiency of germplasm exchange, utilization and germplasm resource nursery management. This work is the first report to construct the core tea germplasm in Hunan, which would help breeders to use the Hunan tea plant resource effectively and to reduce redundant breeding. Additionally, based on the core germplasm, we could remove genetically similar accessions and focus on important agronomic and quality traits in a relatively small number of tea plant germplasm that could be used as breeding materials.
This work was financially supported by The Central Government Guides Local Funds (2019XF5041), Hunan Agricultural Science and Technology Innovation Fund (2020CX035), the National Natural Science Foundation of China (32172629, U19A2030, 31670689), Provincial Natural Science Foundation of Hunan (2020JJ4358), and Hunan Provincial Seed Industry Innovation Project (2021NK1008).
-
The authors declare that they have no conflict of interest.
- Supplemental Table S1 Detail information of the 110 tea plant accesions collected in this study.
- Supplemental Table S2 Sequencing and identfied SNPs statistics of 110 tea plant accessions.
- Copyright: © 2023 by the author(s). Published by Maximum Academic Press, Fayetteville, GA. This article is an open access article distributed under Creative Commons Attribution License (CC BY 4.0), visit https://creativecommons.org/licenses/by/4.0/.
-
About this article
Cite this article
Huang F, Duan J, Lei Y, Liu Z, Kang Y, et al. 2022. Genetic diversity, population structure and core collection analysis of Hunan tea plant germplasm through genotyping-by-sequencing. Beverage Plant Research 2:5 doi: 10.48130/BPR-2022-0005 

Genetic diversity, population structure and core collection analysis of Hunan tea plant germplasm through genotyping-by-sequencing
- Received: 16 November 2021
- Accepted: 12 January 2022
- Published online: 03 March 2022
Abstract: Tea is considered to be a well-known and widely consumed beverage and Hunan province is rich in tea plant germplasm. In order to better conserve and utilize Hunan tea plant resources, 110 tea accessions from seven geographical origins were used to assess genetic diversity of Hunan tea plant germplasm through genotyping by sequencing (GBS) technology. As a result, a total of 311,044 high-quality single nucleotide polymorphism (SNP) markers were obtained. Population structure, phylogenetic relationships and principal component analysis (PCA) divided the entire accessions into three groups. The genetic diversity and population differentiation analysis showed that the mean observed heterozygosity (Ho) ranged from 0.16 to 0.24, while the mean polymorphic information content (PIC) ranged from 0.14 to 0.17, and mean minor allele frequency (MAF) ranged from 0.11 to 0.14. Analysis of molecular variance (AMOVA) indicated that 81.38% of the total variance was derived from within populations, which suggested a rich genetic diversity in Hunan tea germplasms. Furthermore, a core tea germplasm set was developed, which was comprised of 22 tea plant accessions and maintained the whole genetic diversity of the entire collection. This work should be valuable for conservation and utilization of tea germplasm in Hunan.
-
Key words:
- Camellia sinensis /
- Germplasm /
- Population structure /
- Genetic diversity /
- Core collection