


-
Indonesia currently ranks as the world's third-largest coffee producer, with Brazil and Vietnam in the first and second positions, respectively[1]. The country's most popular coffee beans are Arabica (Coffea arabica), Robusta (C. canephora), Liberica (C. liberica var. liberica), and Excelsa (C. liberica var. dewevrei). Arabica coffee is richer in flavor and aromatic variety than Robusta. Therefore, it is more favorable to coffee consumers[2]. Chemically, it contains bioactive compounds, such as chlorogenic acids, alkaloids, terpenoids, and Maillard reaction products. These components substantially affect coffee quality and provide health effects, such as antioxidant, antifibrotic, antidiabetic, neuroprotection, and anti-inflammation properties[3−6]. Liberica and Excelsa come from the same species but are considered different cultivars. These two cultivars of coffee have different characteristics, particularly in taste and the shape of coffee beans.
Today's coffee consumers consider not only the aroma, flavor, and taste of the coffee products but also the composition of coffee brews. Coffee brews contain bioactive compounds that provide health effects as mentioned above. However, many coffee shops add some ingredients to coffee brews, including sugar and milk, and their presence may affect the nutritional value. Excessive sugar intake is a major factor in obesity[7]. Meanwhile, some serious clinical diseases such as obesity, metabolic disorders, higher risk of cardiovascular disease and liver problems are contributed by high fat intake[8]. The presence of sugar and fat in coffee brews may also reduce the concentration of antioxidants, thereby lowering the detected antioxidant activity[9,10]. Therefore, there is a crucial need to conduct comprehensive studies regarding the concentration of bioactive compounds, sugars, and fats in coffee brews and their correlation to functional activities, such as antioxidant activities.
Additionally, sensory profiling is needed to describe the complete and detailed sensory profiles of coffee brews. The profiles can be used to compare sensory attributes between coffee samples with resembling characteristics. Sensory profiles can be generated using two approaches: product-based and consumer-based methods. The latter, known as check-all-that-apply (CATA) is considered more viable because it is simple and rapid. CATA enables researchers to collect scores for certain attributes according to consumer's perceptions. It collects data from a large number of consumers and then analyses them rapidly and simply[11].
The secondary metabolite content of coffee beans may vary greatly depending on internal factors, such as genetics, and external factors, such as geographical conditions. Geographical factors include growing regions that have differences in light intensity, temperature, and humidity. These conditions considerably alter plant metabolic activity and ultimately affect the variation of compounds in coffee beans[12]. Therefore, coffee brews prepared from different coffee origins may have different chemical compositions. Coffee brews' composition is also affected by their brewing methods. There are two brewing methods: manual and espresso. Manual brewing involves traditional, non-machine techniques, while espresso uses a specialized machine. Herawati et al.[2] reported three popular espresso-based brews: cappuccino, palm sugar milk coffee, and latte.
These espresso-based brews are prepared using different methods and compositions of ingredient combinations, such as bean origins, sugar, and milk, which significantly impact their bioactive compounds, bioactivities, nutritional contents, and sensory profiles. A previous study by Herawati et al.[2] reported that Arabica coffee was more popular for coffee drinkers in Indonesia. Arabica coffee beans from different regions within Indonesia may have varying chemical compositions, opening a great interest in the topic. Consequently, the objective of this research was to examine the bioactive compounds, sugar and fat composition, and sensory profiles of espresso-based coffee brews made from various Arabica bean origins, as well as the relationship between these compounds and antioxidant activity. The results of this experiment provide more scientific evidence of the quality assessment of espresso-based coffee.
-
All chemicals were analytical grade standard and were procured from Merck (Darmstadt, Germany). Ingredients for espresso-based coffee (water, pasteurized milk, sterilized milk, and palm sugar) were obtained from the local market.
Coffee sample preparation
-
Semi-washed Gayo Arabica beans and fully washed Toraja Arabica beans were collected from the same coffee farmers/processors as reported by Herawati et al.[2]. Meanwhile, Java Preanger Arabica beans (semi-washed) were collected from coffee farmers in Margamulya (located in Pengalengan, Regency of Bandung, Province of West Java, Indonesia). Those Arabica coffee samples from three origins generally came from the same cultivar (Typica), but the cultivar was developed into different clones. Gayo Arabica beans were from G3 and P88 clones. Toraja Arabica beans were from Lini S clones, and Java Preanger beans were from P88 and Lini S clones. The Arabica beans used in this study were commercially available coffee beans in each region. Each green bean (1,000 g) was roasted in a roaster (IKRI, Jember, Indonesia) at 200–208 °C for 9–10 min (medium to dark roasted with lightness level (L*) 26–27). The lightness level was assessed using a chromameter (Minolta CR-400, Japan). The roasted Arabica beans were packaged in one-way valve bags for preparing espresso-based coffee brews.
Espresso brewing preparation
-
The roasted beans were ground in a grinder (HeyCafe H1, China) with a 2.0 size setting (fine grind) to produce ground coffee. The ground coffee (18 g) was mechanically tamped in a portafilter and then placed in the group head of the espresso machine (Rancilio-Silvia PRO, Italy). It was then pressed to produce two cups of espresso (18 mL each; total 36 mL (1:2)).
Cappuccino brewing preparation
-
Two cups of espresso were added with steamed pasteurized fresh milk (150 g). The pasteurized fresh milk was steamed in a jug for 15 s using the espresso machine (as mentioned above) until foam occurred at the top layer. The steamed milk was poured into a cup of espresso prepared previously.
Palm sugar milk coffee brewing preparation
-
An espresso (18 mL) was transferred to a cup containing 15 g of liquid palm sugar. Then, liquid full cream milk (100 g) was poured into the cup.
Caffe latte brewing preparation
-
An espresso (18 mL) obtained from the espresso machine (mentioned above) was transferred to a 220 mL cup. Then, 160 g of liquid pasteurized fresh milk previously steamed for 15 s was added.
Caffeoylquinic acids quantification
-
The CQAs (Caffeoylquinic acids) quantification was conducted using a former method reported by Herawati et al.[13] with modifications. Modifications were conducted for samples with milk addition. An additional step was required to separate protein and fat from the coffee brew samples, as described by Quan et al.[14]. The sample (5 mL) was added with 5 mL of 1% acetic acid (v/v) in 80% methanol (v/v). It was then sonicated using a sonicator for 20 min and then centrifuged at 10,000 × rpm for 10 min at a temperature of 4 °C. Afterward, the centrifuged coffee brew was filtered using a 0.45 μm PTFE membrane (Sigma-Aldrich, Darmstadt, Germany) and was prepared for HPLC injection in triplicate. The concentration of CQAs was reported as mg/100 mL.
Caffeine, trigonelline, and theobromine quantification
-
The samples were prepared following the method reported by Quan et al.[14] as mentioned above. Then, the samples were filtered through a 0.45 μm PTFE membrane (Sigma-Aldrich, Darmstadt, Germany) and finally injected in triplicate into the HPLC instrument. The HPLC analysis followed the procedure developed by Caprioli et al.[15], with instrumentation and operating conditions based on those reported by Herawati et al.[13]. Quantification of caffeine, trigonelline, and theobromine contents was presented in mg/100 mL.
DPPH antioxidant activity measurement
-
The 2.2-diphenyl-1-picrylhydrazyl (DPPH) assay was used to examine antioxidant activities using a procedure reported by Vignoli et al.[16] with some modifications. The coffee brew was diluted once, and the diluted sample (10 μL) was mixed with 0.5 mL of DPPH reagent, ethanol (250 μM), 1 mL of acetate buffer (100 mM; pH 5.5), and 1 mL of ethanol. Absorbance was measured at λ = 517 nm using a spectrophotometer (Shimadzu Corp, UV–Vis 2450, Japan). Antioxidant activity was tested in quadruplicate and expressed in mg antioxidant capacity equivalent to Trolox (TEAC)/100 mL. Antioxidant capacity was calculated using a Trolox standard curve (Sigma-Aldrich, USA) with concentrations ranging from 0.1 to 1 mg/mL (in triplicate).
FRAP antioxidant activity measurement
-
The ferric-reducing antioxidant power (FRAP) was measured using a method prescribed by Vignoli et al.[16] with some modifications. The reagent was a mixture containing 2.5 mL of 2,4,6-tris(2-pyridyl)-s-triazine (TPTZ) solution (10 mM) in HCl (40 mM), 2.5 mL of 20 Mm FeCl3·6H2O (Sigma-Aldrich, USA), and 25 mL of acetate buffer (0.3 mM; pH 3.6). The mixture was incubated for 30 min at 37 °C. Then, 900 μL of FRAP reagent was mixed with 90 μL of distillate. A 10 μL sample or standard solution was added to the mixture and then incubated for 30 min at 37 °C. The absorbance was checked at a wavelength of 595 nm using a spectrophotometer (Shimadzu Corp, UV–Vis 2450, Japan). The measurement was calculated using a five-point curve standard of Trolox (Sigma-Aldrich, USA) with a concentration of 0.2–0.6 mg/mL (triplicates). The FRAP antioxidant test was performed in quadruplicate. FRAP assay was expressed in mg TEAC/100 mL.
Sugar quantification
-
Sugar content was analyzed using Luff Schoorl[17]. Then, 25 mL of sample solution was pipetted to a 250-mL Erlenmeyer and added with 25 mL of Luff Schoorl. The solution was added with boiling stones and heated for 10 min on a hot plate, where it was coupled to reflux. Immediately, it was then cooled, added with 10 mL of 20% KI, and gradually added with 25 mL of 3 M sulfuric acid (H2SO4) through the flask wall. The solution was titrated with 0.1 N sodium thiosulfate until the color turned pale yellow. A 0.5% starch indicator was added to change the color to blue and then titrated with 0.1 N sodium thiosulfate until the blue color disappeared. Total sugar was presented in g/100 mL.
Fat quantification
-
Fat content analysis was conducted using the Soxhlet method[18]. First, the sample was hydrolyzed with 25% HCl, dried, and then extracted. The sample (1–2 g) was placed inside a filter paper with a funnel-like shape. It was then closed with fat-free cotton. The filter paper containing the sample was dried in an oven at < 80 °C for 3 h and placed in a sample flask. The flask had been previously heated in an oven at 105 °C for 15 min, desiccated, and weighed. The flask containing the sample and hexane was set on the Soxhlet apparatus. The sample was extracted by refluxing for 6 h. The remaining solvent was heated in an oven at 105 °C for 2 h until constant weight was achieved. It was then cooled in a desiccator and weighed. The fat content was presented in g/100 mL.
Sensory profiling
-
The sensory analysis procedure complied with the ethical clearance (No. 1041/IT3. KEPMSM-IPB/SK/2023). All coffee samples were evaluated using a CATA questionnaire. In total, there were 30 consumers and coffee drinkers voluntarily participating in this study. All panelists completed a consent form. In the test, they were served samples periodically. Before the panelists tasted the samples, they described the ideal attributes of coffee brews and described them in an evaluation form. The form presented 21 sensory attributes: aroma (roasted, burned, dry, ashy, smoky, floral, fruity, sweet, and peppery), taste (bitter, sweet, umami, and sour), mouthfeel (viscosity, creamy, plain, watery, and dry), and aftertaste (bitter, astringent, and dry). All of these attributes were discussed by 10 coffee drinkers in a focused group discussion session. The evaluation was held in the Southeast Asia Food and Agricultural Science and Technology Center at IPB University in a properly lighted room (at a temperature of 20 °C).
Statistical analysis
-
The treatment combination was 3 (beans origin) × 4 (brewing method) = 12, with three replications, resulting in 36 experimental units. A factorial completely randomized design was arranged, consisting of two factors (bean origin and brewing method). Data were then analyzed using a generalized linear model followed by a Duncan test in SPSS version 22.0 (IBM, USA). A correlation test between bioactive compounds, sugar, and fat content with antioxidant activity was performed using the Pearson correlation test in the same software. Meanwhile, sensory profile data analysis was conducted using principal component analysis (PCA) with the CATA method in XLSTAT Annual Version 2024.2.21422 (Lumivero, Denver, USA).
-
The bioactive compounds and antioxidant profiles of espresso-based coffee brews prepared from different Arabica bean origins are presented in Table 1. The experimental results proved that the interaction of the two factors studied, namely, coffee bean origin and brewing methods, did not affect the caffeoylquinic acid content (CQAs) (p ≥ 0.05) (Table 1 & Supplementary Table S1). However, the brewing methods showed significant effects on the concentrations of 5-CQA, 4-CQA, 3-CQA, and 3-diCQA (p < 0.05) (Table 1; Supplementary Tables S2−S5). Espresso brews showed the highest CQA level (564.8 mg/100 mL). On the contrary, latte brews had the lowest (17.8 mg/100 mL). Considering alkaloid (trigonelline, theobromine, and caffeine) content, the interaction of both factors exhibited a significant effect (p < 0.05) (Table 1; Supplementary Tables S6−S9). Espresso brews made from Arabica Gayo coffee beans had the highest total alkaloid level (815.1 mg/100 mL), and the lowest was attributed to latte brews made from Arabica Toraja coffee beans (70.5 mg/100 mL).
Table 1. Bioactive compounds and antioxidant activity of espresso-based Arabica coffee brews.
Bean origins Brews Caffeoylquinic acid content (mg/100 mL) Alkaloids content (mg/100 mL) Antioxidant activity
(mg TEAC/100 mL)3-CQA 4-CQA 5-CQA 3.5-diCQA Trigonelline Theobromine Caffeine DPPH FRAP Java Preanger Espresso 107.2 ± 1.5a.C 135 ± 4.4a.C 313 ± 8.3a.C 8.2 ± 0.7a.C 284.1 ± 3.8a.B 57.7 ± 2.1b.C 393.3 ± 7.1a.D 909.5 ± 77.1c.D 2273.1 ± 123.5c.D Java Preanger Palm sugar milk coffee 12.3 ± 1a.B 14.9 ± 1.5a.B 35.1 ± 2.1a.AB 2 ± 0.1a.B 57.2 ± 1a.A 9.8 ± 0.1b.B 103.3 ± 4.5a.C 150.4 ± 14.89c.A 712.8 ± 58.1c.B Java Preanger Cappuccino 9 ± 0.5a.B 12 ± 0.6a.B 27.2 ± 1.2a.B 1.6 ± 0.1a.B 43.5 ± 4.4a.A 7 ± 0.7b.B 78.4 ± 3.5a.B 730.8 ± 66.2c.C 661.5 ± 43.4c.C Java Preanger Latte 5.1 ± 0.3a.A 5.9 ± 0.4a.A 14.7 ± 0.3a.A 1 ± 0.1a.A 26.3 ± 1.5a.A 2.3 ± 0.4b.A 43.2 ± 1.7a.A 578.9 ± 53.7c.B 390.2 ± 26.8c.A Gayo Espresso 103.5 ± 1.4a.C 128.9 ± 1.9a.C 283.3 ± 3.4a.C 12.6 ± 0.5a.C 311.3 ± 7.7b.B 14.5 ± 0.8a.C 489.3 ± 5b.D 607.2 ± 55.4b.D 2155.4 ± 103.7b.D Gayo Palm sugar milk coffee 8.7 ± 0.5a.B 10.5 ± 0.6a.B 24.2 ± 2.1a.AB 1.7 ± 0.1a.B 68.6 ± 4.9b.A 0.3 ± 0a.B 105 ± 4.2b.C 96.2 ± 8.8b.A 616.4 ± 21.6b.B Gayo Cappuccino 11.8 ± 1a.B 14.8 ± 0.9a.B 33.9 ± 2.6a.B 2.1 ± 0a.B 47.1 ± 1.3b.A 5.6 ± 0.4a.B 75.2 ± 2.3b.B 411.8 ± 38.4b.C 590.3 ± 55.7b.C Gayo Latte 2.9 ± 0.2a.A 3.2 ± 0.2a.A 28.8 ± 0.7a.A 0.8 ± 0a.A 26.1 ± 1.7b.A 2.2 ± 0.1a.A 45.7 ± 2.6b.A 557.7 ± 47.7b.B 394.2 ± 22.4b.A Toraja Espresso 121.2 ± 3.8a.C 143.3 ± 3.9a.C 293.8 ± 7.1a.C 6.5 ± 0a.C 290.4 ± 1.6a.B 7.7 ± 0.8a.C 434.7 ± 9.2a.D 508.3 ± 49.5a.D 2019.7 ± 201.1a.D Toraja Palm sugar milk coffee 8.9 ± 0.7a.B 11.4 ± 0.5a.B 26.9 ± 2.4a.AB 1.6 ± 0.1a.B 69.6 ± 3.9a.A 10.1 ± 0.6a.B 102.2 ± 5.2a.C 122.3 ± 9.3a.A 452.6 ± 4a.B Toraja Cappuccino 9.2 ± 0.6a.B 11.3 ± 0.3a.B 25.6 ± 0.6a.B 1.6 ± 0a.B 52.1 ± 2.3a.A 8.2 ± 0.1a.B 77.7 ± 6.3a.B 437.3 ± 168.5a.C 590 ± 39.7a.C Toraja Latte 2.8 ± 0.1a.A 3.8 ± 0.1a.A 10.4 ± 0.1a.A 0.8 ± 0a.A 27.3 ± 2.5a.A 3.2 ± 0.2a.A 40 ± 2.6a.A 102.5 ± 9a.B 394.3 ± 29.3a.A The values for caffeoylquinic acids and alkaloids were expressed as the average and standard deviation based on three data points. The values for antioxidant activities were expressed as the average and standard deviation based on four data points. Small case letters (a−c) represent the significant effect of bean origin on observed parameters (p < 0.05). Capital letters (A−D) represent the significant effect of brewing methods on observed parameters (p < 0.05). Espresso-based coffee brews with a dissimilar quantity of bioactive compounds resulted in differences in antioxidant activity. In this work, as presented in Table 1, the interaction of both factors showed significant effects on antioxidant activity, tested by DPPH and FRAP (p < 0.05) (Table 1; Supplementary Tables S10−S12). The highest antioxidant activity (both DPPH and FRAP assays) was attributed to Java Preanger espresso, reaching up to 909.5 and 2,279.1 mg TEAC/100 mL, respectively. Although palm sugar milk coffee brews made from Gayo had the lowest antioxidant activity based on the DPPH assay (96.2 mg TEAC/100 mL), latte brews made from Arabica Java Preanger showed the lowest based on the FRAP method (390.2 mg TEAC/100 mL).
Further works reveal a positive correlation between the bioactive components and antioxidant activity of Arabica espresso coffee drinks (Table 2). If the value is close to +1 or −1, it indicates a strong linear correlation, either positive or negative[19]. Bivariate correlation analysis presents the correlation between caffeoylquinic acids and antioxidant activity by DPPH and FRAP, with 0.543 and 0.991 each. The correlation between alkaloid and antioxidant activity reached 0.482 (DPPH) and 0.989 (FRAP). Positive values indicate a positive correlation. This conformed to the results of Jeszka-Skowron et al.[20], explaining that bioactive compounds, e.g., caffeoylquinic acids and alkaloids, became the major contributor to antioxidant activity in coffee brews, as revealed by a positive correlation coefficient.
Table 2. Correlation between caffeoylquinic acids and alkaloids with antioxidant activity of coffee brews.
Bioactive components Correlation coefficient value DPPH FRAP CQAs 0.543 0.991 Alkaloids 0.482 0.989 Correlation coefficient values (+1 or −1) indicate strong correlations. Correlation coefficient values (0) indicate weak correlations. Sugar and fat contents were determined only in Arabica Gayo coffee (Table 3) as the bean is widely used in large amounts. The idea is indicated by the total production of Arabica Gayo reaching 67.668 tons in 2023[21], which may relate to high consumption. This present work found that brewing methods significantly affected the sugar and fat contents in espresso-based brews (p < 0.05). Palm sugar milk coffee brews had the highest sugar and fat contents (7.43 ± 0.18 and 3.84 g/100 mL each), and the lowest was attributed to espresso brewing, reaching up to nondetection and 0.60 g/100 mL. The addition of palm sugar contributes to the high sugar level in palm sugar milk coffee brewing. Chemically, palm sugar contains sucrose, 89.94%; glucose, 3.61%; and fructose, 3.50%[22]. Regarding fat content, its quantity in the product depends on the amount of milk added. In milk, fat content reaches 3.25 g/100 mL, and it has a pivotal role in affecting the taste and texture of coffee brews[8].
Table 3. Sugar and fat contents in espresso-based coffee brews.
Bean Brews Sugar (g/100 mL) Fat (g/100 mL) Gayo Espresso n.d. 0.60 ± 0.03A Gayo Palm sugar milk coffee 7.43±0.18C 2.40 ± 0.28.B Gayo Cappuccino 2.04±0.11B 2.62 ± 0.34B Gayo Latte 2.24±0.10B 2.71 ± 0.09.B The values for sugar and fat content were expressed as the average and standard deviation based on three data points. Capital letters (A–C) indicate significant (p < 0.05) differences with different brewing methods. n.d. = not detected. Further works reveal a negative correlation between sugar and fat contents with the antioxidant activity of Arabica espresso-based brews (Table 4). In this work, bivariate correlation analysis presents the correlation between sugars and antioxidant activity by DPPH and FRAP, with (−0.957) and (−0.558), respectively. The correlation between fat content and antioxidant activity reached (−0.433) DPPH and (−0.997) FRAP. Negative values indicate a negative correlation, and the correlation between the sugar, fat contents, and the antioxidant activity of coffee brews suggests that an increase in sugar or fat content decreases the overall antioxidant activity.
Table 4. Correlation between sugar and fat contents with antioxidant activity of coffee brews.
Nutritional components Correlation coefficient value DPPH FRAP Sugars −0.957 −0.558 Fat content −0.433 −0.997 Correlation coefficient values (1 or −1) indicate strong correlations. Correlation coefficient values (0) indicate weak correlations. Sensory profile of espresso-based Arabica coffee brews
-
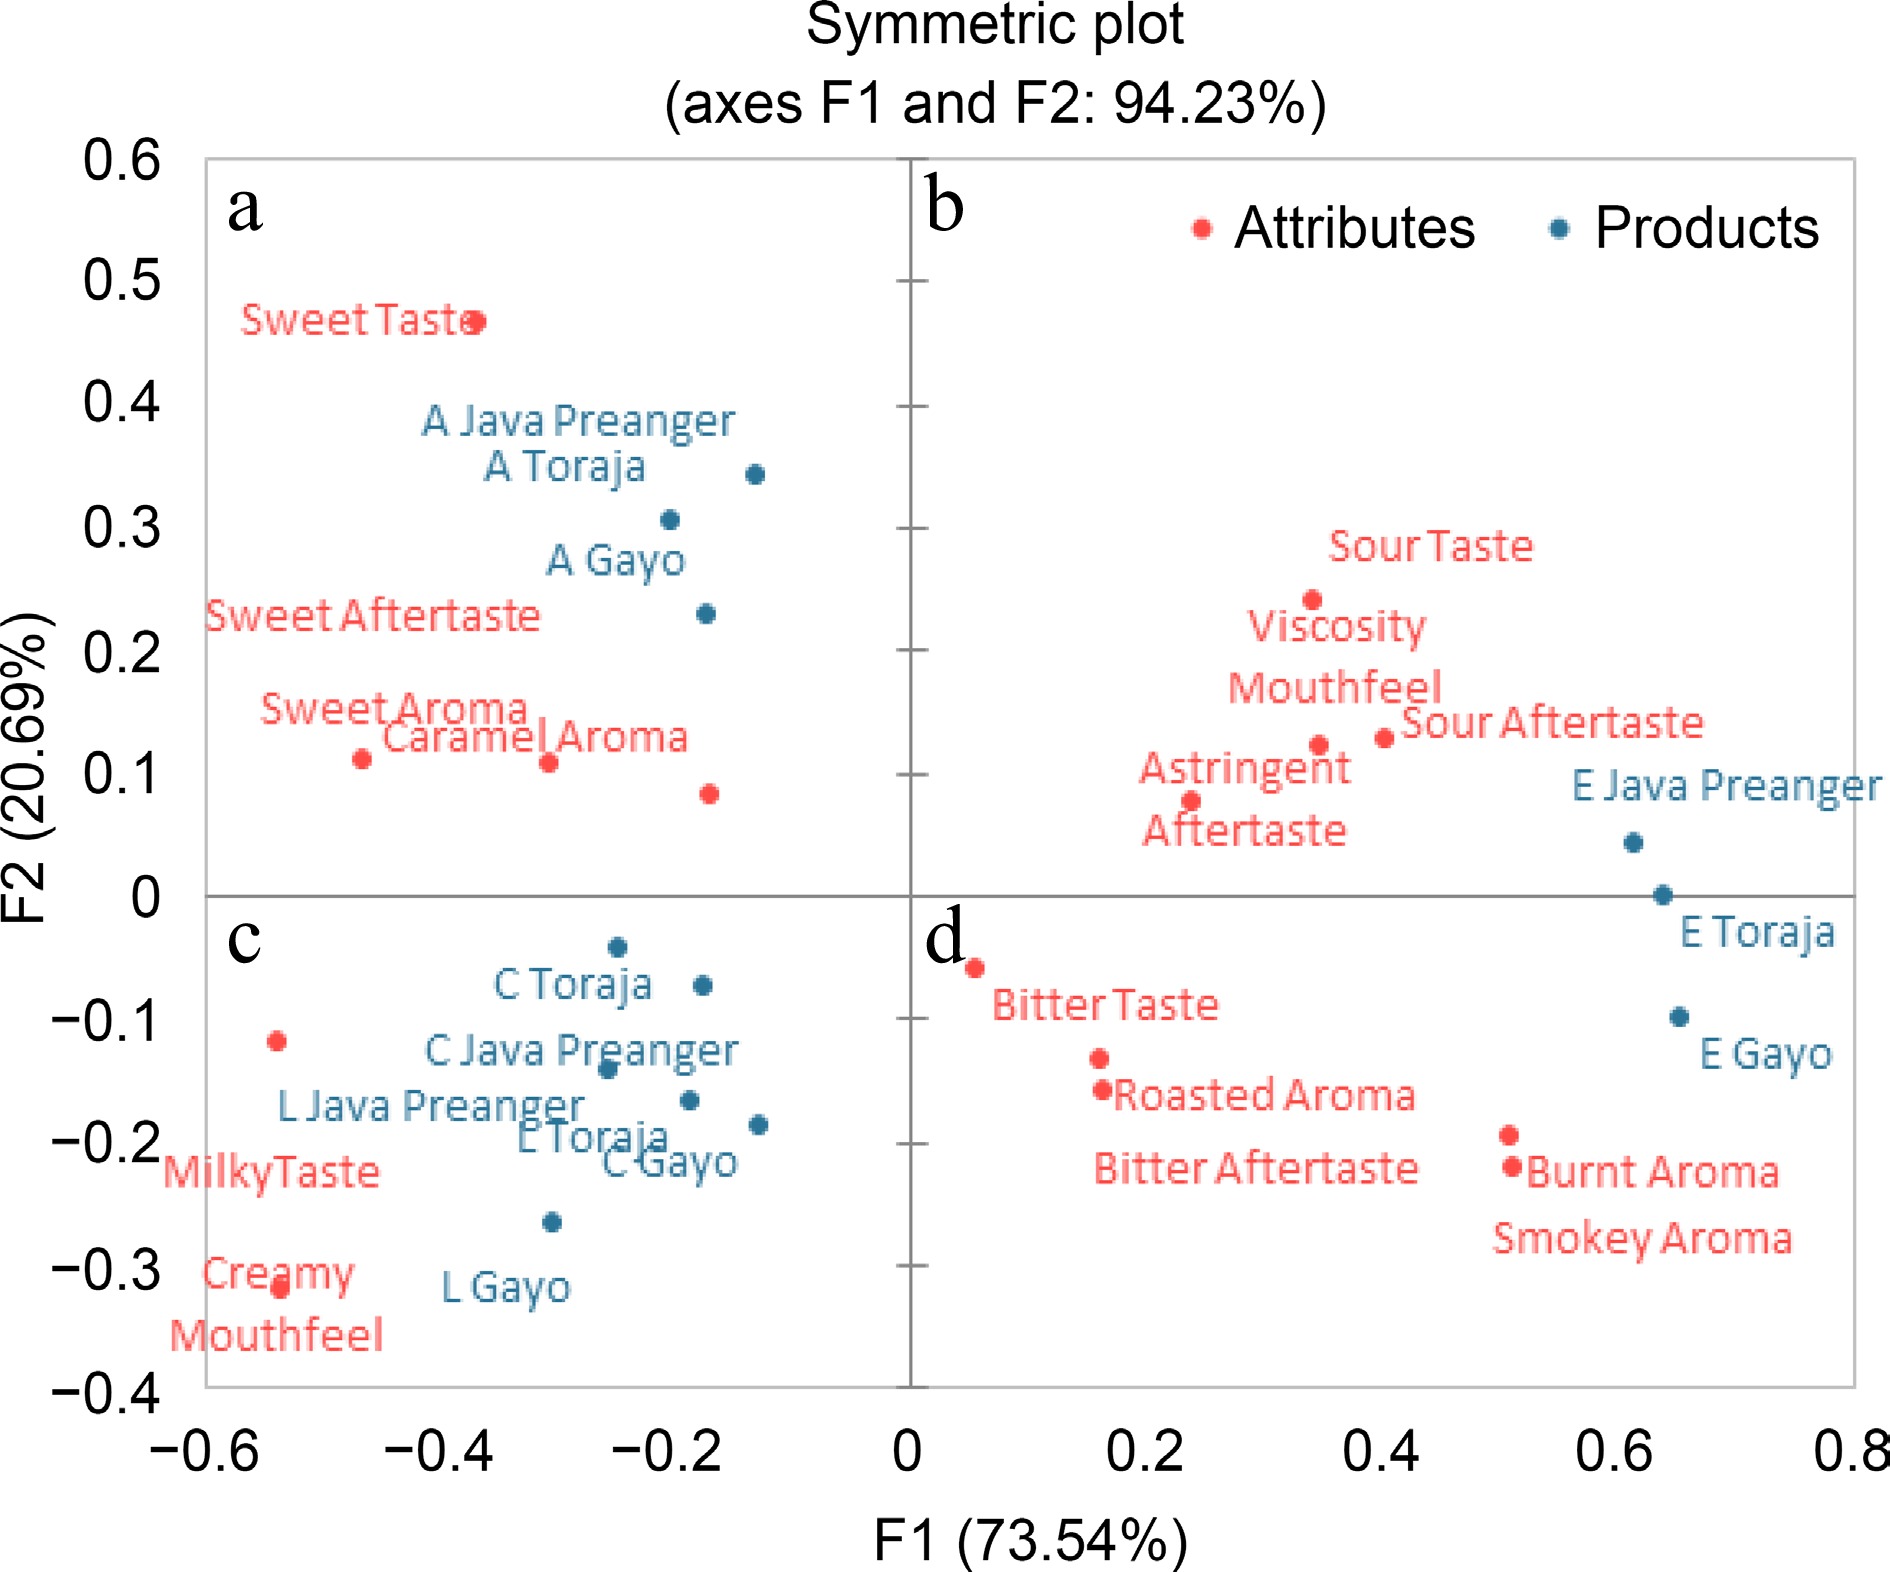
Espresso-based coffee brews with different bean origins and brewing methods are separated into four quadrants and positioned in different locations (Fig. 1). Palm sugar milk coffee is in quadrant a and indicates a sweet taste, sweet aftertaste, sweet aroma, and caramel aroma. The cappuccino and latte are located in quadrant c, which indicates a milky taste and creamy mouthfeel.
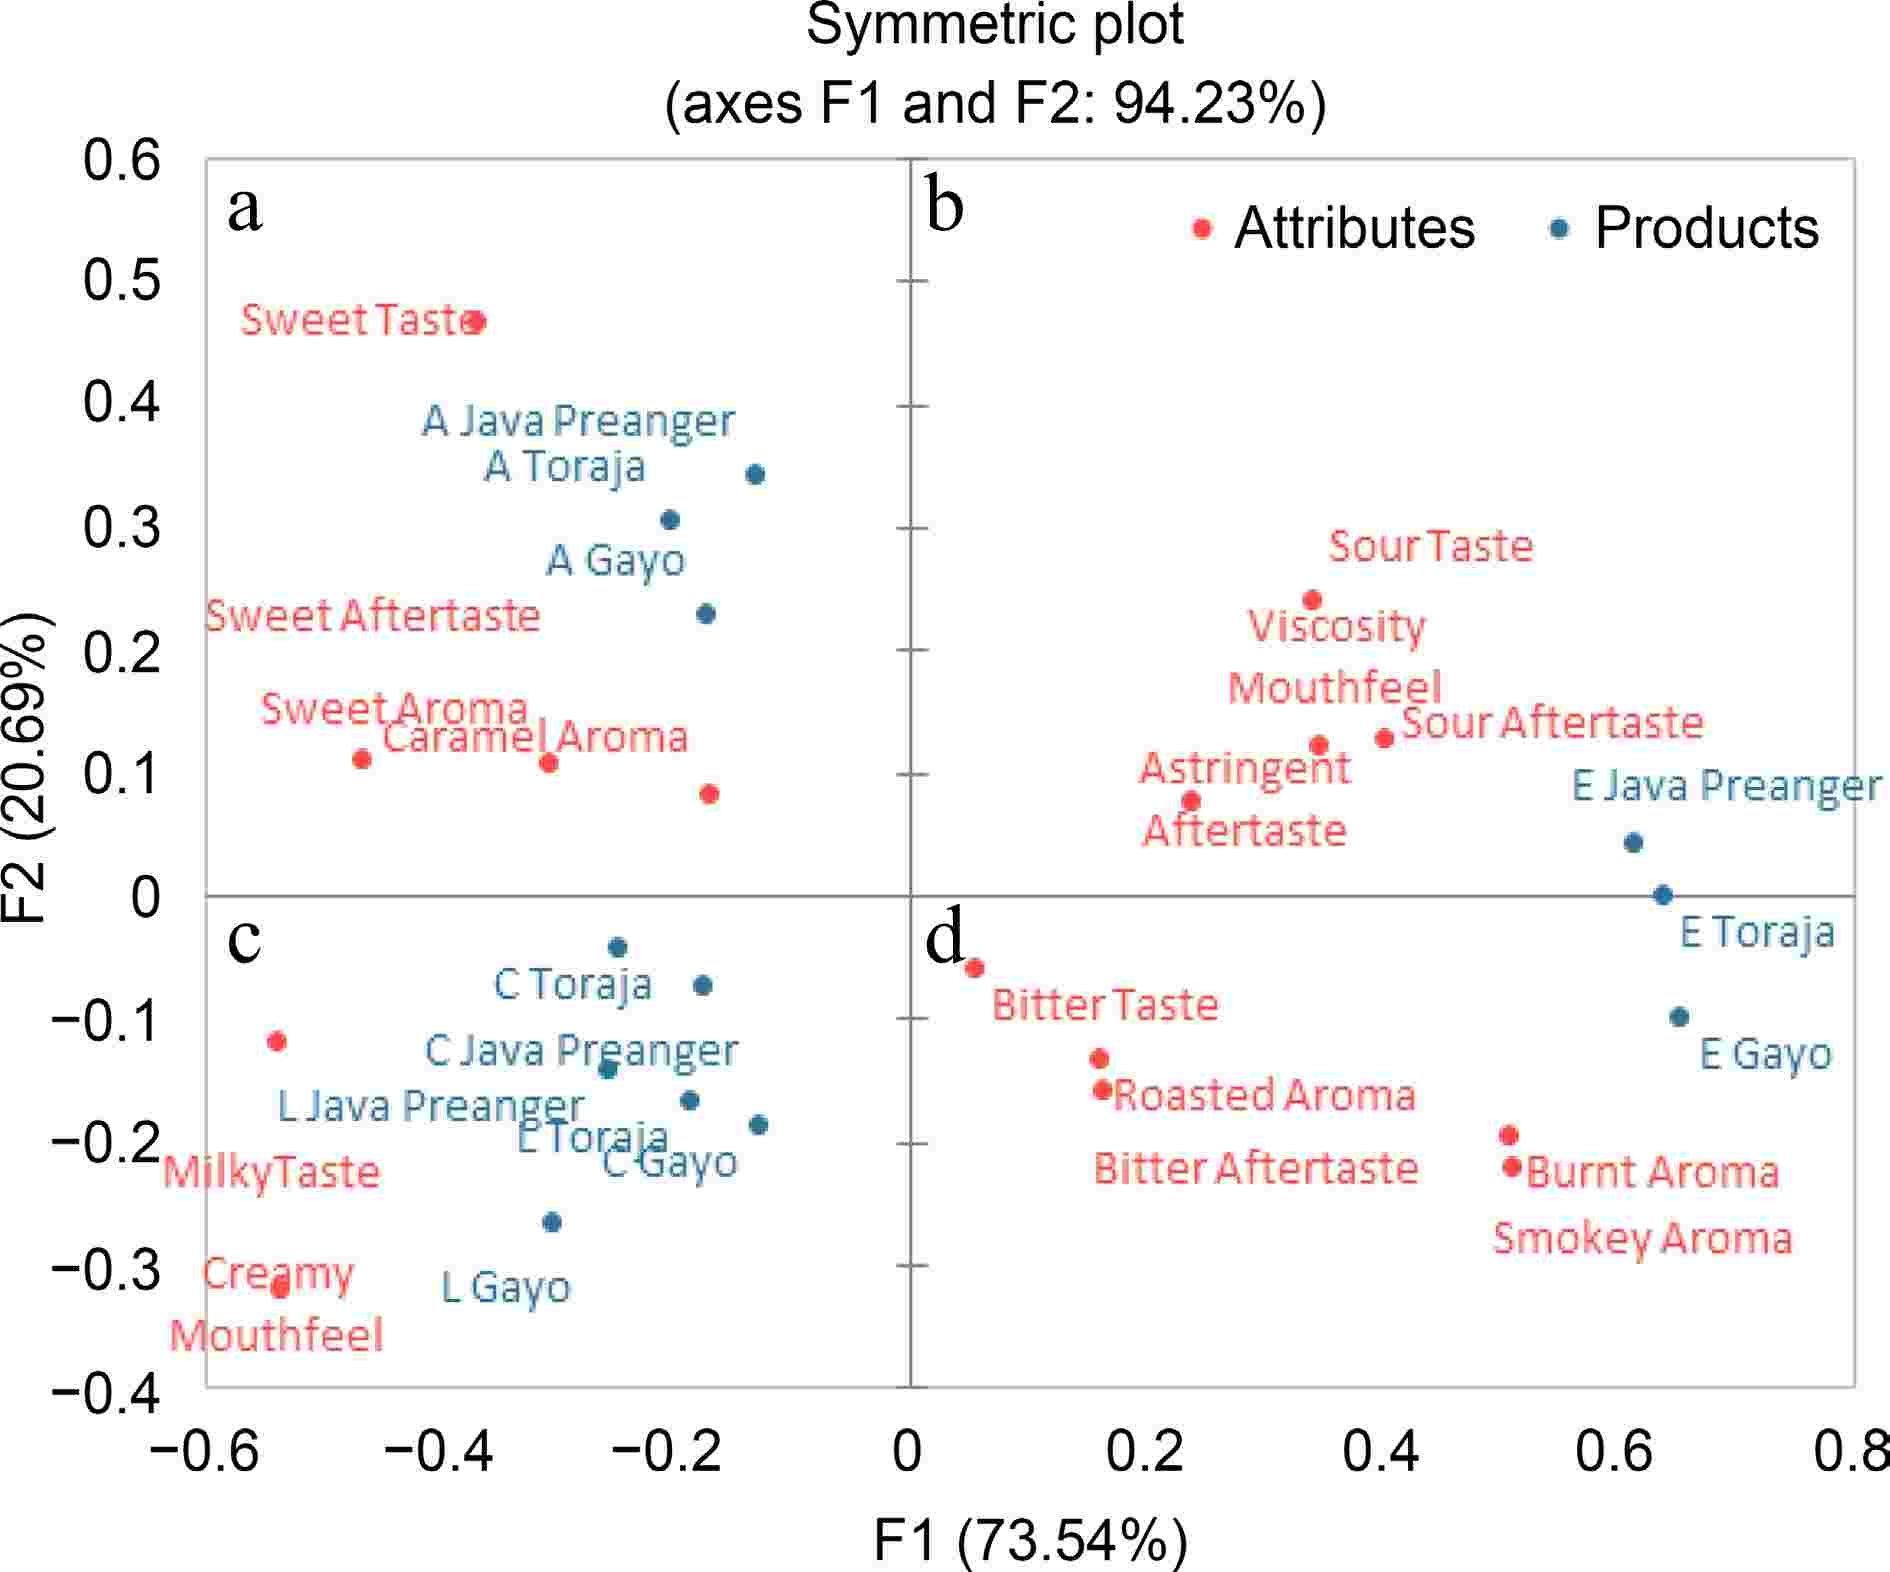
Figure 1.
PCA biplot of check-all-that-apply (CATA) of espresso-based Arabica coffee brews. This figure is a result of a CATA analysis involving 30 consumers. Coffee brews were prepared using three espresso-based brewing methods. (E) espresso, (C) cappuccino, (L) latte, and (A) palm sugar milk coffee.
Espresso coffee samples are sitting in different quadrants (b and d) depending on the bean origins. Java Preanger espresso, sitting in quadrant b, indicates a sour taste, sour aftertaste, viscosity mouthfeel, and astringent aftertaste. Gayo espresso in quadrant d indicates a bitter taste, bitter aftertaste, roasted aroma, burnt aroma, and smokey aroma. Toraja espresso is in the middle position between Java Preanger and Gayo espresso. The coffee brew has a bitter taste due to the concentration of caffeine and other soluble compounds. A similar result was also found by Batali et al.[23], who reported that a large number of identified bitter compounds in coffee brews include caffeine, chlorogenic acid lactones, and trigonelline.
-
The high CQA and alkaloid contents in espresso brews are understandable because no other ingredients are added[24]. Conversely, the proportion of bioactive compounds in latte, cappuccino, and palm sugar milk coffee brews is lower because extra ingredients are added to their formula, decreasing the ratio of bioactive compounds and total volume. This is in agreement with the study reported by Liao et al.[25]. They found that a combination of coffee bean origin and brewing methods exhibited different impacts on the bioactivity of coffee brews. It is noteworthy that the antioxidant activity of coffee drinks provides health advantages for their drinkers[3,4,6,26]. Conversely, the addition of milk into espresso coffee products decreases their bioactivity because milk protein may bind with polyphenols (i.e. CQAs) in coffee, weakening the coffee's role as a source of bioactive compounds[10].
As natural bioactive compounds, CQAs offer a wide range of therapeutic benefits, associated with chronic metabolic diseases and age-related conditions[27]. Its multifunctional properties include neuroprotection against neurodegenerative diseases and diabetic peripheral neuropathy, as well as antioxidants[28]. CQAs also contribute to preventing cardiovascular diseases, skin disorders, diabetes, and liver and kidney damage, and exhibit anti-tumor activity. Mechanistically, its integrative functions act through the modulation of oxidative stress and metabolic homeostasis[29]. CQAs enhance the body's primary antioxidant defenses by activating the Nrf2 pathway, effectively neutralizing excess cellular free radicals[30]. Additionally, it activates the AMPK pathway to maintain and restore glucose and lipid metabolic homeostasis. Furthermore, CQAs exhibit neuromodulatory effects by interacting with neuroreceptors and ion channels[31]. Based on the samples used, this study indicates that espresso coffee has a significantly higher potential as an antioxidant compared to other coffee brews. By recognizing the potential antioxidants of coffee brews, coffee drinkers unknowingly may enhance their bodies' health benefits.
This study also highlights the contribution of various espresso-based coffee brews to bioactive compounds and daily sugar intake. A cup of coffee brew has different levels of bioactive compounds and sugar, depending on its brewing methods. A cup of espresso (18 mL), a cup of palm sugar milk coffee (150 mL), a cup of cappuccino (220 mL), and a cup of latte (220 mL) contain various amounts of CQAs, namely, 120–134, 213–261, 270–293, and 154–157 mg, respectively. In terms of alkaloids, this study mainly considers caffeine. The samples studied were found to have 71–88, 153–157, 165–172, and 80–101 mg caffeine, respectively. Although caffeine is reported to exert advantages, excessive intake causes detrimental effects on health. Therefore, the intake limit needs to be considered, that is, ≤ 400 mg per day[32]. Another essential finding is the fact that espresso may not contribute to daily sugar intake. Based on the caffeine content, this work indicates the following maximum consumption of Arabica espresso-based coffee per day: four cups for espresso, two cups for palm sugar milk coffee, two cups for cappuccino, and four cups for latte. Coffee drinkers need to cogitate on their daily intake of coffee, and more importantly, they must consider the supply of sugars and caffeine from other food sources.
Exceeding caffeine intake or suddenly stopping its use can lead to various adverse effects, including anxiety, insomnia, hallucinations, hypertension, headaches, gastrointestinal and sleep disturbances, diuresis, dehydration, tremors, palpitations, and cardiac arrhythmias due to the stimulant effects of caffeine[33]. High levels of consumption can overwhelm the body's metabolization of caffeine[34]. After being ingested, caffeine is rapidly and almost completely absorbed into the bloodstream, demonstrating 100% bioavailability due to its high solubility in water and organic solvents. About 80% of caffeine absorption occurs in the gastrointestinal tract, while the remaining 20% is absorbed in the stomach. The oral mucosa, the membrane lining the mouth, also contributes to caffeine absorption[35]. Unlike many substances, which undergo significant metabolism in the liver before entering the bloodstream, caffeine experiences minimal hepatic-first-pass metabolism (the process that often reduces the bioavailability of orally administered compounds) his limited fist-pass effect explains caffeine's rapid absorption[35]. Additionally, caffeine absorption is not influenced by age, gender, or health status. It also follows linear pharmacokinetics, meaning that an increase in intake leads to a proportional rise in plasma caffeine levels[36].
This work revealed that the chemical components in coffee (i.e., caffeoylquinic acids (CQAs) and alkaloids) had a stronger correlation with FRAP antioxidant activity than DPPH antioxidant activity. The result raises an intriguing question. To explain this, the antioxidant assay has a different mode of action. Although FRAP measures the ability of total compounds to reduce ferric ions, DPPH measures the ability of specific compounds to neutralize free radicals, which means that the FRAP test is more sensitive than DPPH[37]. Other possible causes include the differences in bioactive properties, assay mechanism, sensitivity, and accuracy of the procedures[37]. There are more interesting results in this study, including the CQAs and DPPH levels between samples added with milk and those added with both milk and palm sugar (Table 1). This clearly explains a weak correlation between CQAs and DPPH. Although CQAs are more abundant in palm sugar milk coffee than in cappuccino, the DPPH antioxidant activity of the palm sugar milk coffee was lower than that in cappuccino. This happens because palm sugar, as a sweetener, is added to the sample. The sugar contains not only sucrose but also other compounds that can suppress the ability of CQAs to scavenge free radicals, leading to a drop in antioxidant activity[10,20].
The addition of sugar or palm sugar can dilute the concentration of antioxidants, thereby lowering the detected antioxidant activity in coffee brews[10,20]. Furthermore, this work revealed that the nutritional components in coffee (i.e., sugar) had a higher negative effect on DPPH antioxidant activity than FRAP antioxidant activity (Table 4). This is likely due to the effect of sucrose on the extraction of phenolic compounds and their chemical structure. A similar result was also found by Shalaby et al.[9], who reported that the addition of milk and sugar to coffee brews significantly decreased its free radical scavenging activity on DPPH. This phenomenon may be due to the condensation reaction between the hydroxyl groups of phenolic compounds in coffee brews and the hydroxyl groups of sucrose. The interaction between phenolic compounds and sweeteners plays an essential role in this change, which can affect the effectiveness of the coffee brew as a free radical scavenger.
In the human body, the DPPH method evaluates a compound's ability to neutralize oxidative damage by scavenging free radicals. On the other hand, the FRAP method assesses a compound's capacity to maintain the balance between oxidation and reduction reactions[38]. Regarding metabolism and digestion, antioxidants measured using the DPPH method can help prevent oxidative stress during the metabolic processes, such as when coffee brews are broken down into absorbable nutrients[39]. Meanwhile, the FRAP method assesses how antioxidants may protect the body from oxidative damage linked to these metabolic activities. Both methods highlight the importance of antioxidant intake through coffee brews to support long-term health and reduce the risk of diseases caused by oxidative stress[40,41].
A high-fat content can decrease the relative concentration of antioxidants in coffee brews, thereby lowering the detected antioxidant activity[10]. A similar result was also found by Tavakoli et al.[42], who reported that the addition of fat, semi-fat, and full fat to probiotic yogurt reduced the antioxidant activity measured using the DPPH method. However, the mechanism of the fat-reducing antioxidant activity requires further investigation. This study showed that fat content had a higher negative effect on FRAP antioxidant activity than DPPH antioxidant activity. A different result was also found by Al-Ghafari et al.[10], who reported that adding any type of milk (whole, semi-skimmed, and skimmed) significantly reduced the metal-chelating and metal-reducing power activities of coffee brews compared with the coffee alone (no milk added). In general, many studies reported that milk might either enhance the scavenging of DPPH or decrease the chelating and metal-reducing activity of polyphenols. However, more investigations are required to evaluate the mechanisms by which fats in milk can alter the antioxidant properties of coffee. In future studies, more investigated correlations between fat content and antioxidant activity are needed to obtain a more comprehensive and objective result of the correlation between the fat content and antioxidant activity of coffee brews.
Espresso-based coffee brews which are made from different formulations not only have different bioactive compounds and antioxidant activity but also have different sensory profiles. The profile of cappuccino, latte, and palm sugar milk coffee were only affected by ingredient addition. Latte is brewed with a higher amount of milk and less espresso compared with the other coffee brews. By contrast, the latte contains more milk compared with a cappuccino and palm sugar milk coffee, resulting in a more dominant milky taste and creamy mouthfeel.
The sensory profile of cappuccino, latte, and palm sugar milk coffee were influenced solely by the ingredient composition. In contrast, espresso's sensory profile was affected by bean origins. Gayo espresso has a more bitter taste compared to Java Preanger and Toraja. On the other hand, espresso Java Preanger which contains more caffeoylquinic acids (CQAs) and less caffeine compared to Gayo espresso has an astringent aftertaste. A higher level of caffeine in Gayo espresso may be responsible for a more intense bitter taste. Although coffee contains many bitter chemicals, caffeine is well known as a bitter taste stimulus[43]. 5-CQA and alkaloids (trigonelline and caffeine), particularly bitterness and astringent, play an important role in the flavor, aroma, and quality of coffee brews. Additionally, it also depends on the interaction of these compounds with other chemical compounds in coffee brews[44−47].
-
Espresso brews had the highest CQA level and palm sugar milk coffee had the highest sugar and fat contents. Alkaloid compounds and antioxidant activity (DPPH and FRAP assay) were dependent on coffee bean origins and brewing methods. Espresso brews prepared from Gayo Arabica beans showed the highest alkaloid content, and Java Preanger had the highest antioxidant activity. The bioactive compounds showed a positive correlation with antioxidant activity (DPPH and FRAP), while sugar and fat contents showed a negative correlation with these activities. Regarding sensory quality, CATA analysis revealed that espresso from Gayo and Toraja was associated with bitter taste, sour aftertaste, roasted, burnt, and smokey aroma. Espresso from Java Preanger was associated with a sour taste, astringent aftertaste, and mouthfeel viscosity. Cappuccino and latte brews were mainly associated with a milky taste, creamy aftertaste and viscosity as a mouthfeel. Meanwhile, palm sugar milk coffee was associated with a sweet taste, sweet aftertaste, and caramel aroma. This study indicates that for the maximum espresso-based coffee brew consumption based on caffeine content is four cups of Arabica espresso (18 mL cup), two cups of palm sugar milk coffee (150 mL cup), two cups of cappuccino (220 mL cup), and four cups of latte (220 mL cup). Drinking espresso-based coffee beverages made from different ingredient formulations certainly may have different effects on our health. To evaluate the direct health benefits of espresso-based coffee beverages, further in vivo study is needed.
The authors would like to thank the Ministry of Education, Culture, Research, and Technology for funding this work (Grant Nos 027/E5/PG.02.00.PL/2024 and 22023/IT3.D10/PT.01.03/P/B/2024).
-
The authors confirm contribution to the paper as follows: study conception: Fitri N, Nurhaliza N, Anggraeni ES, Herawati D; Methodology: Fitri N, Nurhaliza N, Anggraeni ES, Herawati D, Hunaefi D; formal analysis: Fitri N; writing–original draft: Fitri N, Nurhaliza N, Anggraeni ES; writing–review & editing: Fitri N, Herawati D, Hunaefi D, Yulianti; supervision: Herawati D, Hunaefi D, Yulianti, Noviasari S. All authors reviewed the results and approved the final version of the manuscript.
-
The datasets generated during and/or analyzed during the current study are available from the corresponding author on reasonable request.
-
The authors declare that they have no conflict of interest.
- Supplementary Table S1 The generalized linear model (GLM) output in SPSS for chlorogenic acid (3-caffeoylquinic acid (CQA), 4-CQA, 5-CQA, and 3.5-diCQA) content of espresso-based coffee brews prepared from different bean origins.
- Supplementary Table S2 Post-hoc analysis in SPSS for 3-CQA content of espresso-based coffee brews.
- Supplementary Table S3 Post-hoc analysis in SPSS for 4-CQA content of espresso-based coffee brews.
- Supplementary Table S4 Post-hoc analysis in SPSS for 5-CQA content of espresso-based coffee brews.
- Supplementary Table S5 Post-hoc analysis in SPSS for 3.5-diCQA content of espresso-based coffee brews.
- Supplementary Table S6 The generalized linear model (GLM) output in SPSS for alkaloids content (trigonelline, theobromine, and caffeine) of espresso-based coffee brews prepared from different bean origins.
- Supplementary Table S7 Post-hoc analysis in SPSS for trigonelline content of espresso-based coffee brews.
- Supplementary Table S8 Post-hoc analysis in SPSS for theobromine content of espresso-based coffee brews.
- Supplementary Table S9 Post-hoc analysis in SPSS for caffeine content of espresso-based coffee brews.
- Supplementary Table S10 The generalized linear model (GLM) output in SPSS for antioxidant activities (DPPH and FRAP) of espresso-based coffee brews prepared from different bean origins.
- Supplementary Table S11 Post-hoc analysis in SPSS for espresso-based coffee brews' antioxidant activity (DPPH).
- Supplementary Table S12 Post-hoc analysis in SPSS for espresso-based coffee brews' antioxidant activity (FRAP).
- Copyright: © 2025 by the author(s). Published by Maximum Academic Press, Fayetteville, GA. This article is an open access article distributed under Creative Commons Attribution License (CC BY 4.0), visit https://creativecommons.org/licenses/by/4.0/.
-
About this article
Cite this article
Fitri N, Nurhaliza N, Anggraeni ES, Herawati D, Hunaefi D, et al. 2025. Chemical composition, antioxidant activity, and sensory profile of espresso-based Arabica coffee from different bean origins. Beverage Plant Research 5: e008 doi: 10.48130/bpr-0024-0040 

| Bean origins | Brews | Caffeoylquinic acid content (mg/100 mL) | Alkaloids content (mg/100 mL) | Antioxidant activity (mg TEAC/100 mL) |
||||||||
| 3-CQA | 4-CQA | 5-CQA | 3.5-diCQA | Trigonelline | Theobromine | Caffeine | DPPH | FRAP | ||||
| Java Preanger | Espresso | 107.2 ± 1.5a.C | 135 ± 4.4a.C | 313 ± 8.3a.C | 8.2 ± 0.7a.C | 284.1 ± 3.8a.B | 57.7 ± 2.1b.C | 393.3 ± 7.1a.D | 909.5 ± 77.1c.D | 2273.1 ± 123.5c.D | ||
| Java Preanger | Palm sugar milk coffee | 12.3 ± 1a.B | 14.9 ± 1.5a.B | 35.1 ± 2.1a.AB | 2 ± 0.1a.B | 57.2 ± 1a.A | 9.8 ± 0.1b.B | 103.3 ± 4.5a.C | 150.4 ± 14.89c.A | 712.8 ± 58.1c.B | ||
| Java Preanger | Cappuccino | 9 ± 0.5a.B | 12 ± 0.6a.B | 27.2 ± 1.2a.B | 1.6 ± 0.1a.B | 43.5 ± 4.4a.A | 7 ± 0.7b.B | 78.4 ± 3.5a.B | 730.8 ± 66.2c.C | 661.5 ± 43.4c.C | ||
| Java Preanger | Latte | 5.1 ± 0.3a.A | 5.9 ± 0.4a.A | 14.7 ± 0.3a.A | 1 ± 0.1a.A | 26.3 ± 1.5a.A | 2.3 ± 0.4b.A | 43.2 ± 1.7a.A | 578.9 ± 53.7c.B | 390.2 ± 26.8c.A | ||
| Gayo | Espresso | 103.5 ± 1.4a.C | 128.9 ± 1.9a.C | 283.3 ± 3.4a.C | 12.6 ± 0.5a.C | 311.3 ± 7.7b.B | 14.5 ± 0.8a.C | 489.3 ± 5b.D | 607.2 ± 55.4b.D | 2155.4 ± 103.7b.D | ||
| Gayo | Palm sugar milk coffee | 8.7 ± 0.5a.B | 10.5 ± 0.6a.B | 24.2 ± 2.1a.AB | 1.7 ± 0.1a.B | 68.6 ± 4.9b.A | 0.3 ± 0a.B | 105 ± 4.2b.C | 96.2 ± 8.8b.A | 616.4 ± 21.6b.B | ||
| Gayo | Cappuccino | 11.8 ± 1a.B | 14.8 ± 0.9a.B | 33.9 ± 2.6a.B | 2.1 ± 0a.B | 47.1 ± 1.3b.A | 5.6 ± 0.4a.B | 75.2 ± 2.3b.B | 411.8 ± 38.4b.C | 590.3 ± 55.7b.C | ||
| Gayo | Latte | 2.9 ± 0.2a.A | 3.2 ± 0.2a.A | 28.8 ± 0.7a.A | 0.8 ± 0a.A | 26.1 ± 1.7b.A | 2.2 ± 0.1a.A | 45.7 ± 2.6b.A | 557.7 ± 47.7b.B | 394.2 ± 22.4b.A | ||
| Toraja | Espresso | 121.2 ± 3.8a.C | 143.3 ± 3.9a.C | 293.8 ± 7.1a.C | 6.5 ± 0a.C | 290.4 ± 1.6a.B | 7.7 ± 0.8a.C | 434.7 ± 9.2a.D | 508.3 ± 49.5a.D | 2019.7 ± 201.1a.D | ||
| Toraja | Palm sugar milk coffee | 8.9 ± 0.7a.B | 11.4 ± 0.5a.B | 26.9 ± 2.4a.AB | 1.6 ± 0.1a.B | 69.6 ± 3.9a.A | 10.1 ± 0.6a.B | 102.2 ± 5.2a.C | 122.3 ± 9.3a.A | 452.6 ± 4a.B | ||
| Toraja | Cappuccino | 9.2 ± 0.6a.B | 11.3 ± 0.3a.B | 25.6 ± 0.6a.B | 1.6 ± 0a.B | 52.1 ± 2.3a.A | 8.2 ± 0.1a.B | 77.7 ± 6.3a.B | 437.3 ± 168.5a.C | 590 ± 39.7a.C | ||
| Toraja | Latte | 2.8 ± 0.1a.A | 3.8 ± 0.1a.A | 10.4 ± 0.1a.A | 0.8 ± 0a.A | 27.3 ± 2.5a.A | 3.2 ± 0.2a.A | 40 ± 2.6a.A | 102.5 ± 9a.B | 394.3 ± 29.3a.A | ||
| The values for caffeoylquinic acids and alkaloids were expressed as the average and standard deviation based on three data points. The values for antioxidant activities were expressed as the average and standard deviation based on four data points. Small case letters (a−c) represent the significant effect of bean origin on observed parameters (p < 0.05). Capital letters (A−D) represent the significant effect of brewing methods on observed parameters (p < 0.05). | ||||||||||||