


-
The nutritional demands of yeasts include sugar sources, assimilable nitrogen, micronutrients, and lipids. All these are necessary for the proper functioning of the yeasts as regards its metabolic activities for the production of alcohol and other metabolites[1]. Nitrogenous compounds are required by yeast cells for their metabolic activities and have a direct correlation with their fermentative capacity especially their rate of ethanol formation from fermentation of sugars[2]. It has been reported that nitrogen either naturally present in the cultivation medium or externally incorporated into the medium has a positive effect on yeast growth and generation of yeast biomass[3]. Yeast cells on their own are capable of synthesizing nitrogenous compounds especially when such essential compounds are lacking in the growth medium[4]. Lack of nitrogen or its inadequacy in the growth medium have been shown to cause sluggish or stuck fermentations and must therefore be put into consideration during the start and course of fermentation processes[5]. Different yeast strains require different nitrogen sources as well as concentration as yeast strains possess specific amino acid profiles[6]. However, several studies seem to suggest that the molecular dynamics controlling the rate of nitrogen metabolism are dominantly preserved in the species Saccharomyces cerevisiae[7]. Some particular isolated strains of Saccharomyces and non-Saccharomyces yeasts have been reported to possess high fermentation capacities[8]. However, the interaction between nitrogenous compounds and beer flavor profiles as well as the fermentation conditions like temperature and pH have been reported to be complicated[9].
This research aimed to clarify the impact of different nitrogen sources, initial pH and varied inoculum size on the fermentation potential of Saccharomyces cerevisiae B05 on Sorghum wort.
-
The sorghum variety CSR-03H was procured through the collaborative efforts of the National Cereals Research Institute (NCRI), Zaria, Kaduna State, Nigeria and Food and Agro Allied Ltd, Sango-Otta, Ogun State, Nigeria; and transported to the Biotechnology laboratory of the Federal Institute for Industrial Research Oshodi (FIIRO), Lagos State, Nigeria for analysis. Yeast (Saccharomyces cerevisiae Strain B05) and hop extract was supplied by Nigerian Breweries Plc, Iganmu, Lagos State, Nigeria. Also, the reagents and materials used were made available by the Federal Institute for Industrial Research Oshodi (FIIRO), Lagos State, Nigeria, where the research work was carried out.
Preparation of sorghum for malting
-
The sorghum grains were sorted manually to remove shapeless, broken and immature kernels, dust, stones, and other extraneous materials. Thereafter, the kernels were properly washed in tap water contained in a 40 L bucket. The washed grains were stirred in the water and separated. The separated grains were dried under sunlight and stored in sterile plastic bags.
Malting and kilning of sorghum seeds
-
Weighed 5 kg of sorghum grains were transferred into a 50 L plastic bucket made up with 40 L of water and steeping was done for 10 h at a temperature of 30 °C. The steeped water was removed and replaced with fresh water every 6 h interval for 48 h. The grains were then blotted with sterile towels to remove surface water and placed on an aluminum tray. The tray was covered with foil papers and germination was allowed for 72 h. During the germination period, the foil papers were partially removed and the kernels were turned periodically at 6 h intervals with their surface sprayed with tap water in the process. Kilning of the resulting seedlings was done in a hot air oven at 60 °C for 48 h. After cooling of the resulting seedlings, rootlets were removed by rubbing vigorously in a sieve of mesh size 1.30 mm[21].
Milling the malt
-
Dry-milling of 3kg sorghum malt into fine malt flour was done using a Laboratory mill (Quadrumat Jr. Model SM 200 Brabender, Duisburg, Germany).
Mashing, iodine test, and wort boiling
-
Gelatinization of 200 g of sorghum malt suspended in 400 ml mash liquor was carried out at 80 °C for 20 min. The sample was subjected to a three-mash decoction mashing as described by Endres et al.[10]. The pH of the wort was adjusted to 5.5 before fermentation. The entire process of production of the sorghum wort is shown in Fig. 1.
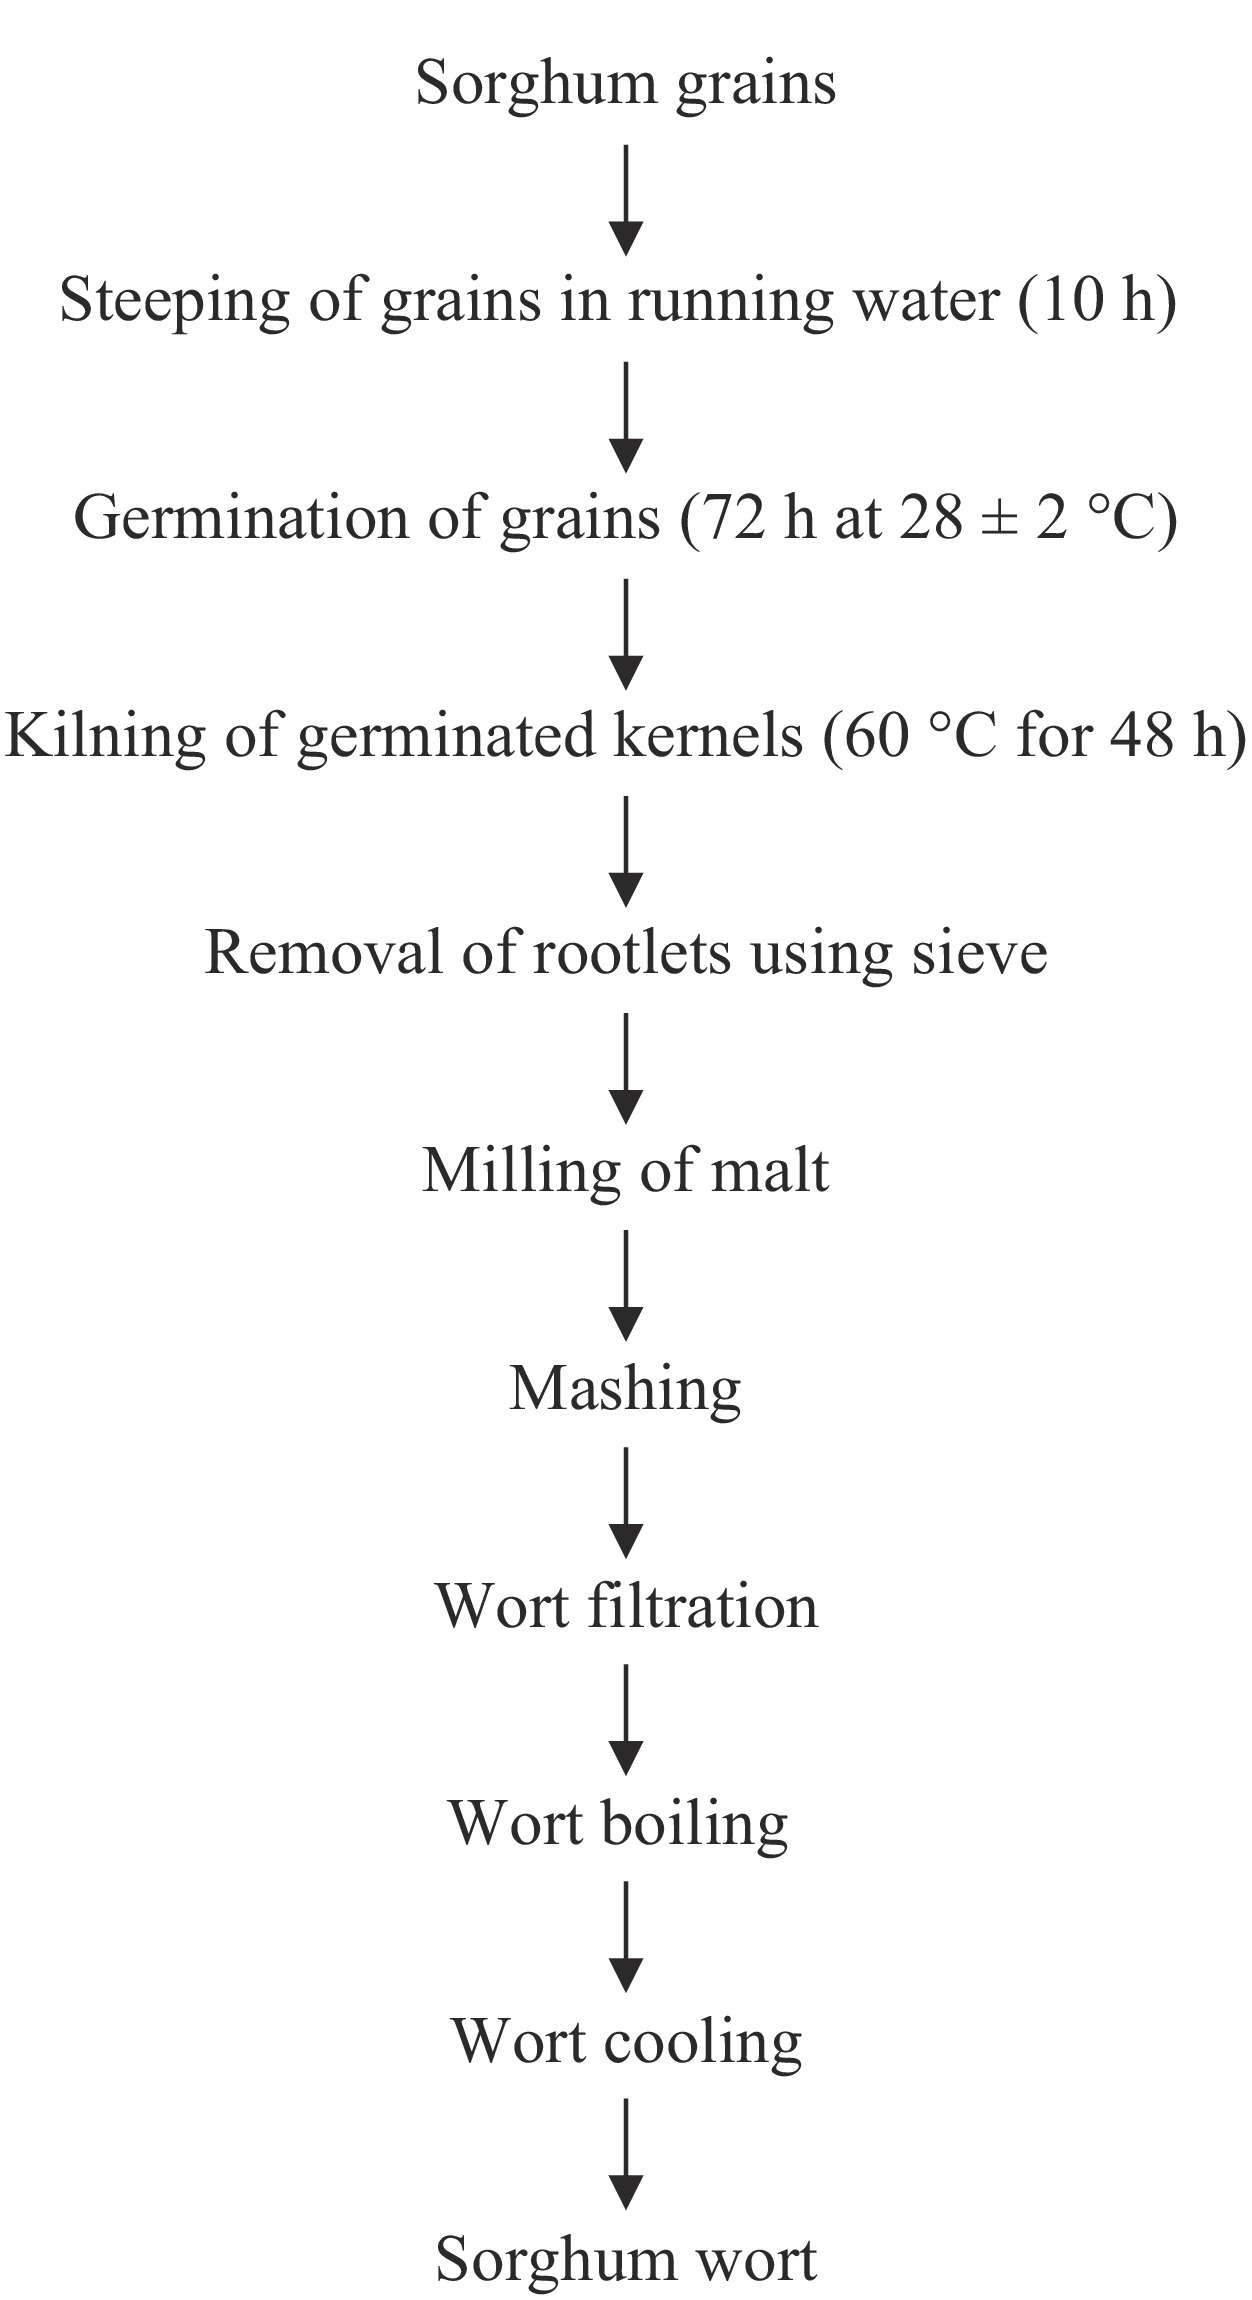
Figure 1.
Production of sorghum wort.
Yeast propagation
-
Measured 65 g of Yeast Extract Peptone Dextrose (YEPD) powder was suspended in 1,000 ml of distilled water. The mixture was stirred thoroughly and thereafter boiled for 1 min to dissolve the medium completely. This was sterilized by autoclaving at 15 lbs pressure (121 °C) for 15 min. Culturing and sub-culturing of yeast was done on Yeast Extract Peptone Dextrose (YEPD) medium. The sorghum wort for each experiment was inoculated with 1.24 × 10⁸ CFU/ml of yeast and incubated at 28 ± 2 °C for 72 h[19].
Effect of different nitrogen sources on fermentation performance of yeast
-
Different nitrogen sources were tested individually to study their effect on the fermentation performance of yeast. The nitrogen sources include urea, diammonium phosphate, ammonium sulfate, and ammonium nitrate. Two different concentrations of 0.025% w/v and 0.05% w/v were used for each nitrogen source in the experimental set-up. A control was set up without any of these nitrogen sources and made up entirely of the substrate. Based on the method of Cadenas et al.[11].
Effect of varying pH of wort on fermentation performance of yeast
-
Six experimental variables of 50 ml 100% sorghum wort were prepared. Based on the method of Hossain et al.[12], the pH of the portions were adjusted to give pH 4.0, 4.5, 5.0, 5.5, 6.0 and 6.5 respectively using 10% phosphoric acid and 35% calcium hydroxide solution (lime).
Effect of varying inoculum size on fermentation performance of yeast
-
Six experimental variables of measured 50 ml 100% sorghum wort sample each was used to ascertain the effect of varying inoculum size on the fermentation capacity of the yeast on the wort. Based on the method of Coulibaly et al.[8].
Parameters analyzed
pH
-
Measured 10 ml of sorghum wort was transferred into a 100 ml beaker. The pH was determined using a pH meter (Model P 211 Hanna, Salaj, Romania).
Specific gravity
-
The specific gravities of the sorghum worts were determined using a handheld Stanley and Bellingham refractometer at 28 °C in °Brix. Degrees Brix (°Brix) is a measure of the dissolved solids in the liquid wort.
Alcohol content
-
The percentage ethanol of the fermented products was determined using the specific gravity (bottle) method[13].
Total acidity
-
The total acidity was determined using the method of Tsegay[14].
Total soluble sugar
-
Total soluble sugar was determined using a handheld Bellingham and Stanley refractometer at 28 °C.
Statistical analysis
-
An average of triplicate readings for each treatment was used for all the determinations. Analysis of variance (ANOVA) was performed using the SPSS statistical package (version 20) to locate significant differences between means of triplicates at p < 0.05.
-
The effect of the different nitrogen sources and concentrations on the pH during beer fermentation for 72 h is shown (Table 1). The pH value after 72 h of fermentation decreased (p < 0.05) irrespective of the concentrations and nature of the nitrogen sources even though the values were lower than that of the control and revealed acid values in the range of 3.74 ± 0.01 (for samples containing 0.05% w/v ammonium sulfate) and 3.86 ± 0.01 (for samples containing 0.025% w/v urea). The decrease in the pH and increase in the titratable acidity of the different media from 0 to 72 h fermentation period could be attributed to the degradation of sugars and utilization of the ammonium supplement by the yeast strain to yield organic acids[15]. The medium containing 0.05% w/v ammonium sulfate had the highest fermentation rate compared to other media, as it had the lowest pH after a 72 h fermentation period. Also, significant differences were not observed for the media containing 0.05% w/v ammonium sulfate and 0.025% w/v ammonium sulfate (p < 0.05). This indicates that the yeasts were able to metabolize the inorganic nitrogenous medium containing ammonium sulfate much better than the other nitrogenous media. This also suggests that the amount of ammonium sulfate had minimal effect on the optimal fermentation performance of yeast cells. It has been reported that the use of urea as a nitrogen source could cause an increase in the amount of OH− in the medium which could have been a reason for the higher pH and lower acidity values after 72 h fermentation period obtained in this research work[16].
Table 1. Effect of different nitrogen sources on pH of wort during fermentation by S. cerevisiae.
Nitrogen content (% w/v) Nitrogen source Fermentation period (h) 0 24 48 72 0.025 Ammonium nitrate 5.20 ± 0.00 4.86 ± 0.01b 4.29 ± 0.01b 3.85 ± 0.01b Ammonium sulfate 5.29 ± 0.00 4.61 ± 0.01a 4.21 ± 0.01a 3.83 ± 0.02b Urea 5.39 ± 0.00 4.90 ± 0.01c 4.38 ± 0.01c 3.86 ± 0.01b Control 5.90 ± 0.00 5.50 ± 0.01d 4.90 ± 0.01d 4.20 ± 0.01a 0.05 Ammonium nitrate 5.28 ± 0.00 4.58 ± 0.01c 3.99 ± 0.01b 3.79 ± 0.01 Ammonium sulfate 5.34 ± 0.00 4.56 ± 0.01c 3.95 ± 0.02c 3.74 ± 0.01 Urea 5.42 ± 0.00 4.67 ± 0.01b 4.02 ± 0.01b 3.85 ± 0.01 Control 5.90 ± 0.00 5.50 ± 0.01a 4.90 ± 0.00a 4.20 ± 0.01 Values are expressed as mean ± standard deviation of triplicates. Note: All similar lower case letters within a column show means that are not significantly different (p > 0.05). Table 2 shows the changes in the total soluble sugar values with different nitrogen sources during beer fermentation for 72 h. After 72 h of fermentation, the sample containing 0.025% w/v ammonium nitrate had the highest total soluble sugar of 6.57 ± 0.01 °Brix while the least (4.93 ± 0.02 °Brix) was from the sample containing 0.05% w/v ammonium sulfate. The decrease in total soluble sugars (TSS) and specific gravity (p < 0.05) from 0 to 72 h fermentation period could be due to the consumption of the sugars by yeasts for the formation of ethanol, carbon (IV) oxide, organic acids, and other metabolites[17]. Again, as expected, the medium containing ammonium sulfate having the least TSS value after a 72 h fermentation period gave the best fermentation performance by the yeasts. Once again, it showed that the yeasts were able to metabolize the medium containing ammonium sulfate better than the other nitrogenous sources. Also, significant differences were not observed for media containing 0.05% w/v ammonium sulfate and 0.025% w/v ammonium sulfate (p < 0.05). It showed the concentration of nitrogen had little effect on the decrease in TSS.
Table 2. Effect of different nitrogen sources on total soluble sugar ( °Brix) of wort during Fermentation by S. cerevisiae.
Nitrogen content (% w/v) Nitrogen source Fermentation period (h) 0 24 48 72 0.025 Ammonium nitrate 15.80 ± 0.00 12.73 ± 0.01b 9.10 ± 0.02b 6.57 ± 0.01b Ammonium sulfate 15.80 ± 0.00 11.50 ± 0.12d 8.40 ± 0.06d 6.10 ± 0.23b Urea 15.80 ± 0.00 12.00 ± 0.12c 10.77 ± 0.02c 6.40 ± 0.23b Control 15.80 ± 0.00 13.20 ± 0.06a 11.80 ± 0.01a 8.80 ± 0.06a 0.05 Ammonium nitrate 15.80 ± 0.00 11.90 ± 0.02b 8.73 ± 0.01b 5.77 ± 0.04b Ammonium sulfate 15.80 ± 0.00 10.60 ± 0.02c 7.50 ± 0.06c 4.93 ± 0.02b Urea 15.80 ± 0.00 11.53 ± 0.22b 8.30 ± 0.06b 5.20 ± 0.06b Control 15.80 ± 0.00 13.20 ± 0.01a 11.80 ± 0.06a 8.77 ± 0.04a Values are expressed as mean ± standard deviation of triplicates. Note: All similar lower case letters within a column show means that are not significantly different (p > 0.05). Table 3 shows the specific gravity values. After 72 h of fermentation, irrespective of concentration, the highest value (1.03 ± 0.00) was from samples containing urea while the least (1.02 ± 0.00) was from samples containing ammonium sulfate and ammonium nitrate. The titratable acidity values are shown in Table 4. After a 72 h fermentation period, the highest value (3.65 ± 0.03) was from samples containing 0.05% w/v ammonium sulfate while the least (3.17 ± 0.02) was from that containing 0.025% w/v urea. Table 5 reveals the values for alcohol content. After a 72 h fermentation period, samples containing 0.05% w/v ammonium sulfate had the highest (4.47% ± 0.02%) while the least (3.77% ± 0.15%) was from sample containing 0.025% w/v urea. Statistical analysis revealed significant differences between the samples for all measured parameters at p < 0.001 confidence level. The rise in the alcohol values from 0 h to 72 h fermentation period showed the activity of the yeast cells in the conversion of the metabolizable sugars in the wort into alcohol. Medium containing ammonium sulfate which gave the highest alcohol concentration after a 72 h fermentation period could be regarded as the media of choice by the yeast strain employed for pitching the wort as they were able to metabolize this nitrogen source better than the others. These lower values for alcohol recorded for the other nitrogen sources could be attributed to the inhibitory effects of the nitrogen sources on the yeast[18]. This also reveals that the amount of ammonium sulfate had minimal effect on ethanol generation by the yeast cells.
Table 3. Effect of different nitrogen sources on specific gravity of wort during fermentation by S. cerevisiae.
Nitrogen content (% w/v) Nitrogen source Fermentation period (h) 0 24 48 72 0.025 Ammonium nitrate 1.07 ± 0.00 1.05 ± 0.00b 1.04 ± 0.00b 1.02 ± 0.00c Ammonium sulfate 1.07 ± 0.00 1.05 ± 0.00b 1.03 ± 0.00c 1.02 ± 0.00c Urea 1.07 ± 0.00 1.05 ± 0.00b 1.04 ± 0.00b 1.03 ± 0.00b Control 1.07 ± 0.00 1.06 ± 0.00a 1.05 ± 0.00a 1.04 ± 0.00a 0.05 Ammonium nitrate 1.07 ± 0.00 1.05 ± 0.00b 1.03 ± 0.00c 1.02 ± 0.00c Ammonium sulfate 1.07 ± 0.00 1.04 ± 0.00c 1.03 ± 0.00c 1.02 ± 0.00c Urea 1.07 ± 0.00 1.05 ± 0.00b 1.04 ± 0.00b 1.03 ± 0.00b Control 1.07 ± 0.00 1.06 ± 0.00a 1.05 ± 0.00a 1.04 ± 0.00a Values are expressed as mean ± standard deviation of triplicates. Note: All similar lower case letters within a column show means that are not significantly different (p > 0.05). Table 4. Effect of different nitrogen sources on titratable acidity (%) of wort during fermentation by S. cerevisiae.
Nitrogen content (% w/v) Nitrogen source Fermentation period (h) 0 24 48 72 0.025 Ammonium nitrate 1.45 ± 0.01b 2.27 ± 0.01c 2.83 ± 0.02b 3.26 ± 0.01a Ammonium sulfate 1.40 ± 0.00c 2.39 ± 0.01b 2.93 ± 0.02b 3.34 ± 0.02a Urea 1.36 ± 0.00d 2.22 ± 0.01d 2.68 ± 0.01c 3.17 ± 0.02b Control 1.58 ± 0.00a 2.50 ± 0.01a 3.04 ± 0.02a 3.05 ± 0.03b 0.05 Ammonium nitrate 1.20 ± 0.00d 2.51 ± 0.01b 3.25 ± 0.03a 3.57 ± 0.01a Ammonium sulfate 1.38 ± 0.01b 2.55 ± 0.01a 3.35 ± 0.03a 3.65 ± 0.03a Urea 1.34 ± 0.01c 2.42 ± 0.01c 2.97 ± 0.04b 3.17 ± 0.07b Control 1.58 ± 0.00a 2.52 ± 0.01b 3.00 ± 0.06b 3.03 ± 0.04c Values are expressed as mean ± standard deviation of triplicates. Note: All similar lower case letters within a column show means that are not significantly different (p > 0.05). Table 5. Effect of different nitrogen sources on alcohol content (%) of wort during fermentation by S. cerevisiae.
Nitrogen content (% w/v) Nitrogen source Fermentation period (h) 0 24 48 72 0.025 Ammonium nitrate 0.00 ± 0.00 2.77 ± 0.01a 3.01 ± 0.01b 3.91 ± 0.00b Ammonium sulfate 0.00 ± 0.00 2.89 ± 0.01a 3.25 ± 0.03a 4.25 ± 0.03a Urea 0.00 ± 0.00 2.73 ± 0.02b 3.10 ± 0.06c 3.77 ± 0.15c Control 0.00 ± 0.00 2.48 ± 0.01c 2.82 ± 0.02d 3.43 ± 0.08d 0.05 Ammonium nitrate 0.00 ± 0.00 2.89 ± 0.01b 3.24 ± 0.02c 4.21 ± 0.01b Ammonium sulfate 0.00 ± 0.00 3.05 ± 0.03a 3.55 ± 0.03a 4.47 ± 0.02a Urea 0.00 ± 0.00 2.93 ± 0.02b 3.35 ± 0.03b 4.05 ± 0.13c Control 0.00 ± 0.00 2.55 ± 0.03c 3.15 ± 0.03c 3.59 ± 0.05c Values are expressed as mean ± standard deviation of triplicates. Note: All similar lower case letters within a column show means that are not significantly different (p > 0.05). Nitrogen is one of the primary nutrients required for yeast growth and optimum ethanol production efficiency[19]. Nitrogen in yeast fermentation plays both anabolic and catabolic roles. The former role involves the biosynthesis of enzymes and nucleic acids, while the latter role involves the development of higher alcohols which serve as flavor congeners[20]. The component of the nitrogenous composition of wort determines yeast growth and fermentation. It is necessary in predicating the quality of beer[21]. Yeasts make use of nitrogen for the production of several metabolites needed for their proliferation and fermentative activities[19]. From the results, it can be observed that the most preferred nitrogen source by the yeast strain is ammonium sulfate. Hence, ammonium sulfate was chosen as the choice nitrogen source in the formulation of the sorghum substrate for beer production.
The highest ethanol concentration obtained after a 72 h fermentation period using ammonium sulfate is supported by the results of Ferreira & Guido[21]. The use of ammonium sulfate as a nitrogen source has been reported to cause an increase in acidification and could be a part contributor to the higher acidity and lower pH recorded in this research work[23]. The lower values for alcohol recorded when urea and ammonium nitrate were employed as nitrogen sources are contrary to the report of Adejuyitan et al.[24]. The use of urea as an organic nitrogen source supplement for brewery fermentations has been strongly discouraged due to its potential to form the carcinogenic ethyl carbamate[25]. Limitation of nitrogen to yeasts has been linked to a potential loss of enzyme activity[22]. Therefore, the results reveal that relatively higher alcohol can be obtained from the pitching yeast in the presence of an inorganic nitrogen source supplement rather than an organic source.
Effect of varied pH on S. cerevisiae during beer fermentation
-
Changes in pH were observed during beer fermentation for 72 h (Table 6). After the fermentation period, the highest value (3.76 ± 0.03) was from samples adjusted to an initial pH of 6.50 while the least (3.38 ± 0.01) was from pH 5.50. The values for total soluble sugar are shown in Table 7. After 72 h fermentation, the highest value (8.90 ± 0.06) was from samples with pH 6.50 while the least (4.33 ± 0.09) was from pH 5.50.
Table 6. Effect of varied initial pH on pH of wort during fermentation by S. cerevisiae.
pH Fermentation period (h) 0 24 48 72 4.00 4.00 ± 0.00 3.97 ± 0.01c 3.90 ± 0.01b 3.51 ± 0.01b 4.50 4.50 ± 0.00 4.24 ± 0.02b 3.87 ± 0.01c 3.51 ± 0.01b 5.00 5.00 ± 0.00 3.97 ± 0.01c 3.67 ± 0.02e 3.43 ± 0.01c 5.50 5.50 ± 0.00 3.75 ± 0.01c 3.56 ± 0.01f 3.38 ± 0.01a 6.00 6.00 ± 0.00 4.06 ± 0.04b 3.74 ± 0.01d 3.46 ± 0.01c 6.50 6.50 ± 0.00 5.37 ± 0.01a 3.92 ± 0.01a 3.76 ± 0.03a Values are expressed as mean ± standard deviation of triplicates. Note: All similar lower case letters within a column show means that are not significantly different (p > 0.05). Table 7. Effect of varied initial pH on total soluble sugar ( °Brix) of wort during fermentation by S. cerevisiae.
pH Fermentation period (h) 0 24 48 72 4.00 15.80 ± 0.00 13.57 ± 0.09a 9.70 ± 0.12b 7.83 ± 0.07b 4.50 15.80 ± 0.00 12.60 ± 0.12b 8.30 ± 0.06c 7.57 ± 0.03b 5.00 15.80 ± 0.00 11.15 ± 0.29c 7.90 ± 0.06d 6.30 ± 0.06c 5.50 15.80 ± 0.00 10.33 ± 0.09d 6.80 ± 0.06e 4.33 ± 0.09d 6.00 15.80 ± 0.00 11.43 ± 0.09c 8.08 ± 0.02c 7.03 ± 0.02b 6.50 15.80 ± 0.00 13.90 ± 0.06a 11.05 ± 0.03a 8.90 ± 0.06a Values are expressed as mean ± standard deviation of triplicates. Note: All similar lower case letters within a column show means that are not significantly different (p > 0.05). The specific gravity values are presented in Table 8. After 72 h fermentation, the highest value was from pH 6.50 while samples with initial pH of 4.50, 5.00, 5.50, and 6.00 had the least value of 1.02 ± 0.00. The acidity of the samples is shown in Table 9 with pH 5.50 had the highest value of 3.88 ± 0.01 ml while pH 6.50 had the lowest value of 3.39 ± 0.01 ml, after a 72 h fermentation period.
Table 8. Effect of varied initial pH on specific gravity of wort during fermentation by S. cerevisiae.
pH Fermentation period (h) 0 24 48 72 4.00 1.07 ± 0.00 1.06 ± 0.00a 1.04 ± 0.00b 1.03 ± 0.00b 4.50 1.07 ± 0.00 1.05 ± 0.00b 1.04 ± 0.00b 1.02 ± 0.00c 5.00 1.07 ± 0.00 1.05 ± 0.00b 1.03 ± 0.00c 1.02 ± 0.00c 5.50 1.07 ± 0.00 1.04 ± 0.00c 1.03 ± 0.00c 1.02 ± 0.00c 6.00 1.07 ± 0.00 1.05 ± 0.00b 1.03 ± 0.00c 1.02 ± 0.00c 6.50 1.07 ± 0.00 1.06 ± 0.00a 1.05 ± 0.00a 1.04 ± 0.00a Values are expressed as mean ± standard deviation of triplicates. Note: All similar lower case letters within a column show means that are not significantly different (p > 0.05). Table 9. Effect of varied initial pH on titratable acidity (%) of wort during fermentation by S. cerevisiae.
pH Fermentation period (h) 0 24 48 72 4.00 1.39 ± 0.01d 1.76 ± 0.01d 3.22 ± 0.11b 3.61 ± 0.01b 4.50 1.52 ± 0.01c 2.26 ± 0.01c 3.27 ± 0.01b 3.76 ± 0.01b 5.00 2.55 ± 0.03a 2.93 ± 0.09b 3.39 ± 0.01b 3.82 ± 0.01a 5.50 2.84 ± 0.02a 3.52 ± 0.01a 3.75 ± 0.03a 3.88 ± 0.01a 6.00 1.78 ± 0.01b 2.48 ± 0.01b 3.29 ± 0.01b 3.79 ± 0.02b 6.50 1.22 ± 0.01 1.44 ± 0.01e 3.17 ± 0.01b 3.39 ± 0.01c Values are expressed as mean ± standard deviation of triplicates. Note: All similar lower case letters within a column show means that are not significantly different (p > 0.05). The alcohol content of the samples is presented in Table 10. After 72 h fermentation, the highest value (4.43% ± 0.01%) was from pH 5.50 while the least (3.61% ± 0.01%) was from pH 6.50. Statistical analysis revealed significant differences between the samples for all measured parameters at p < 0.001 confidence level.
Table 10. Effect of varied initial pH on alcohol content (%) of wort during fermentation by S. cerevisiae.
pH Fermentation period (h) 0 24 48 72 4.00 0.00 ± 0.00 2.18 ± 0.01b 3.77 ± 0.01a 4.12 ± 0.01a 4.50 0.00 ± 0.00 2.41 ± 0.01b 3.49 ± 0.00b 4.25 ± 0.03a 5.00 0.00 ± 0.00 2.60 ± 0.01a 3.33 ± 0.02b 4.38 ± 0.01a 5.50 0.00 ± 0.00 2.79 ± 0.01a 3.76 ± 0.01a 4.43 ± 0.01a 6.00 0.00 ± 0.00 2.22 ± 0.01b 3.16 ± 0.01b 4.29 ± 0.01a 6.50 0.00 ± 0.00 2.19 ± 0.00b 2.89 ± 0.01c 3.61 ± 0.01b Values are expressed as mean ± standard deviation of triplicates. Note: All similar lower case letters within a column show means that are not significantly different (p > 0.05). The rate of ethanol production by yeast cells is strongly affected by the pH of the fermentation medium[26]. Acidic conditions tend to favor the growth of yeast and inhibit the growth of spoilage bacteria in wort[27]. However, continued increase in acidity slows down the metabolic pathways and growth of the yeast cells[28]. Thus, optimum pH is required for efficient growth of yeasts and concomitantly, the yield of ethanol.
The medium with an initial pH adjusted to 5.50 gave the best fermentation performance by the yeast strain as it had the greatest decrease in pH and increase in acidity (p < 0.05) after a 72 h fermentation period. This meant that under this pH condition, the yeasts were more suited to carry out their fermentation activities. In this regard, it is noticed that the fermentation efficiency of the yeast cells decreased the more the adjusted initial pH fell below or above the optimum value of 5.50. This trend is also reflected in the TSS and specific gravity values as adjusted initial pH 5.50 also gave the least values showing the greatest utilization of sugars by the yeasts under this pH condition. The medium with initial pH adjusted to 5.50 generating the highest amount of alcohol by the yeasts after a 72 h fermentation period further buttresses the fact that the optimum initial pH required by the yeast strain used in this research work during fermentation is 5.50. Medium with adjusted initial pH of 6.5 was the least desired by the yeasts. Higher final pH, TSS and specific gravity values as well as lower final acidity and ethanol levels after 72 h fermentation period produced at adjusted initial pH values below and above 5.50 in this research work could be as a result of two different reasons. The first is the inactivation of the enzymes as enzymes work efficiently at optimum pH and the second is as a result of an increase in the chemical stress placed on the yeast cells which would have to garner more energy to stabilize their intracellular pH at pH values other than the optimum. In that light, this adjusted initial pH was adopted for the formulation of the cassava/sorghum substrate for beer production.
The highest ethanol concentration obtained after a 72 h fermentation period for initial pH of 5.50 in this research work is similar to the work of Phong et al.[26]. Also, Sharma et al.[29] reported a medium initial pH of 5.50 as the required pH for optimum ethanol production by yeasts irrespective of the concentration of dissolved solids. They also revealed in their study that a pH of 5.00 to 5.50 will help to minimize the effects of bacterial contamination and maximize ethanol production by yeast. Yeasts have been reported to have optimum pH between 4.00 and 6.00[30]. Stewart[31] suggested a pH range of 4.00−5.00 as the operational limit for ethanol production by yeasts but also reiterated the reports of previous studies which instead suggested a pH range of 5.00−6.00. The required mash pH from the literature is usually within the range of 5.20−6.00[28]. The expected wort pH for sorghum malt is within the range of 5.20−5.80[32]. The pH values often recorded for wort obtained from barley malt range from 5.40 to 5.60 while for beers resulting from barley malt, the values range from 4.20 to 4.50 in the final products[33]. The wort pH of 5.50 is in conformity with the study conducted by Malina et al.[28] using 100% sorghum malt and 100% barley malt who reported a wort pH of 5.20 and 5.40 respectively. The results for wort pH obtained were lower than those reported by Adebo[34] who found that the pH of wort obtained using two Nigerian sorghum varieties (SK5912 and farafara) were 6.20 and 6.30 respectively. The result of wort pH was close to that reported by Xiang et al.[35] for wort produced from malted barley and sorghum adjuncts with pH values ranging from 5.60 to 6.00. Wort pH has a great impact on the activities of the enzymes present in malt. The wort pH obtained will create a positive effect as regards higher ethanol and CO2 production for the beer products due to the generation of higher amounts of soluble sugars by increased enzymatic activities.
Effect of varying inoculum size on S. cerevisiae during beer fermentation
-
Varying the size of the pitching yeast led to changes in the pH during fermentation (Table 11). After a 72 h fermentation period, the highest value (3.51 ± 0.01) was from sample containing 7.44 × 10⁸ cells/ml, while the least (3.33 ± 0.01) was from that containing 1.24 × 10⁸ cells/ml. The result for total soluble sugar is shown in Table 12. After 72 h fermentation, the sample containing 7.44 × 10⁸ cells/ml had the highest value (6.97 ± 0.12 °Brix) while that containing 1.24 × 10⁸ cells/ml had the least value (6.30 ± 0.06 °Brix). For specific gravity (Table 13), after 72 h fermentation period the highest value (1.04 ± 0.00) was from samples containing 7.44 × 10⁸ cells/ml while the least value (1.02 ± 0.00) was from that containing 1.24 × 10⁸ cells/ml. Varying the inoculum size also led to changes in acidity (Table 14). After 72 h fermentation, the highest value (4.18 ± 0.01 ml) was from sample containing 1.24 × 10⁸ cells/ml while the least value (3.66 ± 0.01 ml) was from samples containing 7.44 × 10⁸ cells/ml. The alcohol content is shown in Table 15. After 72 h fermentation, the highest value (4.60 ± 0.01%) was from samples containing 1.24 × 10⁸ cells/ml while the lowest (3.12% ± 0.01%) was from samples containing 7.44 × 10⁸ cells/ml. Statistical analysis revealed significant differences between the samples for all measured parameters at p < 0.001 confidence level. The amount of inoculum used for pitching of wort plays a major role in influencing the rate of fermentation, growth rate, biomass yield as well as the quality of the final product[36]. Yeast inoculum size has a great effect on the generation of ethanol. The fact that the pH was the lowest after a 72 h fermentation period for medium containing yeast cells at a concentration of 1.24 × 10⁸ cells/ml than at any other higher concentration, showed that fermentation of wort by the yeast cells was most effective at lower inoculum size than at higher concentrations. This fact is further elucidated as the medium containing 1.24 × 10⁸ cells/ml of yeast cells had the least TSS and specific gravity values after a 72 h fermentation period. Also, the optimum ethanol yield for this research work was obtained at an inoculum size of 1.24 × 10⁸ cells/ml. Inoculum sizes above this value gave a relatively lower yield of alcohol. This effectiveness of fermentation by the yeast cells at lower inoculum size than at higher inoculum levels could be due to the accumulation of by-products such as xylitol resulting from repressive fermentations[37]. The results obtained were the rational behind the selection of the optimum pitching size of 1.24 × 10⁸ cells/ml for the pitching of wort obtained from the various formulations of cassava/sorghum substrates for beer production. The decrease in total soluble sugar and the corresponding increase in alcohol (p < 0.05) after a 72 h fermentation period that was observed in this research work are supported by Roca-Mesa et al.[18]. The lower yield in ethanol with higher inoculum sizes is supported by Hawashi et al.[38]. An increase in ethanol concentration has been shown to have a positive correlation with a decrease in total soluble sugars[22]. It has reported that higher inoculum size of yeast has no advantage in terms of ethanol production[20]. This could have been a major factor for the lower yield of alcohol at higher inoculum sizes. Roca-Mesa et al.[18] revealed that increasing the pitching rate led to a decrease in the levels of alcohol generated. However, Phong et al.[26] suggested that increasing inoculum sizes led to a corresponding increase in alcohol production levels during fermentation. Sasmal et al.[16] attributed this contradiction to differences in the strain of yeasts used.
Table 11. Effect of varied inoculum size on pH of wort during fermentation by S. cerevisiae.
Inoculum size
(cells/ml)Fermentation period (h) 0 24 48 72 1.24 × 10⁸ 5.50 ± 0.00 3.41 ± 0.01b 3.39 ± 0.01c 3.33 ± 0.01c 2.48 × 10⁸ 5.50 ± 0.00 3.46 ± 0.01b 3.40 ± 0.01b 3.37 ± 0.01b 3.72 × 10⁸ 5.50 ± 0.00 3.50 ± 0.01a 3.45 ± 0.01b 3.41 ± 0.01b 4.96 × 10⁸ 5.50 ± 0.00 3.52 ± 0.01a 3.46 ± 0.01b 3.44 ± 0.01b 6.20 × 10⁸ 5.50 ± 0.00 3.55 ± 0.01a 3.49 ± 0.00b 3.48 ± 0.00b 7.44 × 10⁸ 5.50 ± 0.00 3.58 ± 0.01a 3.52 ± 0.01a 3.51 ± 0.01a Values are expressed as mean ± standard deviation of triplicates. Note: All similar lower case letters within a column show means that are not significantly different (p > 0.05). Table 12. Effect of varied inoculum size on total soluble sugar ( °Brix) of wort during fermentation by S. cerevisiae.
Inoculum size
(cells/ml)Fermentation period (h) 0 24 48 72 1.24 × 10⁸ 15.80 ± 0.00 10.47 ± 0.09c 7.17 ± 0.01d 6.30 ± 0.06b 2.48 × 10⁸ 15.80 ± 0.00 10.70 ± 0.06b 7.20 ± 0.12d 6.73 ± 0.07b 3.72 × 10⁸ 15.80 ± 0.00 10.77 ± 0.09b 7.43 ± 0.09c 6.67 ± 0.09b 4.96 × 10⁸ 15.80 ± 0.00 10.90 ± 0.06b 7.63 ± 0.15b 6.80 ± 0.06b 6.20 × 10⁸ 15.80 ± 0.00 11.53 ± 0.03a 7.77 ± 0.09b 6.80 ± 0.00b 7.44 × 10⁸ 15.80 ± 0.00 11.60 ± 0.06a 8.07 ± 0.07a 6.97 ± 0.12a Values are expressed as mean ± standard deviation of triplicates. Note: All similar lower case letters within a column show means that are not significantly different (p > 0.05). Table 13. Effect of varied inoculum size on specific gravity of wort during fermentation by S. cerevisiae.
Inoculum size
(cells/ml)Fermentation period (h) 0 24 48 72 1.24 × 10⁸ 1.07 ± 0.00 1.04 ± 0.00b 1.03 ± 0.00b 1.02 ± 0.01c 2.48 × 10⁸ 1.07 ± 0.00 1.04 ± 0.00b 1.03 ± 0.00b 1.03 ± 0.00b 3.72 × 10⁸ 1.07 ± 0.00 1.04 ± 0.00b 1.03 ± 0.00b 1.03 ± 0.00b 4.96 × 10⁸ 1.07 ± 0.00 1.05 ± 0.00a 1.03 ± 0.00b 1.03 ± 0.00b 6.20 × 10⁸ 1.07 ± 0.00 1.05 ± 0.00a 1.03 ± 0.00b 1.03 ± 0.00b 7.44 × 10⁸ 1.07 ± 0.00 1.05 ± 0.00a 1.04 ± 0.00a 1.04 ± 0.00a Values are expressed as mean ± standard deviation of triplicates. Note: All similar lower case letters within a column show means that are not significantly different (p > 0.05). Table 14. Effect of varied inoculum size on titratable acidity (%) of wort during fermentation by S. cerevisiae.
Inoculum size
(cells/ml)Fermentation period (h) 0 24 48 72 1.24 × 10⁸ 2.86 ± 0.01a 3.81 ± 0.01a 3.90 ± 0.02a 4.18 ± 0.01a 2.48 × 10⁸ 2.82 ± 0.01a 3.69 ± 0.01b 3.87 ± 0.01a 4.11 ± 0.01a 3.72 × 10⁸ 2.71 ± 0.00c 3.64 ± 0.01b 3.78 ± 0.01a 3.91 ± 0.01b 4.96 × 10⁸ 2.56 ± 0.01d 3.61 ± 0.01b 3.74 ± 0.01a 3.79 ± 0.01b 6.20 × 10⁸ 2.50 ± 0.11d 3.49 ± 0.01c 3.64 ± 0.01b 3.74 ± 0.01b 7.44 × 10⁸ 1.88 ± 0.01a 3.42 ± 0.01c 3.52 ± 0.02b 3.66 ± 0.01b Values are expressed as mean ± standard deviation of triplicates. Note: All similar lower case letters within a column show means that are not significantly different (p > 0.05). Table 15. Effect of varied inoculum size on alcohol content (%) of wort during fermentation by S. cerevisiae.
Inoculum size
(cells/ml)Fermentation period (h) 0 24 48 72 1.24 × 10⁸ 0.00 ± 0.00 2.74 ± 0.01a 3.73 ± 0.01a 4.60 ± 0.01a 2.48 × 10⁸ 0.00 ± 0.00 2.39 ± 0.01b 3.43 ± 0.02b 4.53 ± 0.01a 3.72 × 10⁸ 0.00 ± 0.00 2.51 ± 0.01b 3.27 ± 0.02b 4.10 ± 0.06b 4.96 × 10⁸ 0.00 ± 0.00 2.33 ± 0.01b 3.18 ± 0.02b 3.88 ± 0.01c 6.20 × 10⁸ 0.00 ± 0.00 2.45 ± 0.01b 3.83 ± 0.01a 3.29 ± 0.01c 7.44 × 10⁸ 0.00 ± 0.00 2.48 ± 0.01b 3.22 ± 0.02b 3.12 ± 0.01c Values are expressed as mean ± standard deviation of triplicates. Note: All similar lower case letters within a column show means that are not significantly different (p > 0.05). -
From the results of the study, Saccharomyces cerevisiae strain B05 displayed a remarkable ability to ferment sugars present in sorghum wort under varying conditions with the results obtained. Ammonium sulfate gave the highest amount of alcohol after the fermentation period and was chosen as the best nitrogen source. The pH for optimum yeast performance was 5.50 based on the alcoholic content while an inoculum size of 1.24 × 10⁸ cells/ml was chosen as the required size for optimum performance based on the amount of alcohol generated. Under these optimal conditions, the yeast strain Saccharomyces cerevisiae strain B05 could be used as a veritable tool for fermentation of sorghum worts to obtain maximum yield. However, more research still needs to be carried out under fermentation conditions to further study the mechanism of the yeast strain in worts and other substrates especially if it is to be employed for domestic and industrial applications.
-
The authors confirm contribution to the paper as follows: study conception and design: Akpoghelie PO, Edo GI, Kasar KA, Zainulabdeen K, Yousif E, Mohammed AA, Jikah AN, Ezekiel GO, Owheruo JO, Ugbune U, Umar H, Ekokotu HA, Oghroro EEA, Onyibe PN, Ekpekpo LD, Isoje EF, Agbo JJ; data collection, data analysis and draft manuscript preparation: Akpoghelie PO, Edo GI; study spervision, data analysis, interpretation, and critical revisions: Edo GI, Yousif E. All authors reviewed the results and approved the final version of the manuscript.
-
The datasets generated during and/or analyzed during the current study are available from the corresponding author on reasonable request.
-
The authors declare that they have no conflict of interest.
- Copyright: © 2024 by the author(s). Published by Maximum Academic Press on behalf of Nanjing Agricultural University. This article is an open access article distributed under Creative Commons Attribution License (CC BY 4.0), visit https://creativecommons.org/licenses/by/4.0/.
-
About this article
Cite this article
Akpoghelie PO, Edo GI, Kasar KA, Zainulabdeen K, Yousif E, et al. 2024. Impact of different nitrogen sources, initial pH and varying inoculum size on the fermentation potential of Saccharomyces cerevisiae on wort obtained from sorghum substrate. Food Materials Research 4: e021 doi: 10.48130/fmr-0024-0012 

Impact of different nitrogen sources, initial pH and varying inoculum size on the fermentation potential of Saccharomyces cerevisiae on wort obtained from sorghum substrate
- Received: 23 March 2024
- Revised: 13 May 2024
- Accepted: 13 June 2024
- Published online: 12 August 2024
Abstract: The influence of different nitrogen sources, initial pH, and varied inoculum size on the fermentation capacity of Saccharomyces cerevisiae on sorghum wort substrate was investigated. The parameters analyzed included ethanol concentration, pH, specific gravity, and total soluble sugars after 72 h fermentation period using standard methods such as specific gravity (bottle) method, refractometer method, and pH meter. Four different nitrogen sources which included urea, diammonium phosphate, ammonium sulfate, and ammonium nitrate, were tested individually using two different concentrations of 0.025% w/v, and 0.05% w/v, to study their influence on the fermentation capacity of the yeast strain. The pH and sugars decreased while the alcohol concentration and acidity increased during the fermentation period (p < 0.05). Ammonium sulfate resulted in the highest alcohol and acidity yield (4.47% ± 0.02%, and 3.65% ± 0.03% respectively) at 0.5% w/v after 72 h fermentation period. The yeast strain performed best at an initial pH of 5.5 and gave an optimum alcohol and acidity yield (4.43% ± 0.01%, and 3.88% ± 0.01% respectively) while inoculum size of 1.24 × 10⁸ cells/ml produced the highest alcohol and acidity yield (4.60% ± 0.01%, and 4.18% ± 0.01% respectively) after 72 h. Saccharomyces cerevisiae is a promising candidate for the fermentation of sorghum wort under optimized conditions of nitrogen, initial pH, and yeast cell number.
-
Key words:
- Nitrogen /
- pH /
- Inoculum sizes /
- Alcohol /
- Fermentation /
- Sorghum wort.