


-
Processed cheese product (PCP) is manufactured in various forms such as loaves, slices, shreds, or spreads. Code of Federal Regulations (CFR) in the USA has described five major categories of processed cheese, namely pasteurized processed cheese, pasteurized processed cheese food, pasteurized processed cheese spread, pasteurized blended cheese, and processed cheese analogs, which differ in fat, moisture, pH, and ingredients that can be used[1−4]. PCP is an undefined category of processed cheese (PC) in the USA[1] and can further be subcategorized into substitute or imitation cheese[2]. Ingredients such as milk protein concentrate (MPC), micellar casein concentrate (MCC), and rennet casein, which are not legally allowed under CFR, are utilized in the formulation[4]. Since the PCP formulation can use various ingredients not legally allowed under the CFR, many companies prefer to tailor the functionality of PCP by using a combination of non-cheese ingredients. However, with the inclusion of non-cheese dairy ingredients, the manufacturing and chemical reactions occurring in PCP remain the same. Depending upon the type of PCP to be manufactured, the type of ingredients, emulsifying salt or protein content change, provide the specific and required functionality to the PCP. Most PCPs are manufactured using trisodium citrate (TSC), disodium phosphate (DSP), or a combination of both. TSC is primarily used in slice or slice-on-slice (SoS) applications in which the PC is cooled on a chill belt[3, 4] as it provides a desirable firmer texture, better flexibility, gloss, and reduced adhesiveness as compared to DSP. The TSC when used in PCP shows no oiling off and has better melting properties compared to other emulsifying salts[5].
Milk proteins are essential for all structural networks and textural properties of almost all dairy products and play a critical role in their functional properties. Heterogeneous milk proteins can be fractionated into individual fractions using various membrane separation techniques. However, traditionally cheese or rennet casein powder made using chymosin has been a primary source of casein or intact casein used in PCPs. From a product and technological point of view, caseins are by far the most essential and valuable component of milk[6]. Most of the functional properties of the casein micelle depend on its surface properties[7, 8] and molecular structure[9]. Standard processing and drying techniques do not change the casein micellar structure and preserve the native properties of the micelles[8].
Milk protein concentrate (MPC) is produced industrially using ultrafiltration. This process concentrates milk proteins (casein and serum proteins) in the same ratio as found in the milk from which it is manufactured[10]. However, lactose is removed by adding diafiltration water during processing to increase the protein content. Hence MPC has the advantage of low lactose and a high amount of soluble milk proteins. However, in certain products, such as high heat stable products, some emulsions, etc., the amount of MPC that can be utilized in a formulation is limited by the level of serum (whey) protein present in MPC. Using MPC in these formulations can result in defects, including precipitation and flocculation, resulting in undesirable product characteristics such as coagulation, poor heat stability, etc. In some applications, protein ingredients with a reduced level of serum proteins may be preferred.
The level of serum (whey) protein in skimmed milk can be reduced using microfiltration (MF) to produce micellar casein concentrate (MCC)[10−12] with altered casein-to-total nitrogen ratio. However, MPC and MCC alone cannot deliver the critical functional properties required in products such as high heat stability, emulsions, yogurt, and PCPs. The reason is that the membrane system separation involves fractionation through physical means and produces a soluble protein product; hence, the casein and serum proteins are in the micellar and native state. The casein micelles are intact, and the κ-CN, which provides steric stability to the casein micelles, still has the glyco-macro peptide (GMP) attached, providing a negative charge on its surface. This negative charge interferes with network formation in the presence of emulsifying salts and impacts product functionality[13−17].
One of the methods used to alter the functional and structural properties of milk proteins at the molecular level is by crosslinking proteins with enzymes, particularly the transglutaminase (TGase, EC 2.3.2.13) enzyme. It is used in many foods to crosslink proteins to enhance the functional properties of products. The protein crosslinking can change food's chemical, structural, textural, functional, and nutritional characteristics. Crosslinking is described as the covalent bonding of a protein to itself or other proteins in a system[13−16, 18,19]. Crosslinking of proteins may help change or improve food proteins' solubility, foaming, rheological, and emulsifying characteristics[19]. The cross-linking can be intramolecular (between polypeptide chains within a protein) or intermolecular (between proteins)[13−16, 20] or among CNs and whey proteins or any different proteins[13−17]. The application and utilization of TGase and its basics have been reviewed[19−28].
Using a crosslinking enzyme can potentially modify the physical properties of casein, which may prevent the detrimental properties of κ-CN that are typically observed when MPC or MCC is used. TGase catalyzes the acyl transfer reaction between protein-bound glutaminyl residues and primary amines[29] and forms a covalent bond between a free amino group (i.e., lysine) and peptide-bound glutamine. It forms a framework of additional iso-peptide bonds that impact the food's functional properties, such as gelation capability, viscosity, or water binding capacity[29, 30]. Caseins have a flexible open structure, and they are an excellent substrate for TGase[31, 32] as compared to undenatured globular whey proteins[31, 33]. The high susceptibility of κ-CN towards crosslinking is likely due to its peripheral position on the CN micelles, and the high susceptibility of β-CN is due to its ease of accessibility in the micelle structure and dynamic nature[34, 35]. However, in the absence of amine substrates, TGase is capable of catalyzing the deamidation of glutamine residues[14, 24, 34, 36, 37]. The deamidation reaction can cause partial hydrolysis of proteins at high TGase levels[14, 24, 36−38]. The authors used TGase in MPC and MCC to assess the changes in functionality[16] and theorized that it is possible to use transglutaminase to create a casein-based protein network from the native casein micelles in MPC or MCC that has improved functionality in various products[13−17].
Changes in functionality after TGase addition in skimmed milk or sodium caseinate solutions have been reported. Changes in heat and alcohol stability[16, 35, 39−46], and emulsifying capacity[16, 34, 35, 39, 46−48] have been reported in milk and sodium caseinate solutions after TGase addition. Changes in the properties of yogurt, including water holding capacity, syneresis, texture, and firmness viscosity after TGase-added milk was used for yogurt manufacture, have been reported by various researchers[16, 23, 49−55]. TGase treatment has been used in fresh cheeses[56], PCP[13, 17], and imitation mozzarella cheeses[14, 15, 57].
Conflicting reports on the impact of TGase on casein micelle structure and functionality may be related to the differing conditions (i.e. temperature, TGase concentration, micelle concentration, pH) utilized during the TGase treatments. Recently, in our laboratory PCP loaf formulation using DSP was manufactured, and changes in the functionality of PCP, especially melted characteristics, were observed[17]. Since the market for SoS is also much bigger, our experiment was planned to use TGase-treated MPC and MCC in a SoS formulation and see the impacts on melted and unmelted characteristics of PCP.
-
Three replicates of MCC and MPC were produced using MF and UF, respectively, from three different lots of milk. Each lot of retentate was divided into three equal portions, and each one was subjected to TGase treatment which included: control (C, no TGase), low (L, 0.3 U/g protein), and high (H, 3.0 U/g protein). TGase levels were selected to cover wide cross-linking possibilities and how this will impact the functionality of PCP, compared to our previous study[13], which used seven TGase units per gram of protein. Each treated retentate was spray-dried separately to obtain powders. These individual powder samples obtained were used as ingredients in a PCP SoS formulation manufactured in a rapid visco analyzer (RVA). A 2 x 3 factorial design experiment with two product types (MPC and MCC) and three TGase enzyme levels, namely control (C), low (L), and high (H), were used. Details of the experimental design are given in Fig. 1.
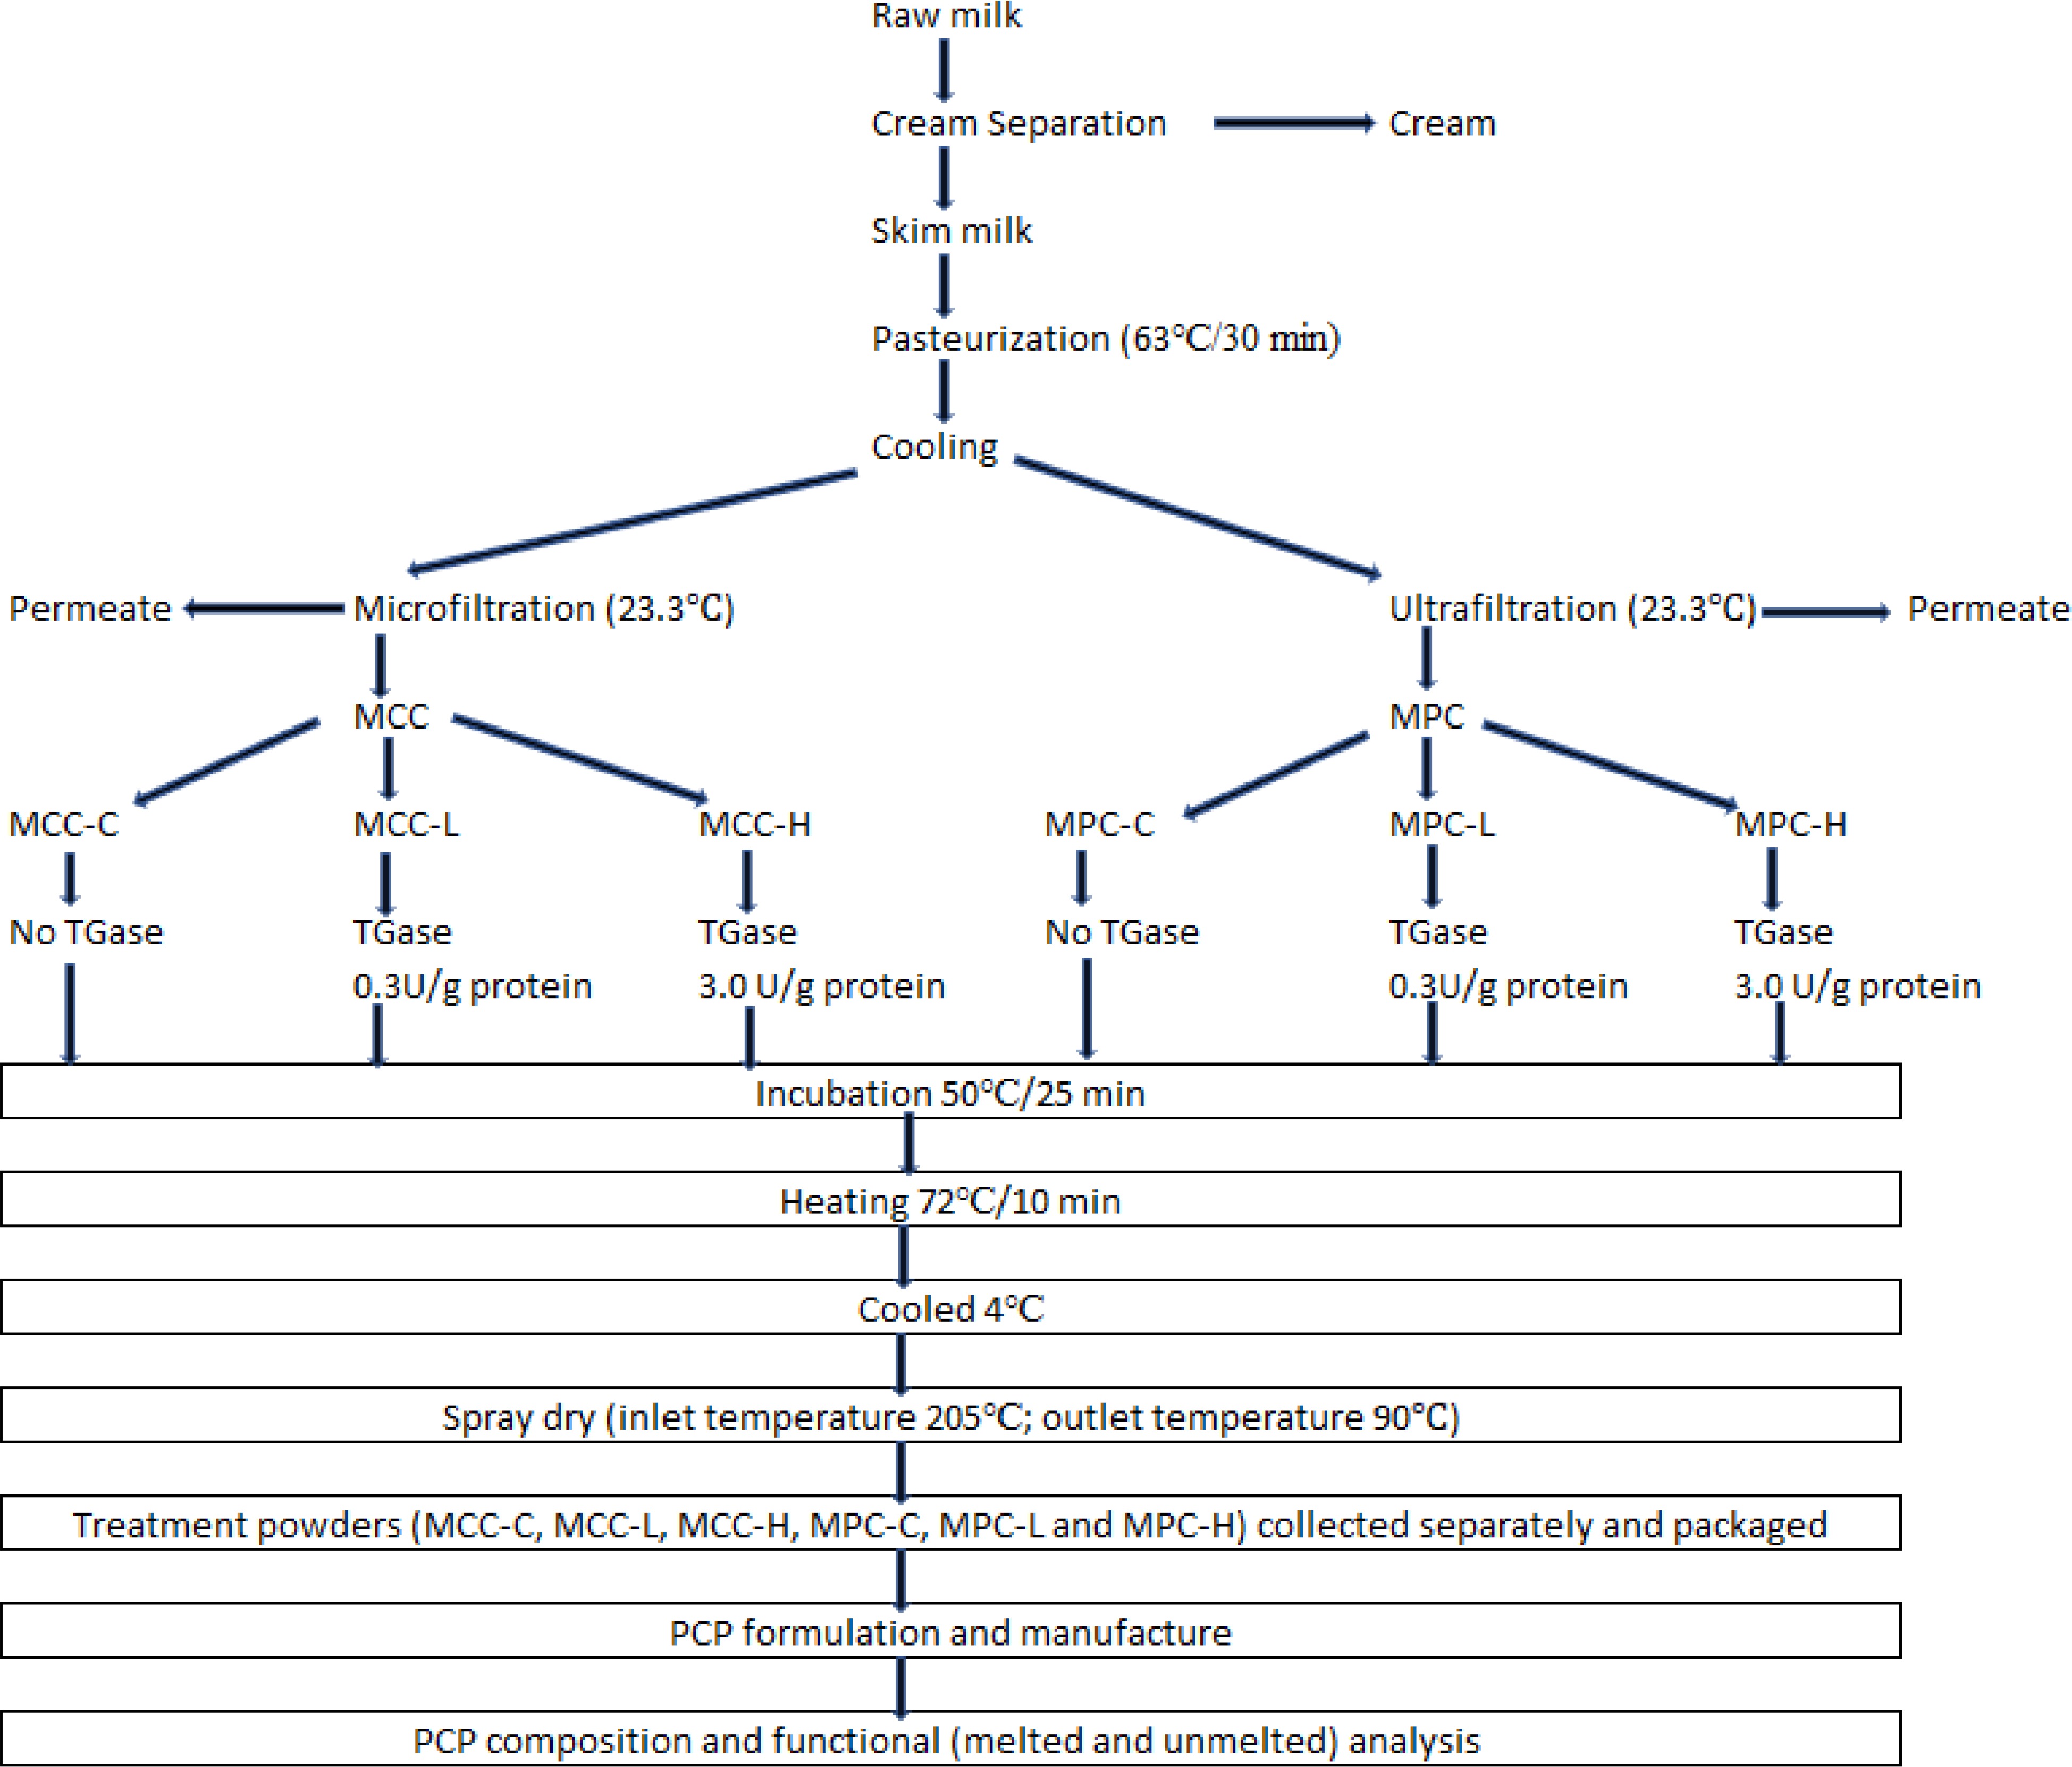
Figure 1.
Experimental design for the manufacture of treatment powders. Processed cheese product (slice) treatment: MCC-C = micellar casein concentrate powder, control; MCC-L = micellar casein concentrate powder, low TGase level; MCC-H = micellar casein concentrate powder, high TGase level; MPC-C = milk protein concentrate powder, control; MPC-L = milk protein concentrate powder, low TGase level; MPC-H = milk protein concentrate powder, high TGase level.
Manufacture of TGase-treated MCC and MPC powders
-
Raw milk received was cold separated (6 °C) at the SDSU Dairy Pilot plant, and the skimmed milk obtained was batch pasteurized (63 °C for 30 min) and cooled to 4 °C. The pasteurized skimmed milk (SM) was divided into two equal lots. Each SM lot was used for pilot-scale production of MCC and MPC using spiral wound membranes in an MF/UF unit with two single long housings arranged in parallel. Three replicates of MCC and MPC were produced using three different lots of milk. MF (0.5 µ polyvinylede fluoride) and UF (10 kD polyether sulfone spiral wound membranes) were procured from Dominick Hunter Filtration Divison – N.A (Parker Hannifin Corporation, Oxnard, CA, USA). The MF and UF operations were performed at 23.3 °C with a final retentate volume of 45.4 L resulting in a volume reduction ratio (VRR) of approximately 5 (on a feed volume basis). The MF was performed at a TMP of 86.2 kPa with DF water added at six different intervals totaling 100% (on a feed volume basis) to control the retentate viscosity and maximize serum protein removal. The UF was performed at 276 kPa TMP with DF water added at four different intervals totaling 40% (on a feed volume basis) to control the retentate viscosity and remove soluble solutes. Details of the process are discussed in our previous paper[10].
After dividing each lot of MCC and MPC retentate into three equal portions, they were treated with TGase, (Activa TI, Ajinomoto Food Ingredients LLC, Chicago, IL, USA, activity of 100 units/g). For each TGase treatment, the required quantity TGase enzyme was weighed and mixed with 100 mL of distilled water, with details of the procedure given in our previous paper[14]. After enzyme addition to the retentate and thorough mixing, each treatment was incubated at 50 °C for 25 min. The retentates were heated to 72 °C for 10 min to inactivate the enzyme and then cooled to 4 °C. All retentates were then spray dried (ASO 412E, Niro Inc., Columbia, MD, USA) with inlet air temperature maintained at 205 °C and outlet temperature maintained at 90 °C. Powders were collected in plastic bags (Associated Bag Company, Milwaukee, WI, USA) and stored at room temperature until further analysis was completed.
Processed cheese product formulation
-
The MPC and MCC powders were used as ingredients in SoS PCP formulations. The PCP formulations for all the replicates were developed and balanced using Techwizard (an Excel-based formulation software program by Owl Software, Columbia, MO, USA) to have 20.0% total fat, 48.0% moisture, 1.26% salt, and 17.5% protein with the treatment powders utilized contributing 15.0% protein to the formulation. The other ingredients included extra sharp premium natural aged cheddar cheese (Cabot Creamery Cooperative, Cabot, VT, USA), enzyme-modified cheese (Bongards' Creameries, Bongard, MN, USA), salted butter (Great Value, Wal-Mart Stores, Inc, Bentonville, AR, USA), trisodium citrate (KIC Chemical Inc., New Paltz, NY, USA), dibasic sodium phosphate (Rhodia Inc., Cranbury, NJ, USA), sorbic acid (KIC chemical Inc, New Peltz, NY, USA), deproteinized whey powder (Agropur Inc., Le Sueur, MN, USA), lactic acid 85% w/w (Fisher Scientific, Fair Lawn, NJ, USA), and iodized salt (Great Value, Wal-Mart Stores, Inc, Bentonville, AR, USA). The cheddar cheese had a composition of fat (31.5%), moisture (42.0%), lactose (0.8%), salt (1.8%), and total protein (25.01% with intact CN 16.47% and 4.6 pH soluble N 8.54%). The final selected detailed ingredient blend formulations are shown in Table 1.
Table 1. Ingredient blend formulations utilized to manufacture the six Process cheese product (slice) treatment.1
Ingredient MCC-C MCC-L MCC-H MPC-C MPC-L MPC-H % (Wt./Wt.) Water 40.63 40.55 40.62 40.50 40.45 40.72 Salt 1.25 1.25 1.25 1.25 1.25 1.25 Tri sodium citrate 2.00 2.00 2.00 2.00 2.00 2.00 Whey deproteinized 6.98 7.07 6.86 6.02 6.08 5.75 Lactic acid 1.00 1.00 1.00 1.00 1.00 1.00 Butter (salted) 21.49 21.48 21.55 21.66 21.64 21.65 Sodium phosphate, Dibasic 0.50 0.50 0.50 0.50 0.50 0.50 EMC paste 0.75 0.75 0.75 0.75 0.75 0.75 Sorbic acid 0.20 0.20 0.20 0.20 0.20 0.20 Cheddar cheese 5.00 5.00 5.00 5.00 5.00 5.00 Treatment powder 20.21 20.20 20.27 21.13 21.12 21.18 Total 100.00 100.00 100.00 100.00 100.00 100.00 1 Processed cheese product (slice) treatment: MCC-C = micellar casein concentrate powder, control; MCC-L = micellar casein concentrate powder, low TGase level; MCC-H = micellar casein concentrate powder, high TGase level; MPC-C = milk protein concentrate powder, control; MPC-L = milk protein concentrate powder, low TGase level; MPC-H = milk protein concentrate powder, high TGase level. Processed cheese product manufacture
-
Each formulation was used to prepare a pre-blend (200 g) by weighing and mixing all the ingredients (except disodium phosphate) in a mixer (Kitchen Aid, St. Joseph, MI, USA) for 30 min (Table 1). Each formulation was then manufactured in a Rapid Visco Analyzer (RVA-4, Newport Scientific, New South Wales, Australia)[13, 17]. The required amount of disodium phosphate was weighed in each RVA canister (Perten Instruments Inc, NA, Springfield, IL, USA) along with 15 g of the pre-blend and 0.5 g of water. The blend of ingredients was mixed at 1,000 rpm at 95 °C for 2 min and then mixed at 160 rpm for 1 min. Twelve batches of PCP were produced from each pre-blend, and the continuous viscosity profile obtained from each batch was collected. The apparent viscosity at the end of manufacture (VAM) was measured as the average of the last five points on the viscosity profile. The 12 batches were divided into various subsamples for analysis (four for penetration hardness, three for DSR, and the remainder for other analysis). For the penetration test, molten PCP immediately after manufacture in RVA was poured into a plastic X-plate (100 × 15 mm, Fisherbrand, Fisher Scientific, Pittsburgh, PA, USA) and cooled at 4 °C until further analysis was completed[17]. For DSR analysis and the modified Schreiber melt test, the PCP samples were poured into plastic molds (30 mm diameter). They were cooled to room temperature and then transferred to 4 °C until further analysis was completed.
Chemical analysis of PCP
-
The pH of each sample was measured in duplicate with a pH meter (Corning pH meter 340, Corning Incorporated, NY, USA) with an Accumet® - gel-filled glass electrode with a spear tip (Fisher Scientific, NJ, USA). The proximate analysis of the PCP samples, including moisture, fat, and total protein, was carried out using standard methods[58].
Functional analysis (unmelted textural properties)
-
The penetration hardness test was performed using a TA.XT2 Texture Analyzer (Texture Technologies Corp., Scarsdale, NY, USA; Stable Microsystems, Godalming, UK) as described by Salunke et al.[17]. In this test, the sample (15 g and 10 mm thick) of PCP in an X-plate was placed directly under the probe, and each quarter of the plastic X-plate served as a replicate. The samples were tempered to 15 °C, and a uniaxial penetration was performed with a TA-8, 6.35 mm diameter stainless steel ball, and a penetration depth of 3 mm with a crosshead speed of 0.8 mm/s.
Functional analysis (melted textural properties)
Dynamic stress rheology (DSR)
-
For DSR analysis, the PCP samples were removed from the plastic mold, and the DSR test was carried out[15]. PCP samples were prepared by cutting a thin slice (2.0 mm) using a food slicer (Model 1042W, The Rival Co. Kansas City, MO, USA) and wire cutter. Cylindrical cheese samples 28.3 mm in diameter were cut with a cork borer. The cheese samples were tempered to 20 °C prior to DSR analysis. DSR analysis was performed using a rheometer (Viscoanlyser, ATS Rheosystems, Rheologica Instruments Inc., NJ, USA) with parallel plate geometry of 30 mm diameter. The maximum stress limit for the linear viscoelastic region was obtained as 400 Pa from the stress sweep experiment. Subsequently, a temperature sweep was performed using the same rheometer (parallel plate geometry) at 1.5 Hz frequency and constant stress of 400 Pa (linear viscoelastic region). The exposed cheese surface was coated with vegetable oil (Crisco pure vegetable oil, The J M Smucker Co., OH, USA) to minimize drying during the temperature sweep. A temperature ramp from 20 to 90 °C at a 1 °C/min rate was completed to measure the rheological properties. Each sample's measurements were taken in triplicate and included the elastic modulus (G′) and viscous modulus (G″). The transition temperature (TT) and tangent angle (tan δ) were calculated. The TT was defined as the lowest temperature during the temperature gradient experiment, where tan δ equaled 1 (G′ = G″).
Modified Schreiber melt test
-
The meltability of each PCP sample was measured using a modified Schreiber test[15]. Each PCP sample was cut into a 28.5 mm diameter and 7 mm height cylinder and tempered to 20 °C for 10 min prior to analyses. Four samples from each treatment were placed on four 0.95 mm thick aluminum plates (100 mm × 100 mm) and immediately transferred to a forced draft oven (Fisher Scientific) at 90 °C. After 7 min, the plates with the melted cheese were cooled to room temperature. The diameter of the melted cheese was measured using a Vernier caliper at four locations and the average recorded. Meltability of the PCP was reported as the change in the area of the melted cheese in millimeters squared relative to the original area.
Statistical analysis
-
Collected data was analyzed using the Proc GLM factorial analysis of SAS (SAS Institute Inc., Cary, NC, USA) with a Type I error rate (α) of 0.05 to test for significant differences among treatments. This study utilized a 2 × 3 factorial design with two products (MCC or MPC) and three TGase enzyme levels (control, low and high). In addition, the product x enzyme level interaction was also tested. Mean value comparisons were made at a 0.05 level of significance using least significance difference (LSD), and results were considered significant at p < 0.05.
-
Mean PCP composition, including moisture, fat, protein, and pH of the six PCP treatments, are shown in Table 2. Minor differences were observed in moisture, fat, protein, and pH, however, the differences were not statistically significant (p > 0.05). These results were expected because all the replicates used in this study were balanced for moisture, fat, salt, protein, and lactose using various ingredients mentioned in Table 1.
Table 2. Mean (n = 3) composition of Processed cheese product (slice) treatments.1
Parameters MCC-C MCC-L MCC-H MPC-C MPC-L MPC-H pH 5.70 5.64 5.69 5.70 5.74 5.66 Fat (%) 19.93 19.94 19.97 19.99 19.95 19.97 Protein (%) 17.52 17.49 17.49 17.49 17.51 17.55 Moisture (%) 47.95 47.96 47.94 47.96 47.95 47.98 1 Processed cheese product (slice) treatment: MCC-C = micellar casein concentrate powder, control; MCC-L = micellar casein concentrate powder, low TGase level; MCC-H = micellar casein concentrate powder, high TGase level; MPC-C = milk protein concentrate powder, control; MPC-L = milk protein concentrate powder, low TGase level; MPC-H = milk protein concentrate powder, high TGase level. Functional properties
-
The functional properties of PCP were analyzed using an RVA for viscosity after manufacture (VAM), penetration test for penetration hardness, dynamic stress rheology (DSR) for transition temperature (TT), and Schreiber melt test for change in melt area. Mean squares and P values (in parentheses) of VAM, penetration hardness, TT, and melt area of the six PCP manufactured using MPC and MCC are shown in Table 3. There was a significant replicate effect in TPA-hardness (p < 0.05), which may have resulted from variations in manufacturing conditions among the replicates. There was a significant (p < 0.05) effect of product type and enzyme level in all PCP functional properties (VAM, melt area, TPA-hardness, and DSR-melt temperature) (Table 3). There was also a significant (p < 0.05) interaction effect of product type x enzyme level in all PCP functional properties except penetration hardness (Table 3). The product type and enzyme level significance (p < 0.05) indicates a change in all PCP functional properties. In contrast, the significance (p < 0.05) of the interaction term product type x enzyme level indicates that these changes were not linear.
Table 3. Mean squares and p values (in parentheses) of RVA viscosity, melt area, hardness, and tan delta of the PCP manufactured from treatment powders.
Factors Df RVA viscosity Change in area Hardness Tan delta Replication 2 771,444.57 (0.085) 56,935.00 (0.089) 5,511.35 (0.002)* 16.71 (0.328) Product type 1 308,265.16 (0.005)* 405,215.28 (0.0008)* 22,552.99 (<0.0001)* 317.24 (<0.0001)* Enzyme level 2 14,197,912.72 (<0.0001)* 565,898.42 (<0.0001)* 2,740.38 (0.021)* 417.53 (<0.0001)* Product type x Enzyme level 2 139,446.25 (0.022)* 262,920.46 (0.001)* 775.23 (0.239) 142.79 (0.003)* Error 10 24,246.61 18,276.87 466.97 13.37 * Statistically significant at p < 0.05. VAM
-
The apparent viscosity is continuously measured during PCP manufacture in the RVA, and the VAM can be used as a measure of cheese viscosity during manufacture. The mean values of the VAM of the six PCP are indicated in Table 4. PCP manufactured using MPC-C or MPC-L had significantly (p < 0.05) higher VAM than the MCC-C and MCC-L treatments. In both the MCC and MPC treatments, there was no significant (p < 0.05) difference in manufacturing viscosity between PCP made using the low level of TGase and control (MCC-C vs. MCC-L and MPC-C vs. MPC-L). PCP manufactured with high TGase levels (MCC-H or MPC-H) had a significantly higher (p < 0.05) VAM as compared to their respective control and low TGase treatments. However, there was no significant difference (p < 0.05) between the MPC-H and MCC-H treatments. Both products (MCC and MPC) and enzyme levels (C, L, or H) affected VAM.
Table 4. Mean (n = 3) RVA viscosity, melt area, hardness, and tan delta of the PCP manufactured from treatment powders at 3 levels (C, L, and H).
Parameter MCC-C MCC-L MCC-H MPC-C MPC-L MPC-H RVA viscosity (cP, n = 36) 728.7c ± 47.2 725.5c ± 72.5 3653.1a ± 143.3 1204.3b ± 269.8 1122.4b ± 144.7 3565.7a ± 276.9 Change in area (mm, n = 12) 1081.9a ± 203.4 708.4b ± 29.3 61.3e ± 26.7 412.0c ± 44.8 323.4cd ± 104.4 215.8d ± 241.0 Hardness (g, n = 12) 402.1b ± 33.4 456.5a ± 54.3 398.0b ± 50.4 340.7c ± 35.1 359.8c ± 21.9 343.8c ± 14.7 Tan delta (°C, n = 9) 65.97c ± 3.77 69.60b ± 3.78 90.00a ± 0.00 61.97d ± 2.94 67.99bc ± 4.88 70.42b ± 4.75 a–e Means in a row with common superscripts do not differ (p ≥ 0.05). Processed cheese product (slice) treatment: MCC-C = micellar casein concentrate powder, control; MCC-L = micellar casein concentrate powder, low TGase level; MCC-H = micellar casein concentrate powder, high TGase level; MPC-C = milk protein concentrate powder, control; MPC-L = milk protein concentrate powder, low TGase level; MPC-H = milk protein concentrate powder, high TGase level. Penetration hardness
-
The penetration hardness measures unmelted cheese firmness using a texture analyzer. The mean values of penetration hardness of the six PCP are shown in Table 4. The PCP manufactured using MCC had a significantly higher (p < 0.05) hardness than the respective MPC treatment. As the level of TGase enzyme increased, there was an increase in penetration hardness. However, PCP made from high TGase levels (MCC-H and MPC-H) showed lower penetration hardness values even though they seemed to be hard visually and physically. This may be due to the formation of tiny spherical particles and possibly because it had higher interstitial air pockets causing the penetration probe to penetrate at a lower force. In addition, MCC-H and MPC-H had higher levels of crosslinking, and the MCC-H sample also had hydrolyzed peptides[14,16]. Both products (MCC and MPC) and enzyme levels (C, L, or H) affected the firmness of the PCP.
Melt area
-
The modified Schreiber melt test measures the melt and flow (spread) behavior of PCP. The mean values of melt area (change in the area) of the six PCP are shown in Table 4. PCP manufactured using MCC-C or MCC-L had a significantly (p < 0.05) higher melt area than that of MPC-C and MPC-L. MCC-C had the highest melt area and was significantly (p < 0.05) higher than the other samples. The addition of TGase (MCC-L) significantly (p < 0.05) reduced melt area, but it still had a higher melt area than MCC-H and all MPC samples. PCP having higher meltability will have more melt area and vice-versa. At the higher TGase level, MCC-H showed very little melt and was significantly (p < 0.05) lower than MPC-H. However, melt area decreased with TGase treatment in both MPC and MCC.
Rheology
-
The rheological characteristics of PCP samples, G', G", G*, and viscosity obtained by dynamic stress rheology are shown in Figs 2 & 3. The MCC-C sample had higher G' and G" values as compared to the MPC-C sample (Fig. 2), with similar results observed for the G* and viscosity results (Fig. 3). The MCC-C being higher in casein showed lower G', G", G*, and viscosity values after 80 °C whereas MPC-C having more serum proteins melted at 70 °C. The samples with higher TGase (MCC-H and MPC-H) showed higher G', G", G*, and viscosity than other samples, indicating TGase crosslinking affected the viscoelastic properties of cheese. The samples with lower TGase (MCC-L and MPC-L) had rheological characteristics between the control and higher TGase samples.
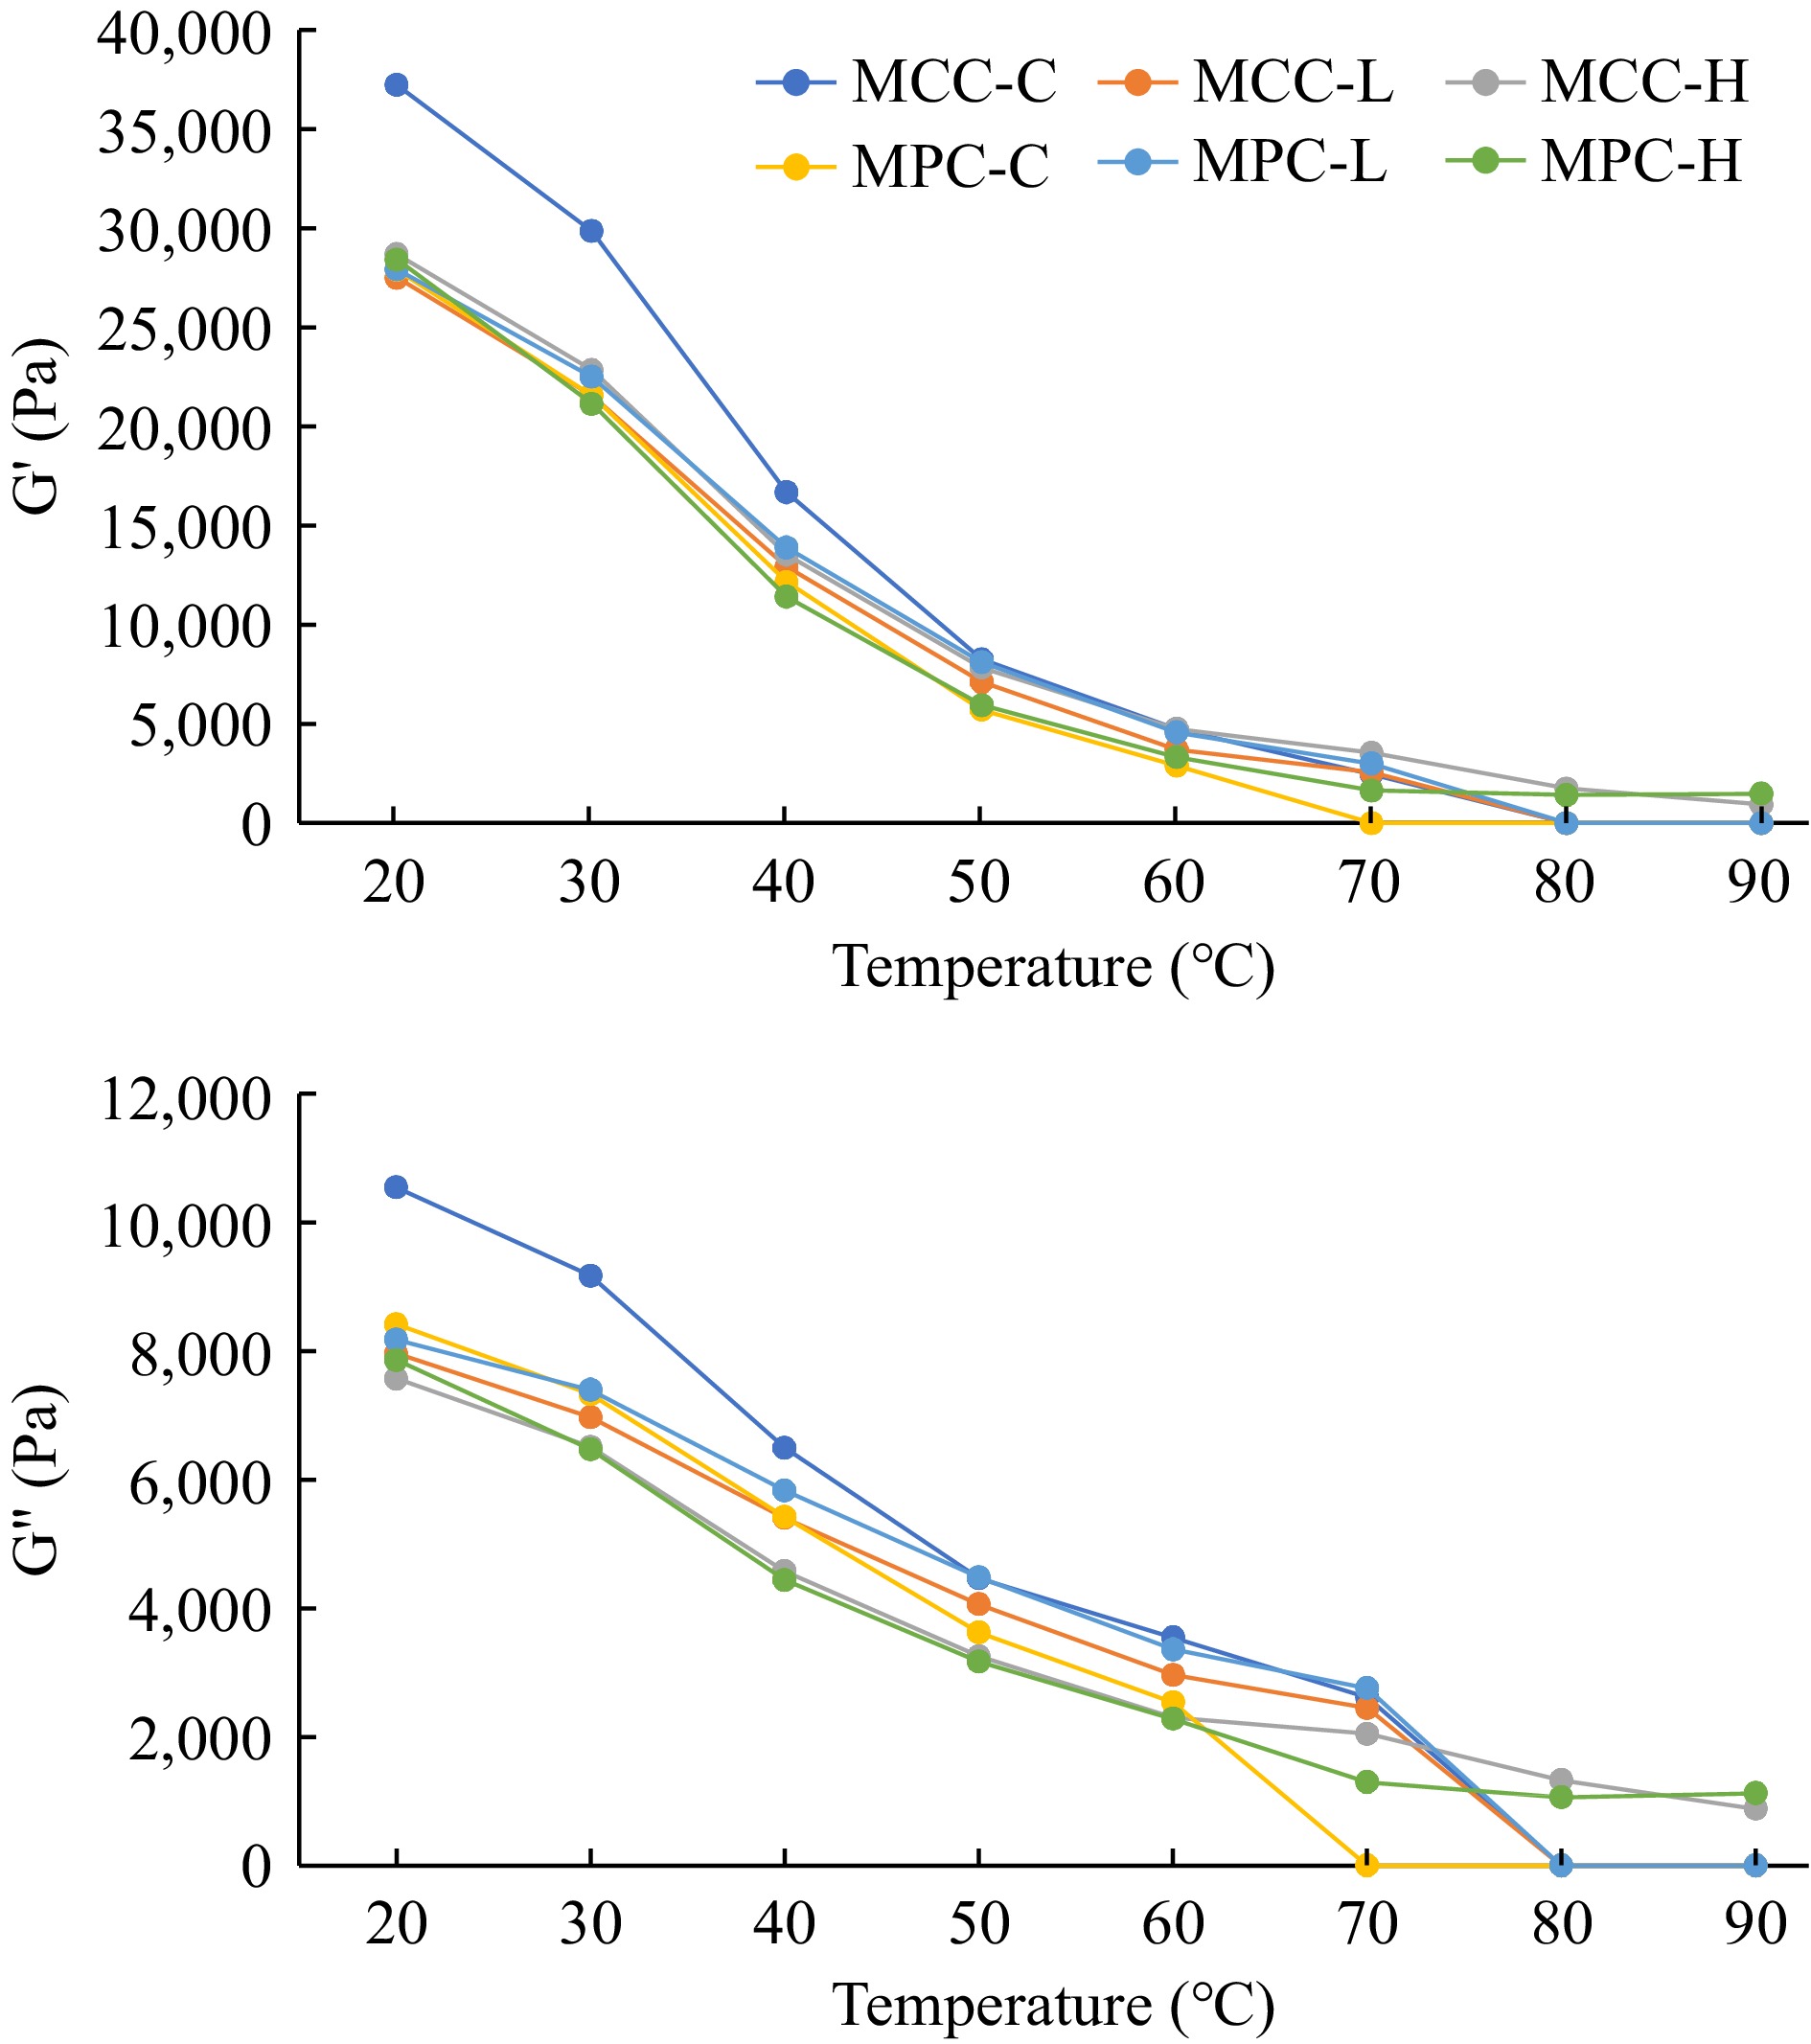
Figure 2.
Rheological characteristics of PCP (G' and G") of process cheese samples. Processed cheese product (slice) treatment: MCC-C = micellar casein concentrate powder, control; MCC-L = micellar casein concentrate powder, low TGase level; MCC-H = micellar casein concentrate powder, high TGase level; MPC-C = milk protein concentrate powder, control; MPC-L = milk protein concentrate powder, low TGase level; MPC-H = milk protein concentrate powder, high TGase level.
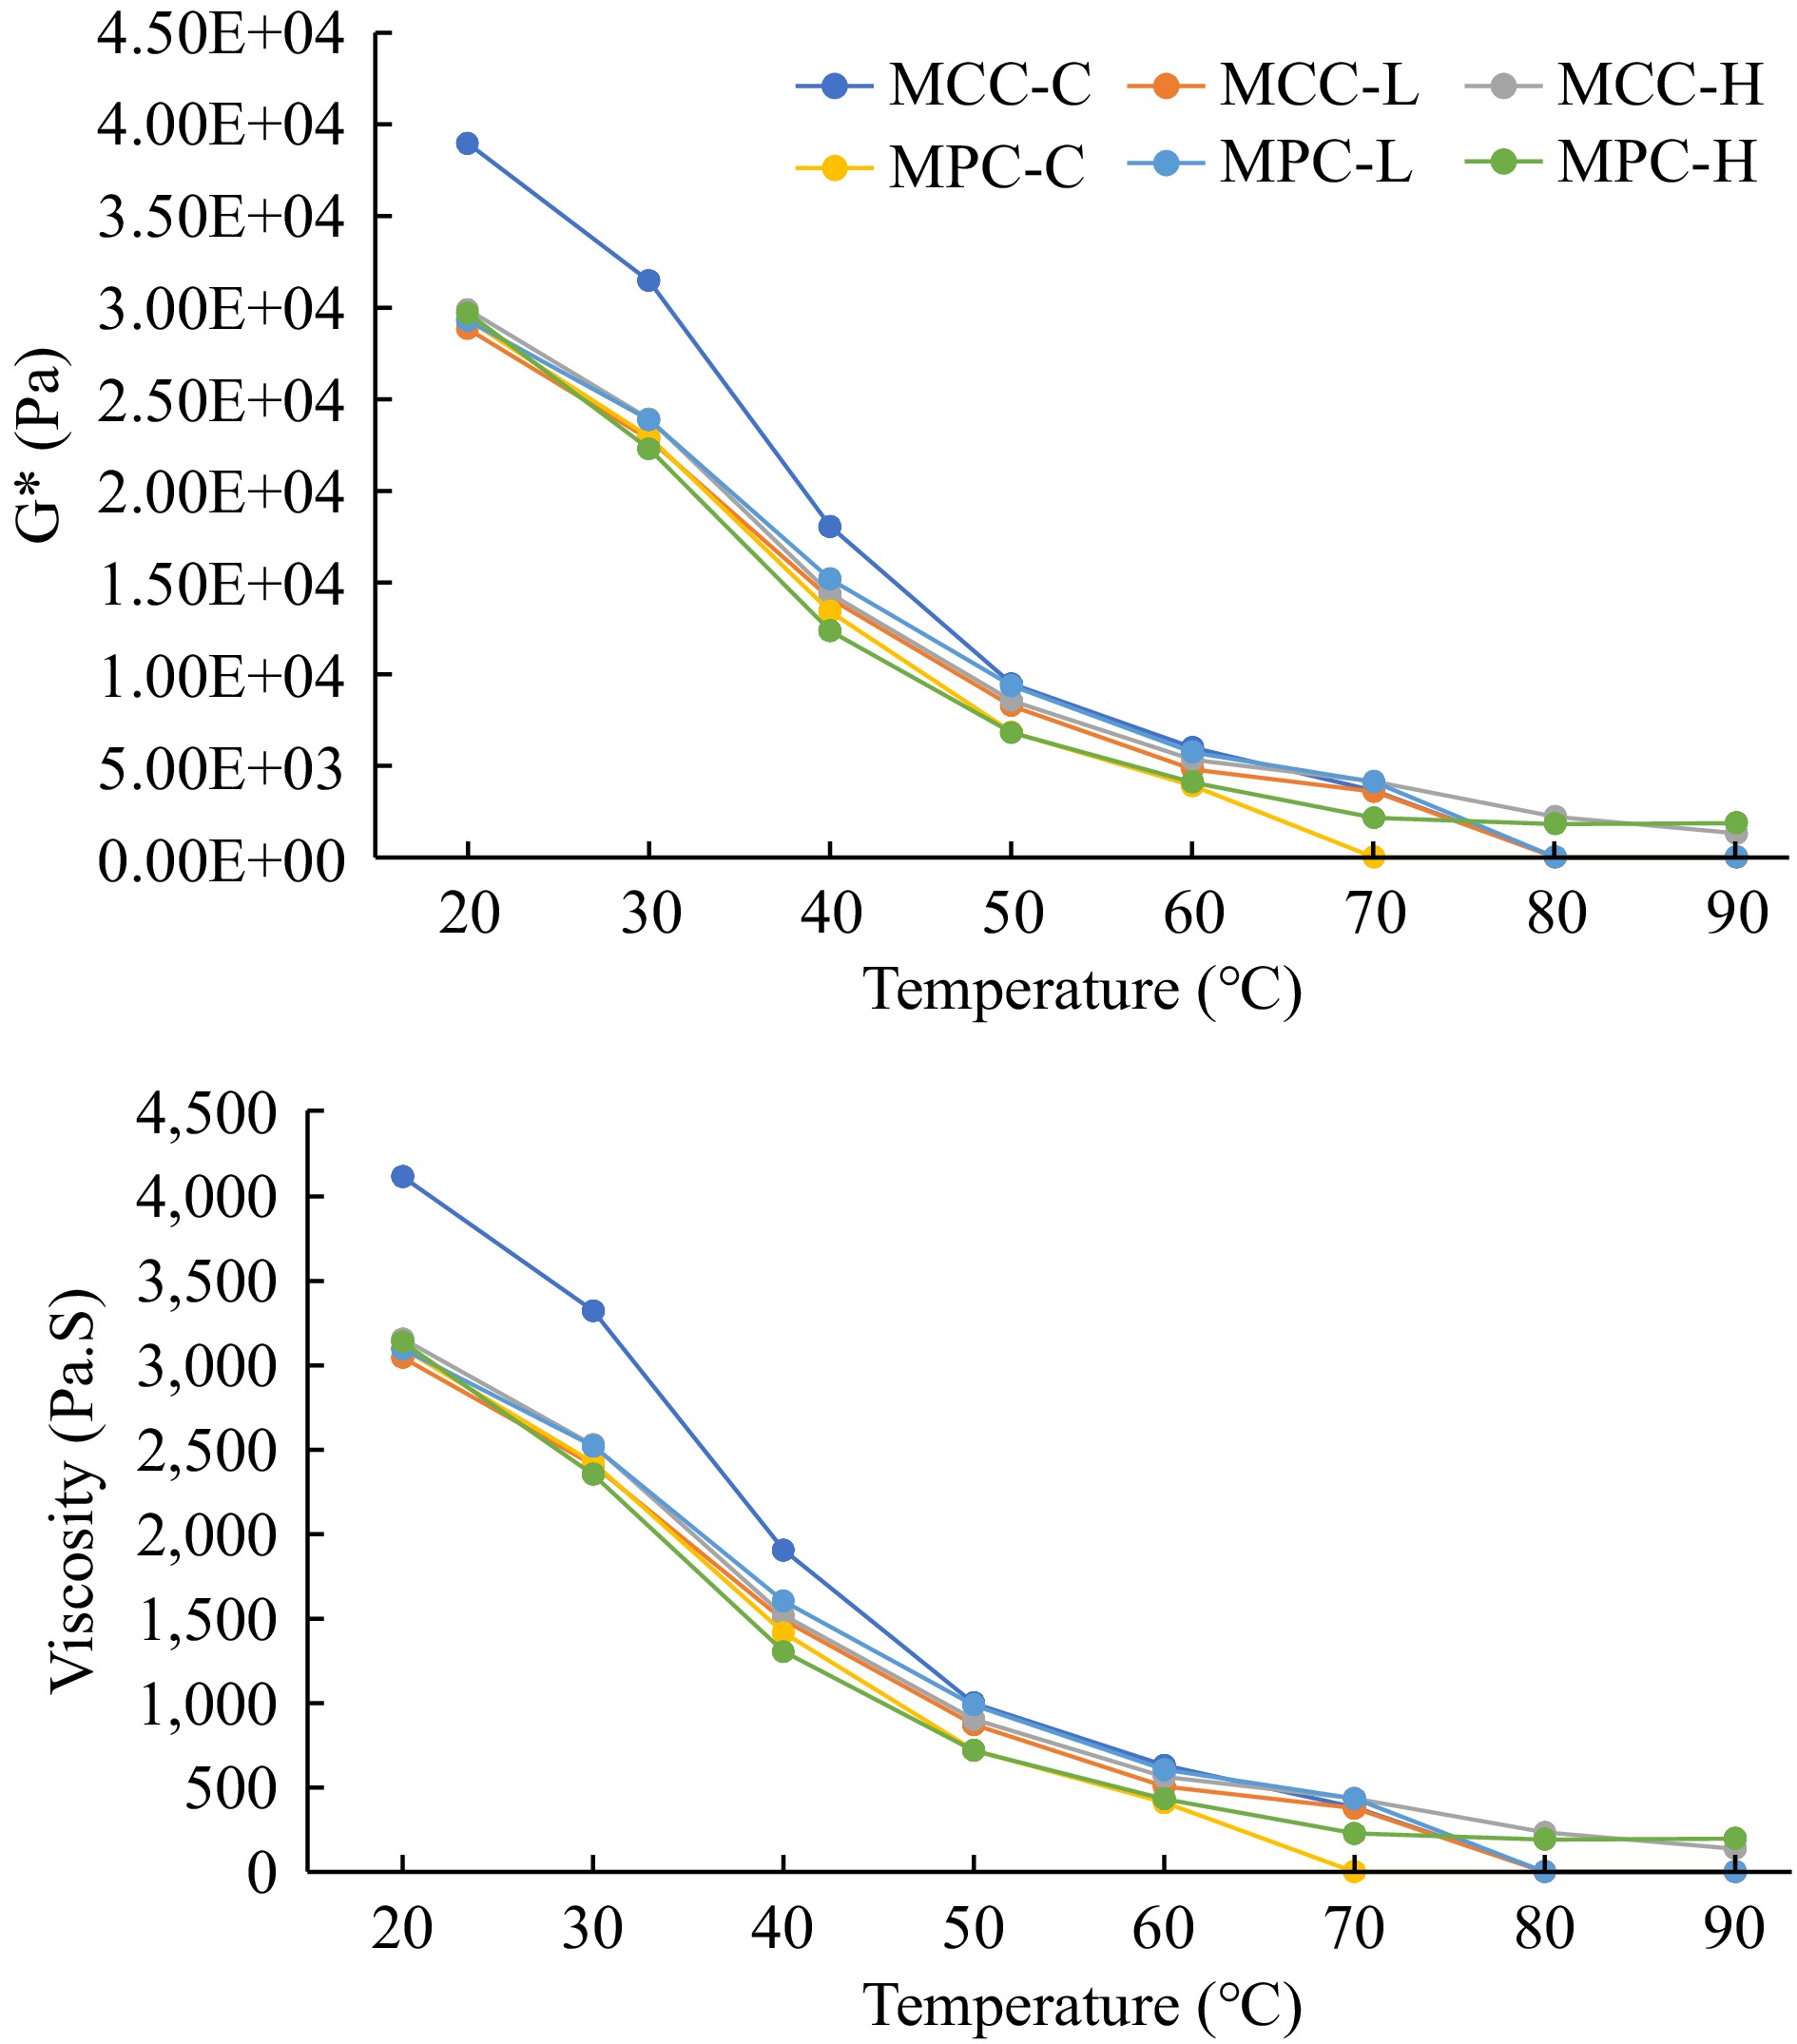
Figure 3.
Rheological characteristics of PCP (G* and viscosity) of process cheese samples. Process cheese product (slice) treatment: MCC-C = micellar casein concentrate powder, control; MCC-L = micellar casein concentrate powder, low TGase level; MCC-H = micellar casein concentrate powder, high TGase level; MPC-C = milk protein concentrate powder, control; MPC-L = milk protein concentrate powder, low TGase level; MPC-H = milk protein concentrate powder, high TGase level.
Transition temperature (TT)
-
The mean values of DSR-melt temperature (TT) of the six PCP are shown in Table 4. The PCPs manufactured with MCC had higher TT values than the corresponding MPC. The MPC-H, MPC-L, and MCC-L had similar TT values. The PCP made using control (MCC-C and MPC-C) showed the lowest TT values. The TT of the MPC-L was between the MCC-C and MCC-L. Similar to the melt area data, the MCC-H significantly differed from the other treatments. The PCP made using MCC-H did not melt at 90 °C as it was crosslinked too much. Both products (MCC and MPC), as well as enzyme levels (C, L, or H), affected the melt area and TT.
-
After TGase treatment and drying, MCC and MPC were used as ingredients for manufacturing PCP using the SoS formulation (Table 1). Differences in the product (MPC and MCC) and TGase level had a significant effect on the unmelted (hardness) and melted (VAM, melt area, rheology, and TT) characteristics of PCP.
The MCC and MPC formulations were balanced for total protein content (Tables 1 & 2); hence the MCC provided a higher level of intact CN and less serum protein, whereas MPC had a lower level of intact CN and a higher level of serum protein. The difference in the constituents was because of inherent processing differences between MF and UF to produce MCC and MPC, respectively[10]. Compared to MPC, the MCC retentate was significantly (p < 0.05) higher in TN/TS ratio[10]. In addition, MCC powder protein and calcium contents were higher than the MPC powder, whereas the lactose content was almost 50% less than that of MPC powder[14].
Both product type and enzyme level affected the VAM (Tables 3 & 4). The PCP manufactured using MPC had a higher viscosity than those manufactured using MCC (Table 4). The PCP VAM was affected by the level of intact casein and serum proteins. The VAM results from various protein interactions with protein and fat[59]. These interactions are dependent on the characteristics of the protein that forms the structure of the PCP[60], and the presence of intact (unhydrolyzed) CN which results in a fibrous CN network[3,4,13,17,61,62]. The additional serum protein in the MPC treatments can aggregate due to the high cook temperature (95 °C) used during PCP manufacture. This aggregate can cause an increase in viscosity[4,13,17,62]. Similar observations were noted by other researchers and concluded that the denaturation of serum or whey protein during PCP manufacture forms a heat-induced irreversible gel and produces a PCP with restricted melt characteristics[3,4,61,62]. Even though the MPC had higher VAM than the MCC samples, the hardness and meltability were lower.
Post-manufacturing melt characteristics were measured by a modified Schreiber melt test, rheology, and TT, whereas unmelted characteristics were measured using a penetration test. The cheese melt is defined as cheese's ability to flow and spread[15, 63], and a modified Schreiber melt test can be used to measure the meltability. Additionally, DSR was used to measure the rheological parameters (G', G", G*, and viscosity) given in Figs 2 & 3. The TT was calculated where tan δ (G″/G′) = 1 and is a convenient measure of the melting point of PCP because this is the lowest temperature where a material changes from primarily elastic to primarily viscous[4] and has been used to quantify the melting characteristic of PCP[15]. A cheese that melts easily and quickly will have a low TT and vice-versa[15].
The extensive crosslinking of SP and casein at higher temperatures[4, 64], during PCP manufacture in formulations having MPC causes restricted melt characteristics. The meltability[4,15,62,65] and firmness[4,14,62,65] of PC foods decreased significantly with an increased amount of WP and were attributed to the emulsification and denaturation of SP[4,62,65]. However, others found similar results but concluded that the SP inhibits meltability but is not the only cause of the melt defect[66]. As SP concentration increased, the fibrous structures became apparent, responsible for the loss of cheese meltability[66].
Penetration hardness is a direct indication of the firmness of PCP. Even though the VAM was higher for PCP containing MPC, its penetration hardness values were less, indicating a soft body. The use of high intact CN cheese in PCP formulation has been shown to increase the hardness of PCP[3,4,14,62]. The higher hardness in samples having MCC in the formulation has been reported, and the differences were attributed to higher intact CN and lower serum protein content in MCC used[14,62]. The use of MPC resulted in a soft body and restricted melting characteristics (Table 4). It was because of the difference between intact casein and serum protein in MPC and MCC powders used in the PCP formulation.
The MCC and MPC retentates were treated with TGase before drying[14,15], which significantly changed the functionality of the SoS PCP. The TGase action caused a high amount of inter-and intra-protein crosslinking in MCC and MPC samples, contributing to these changes[13−16]. The treatments with TGase addition at high levels (MCC-H and MPC-H) crosslinked protein fractions via covalent bonding[14,16]. As a result, they changed the surface properties of CN micelle, causing changes in viscosity, emulsification capacity, and water holding capacity[14,16], which in turn caused an increase in VAM. We theorize that the strong covalent crosslinking at the high TGase level in MCC-H and MPC-H caused a significant increase in VAM. This covalent interaction is difficult to break and may have caused different protein-protein interactions and network formation, affecting VAM. Authors have reported changes in VAM after TGase treatment in PCP[13] and loaf-type PCP[17]. Other researchers have also reported increased viscosity after TGase treatment in other product matrices, such as yogurt, because of TGase crosslinking[51,52,55].
Similarly, higher covalent crosslinking due to TGase action modifies CN and SP at the molecular level causing restricted melt characteristics[13,15,17]. The casein molecules (their number, strength, and type of bond) are fundamental building blocks of rheological properties[15,63], and the melting of cheese is primarily determined by the number and strength of CN-CN interactions above 50 °C[15,67]. The covalent bond is the most robust bond linkage, which is very difficult to destroy in the conditions encountered during PCP manufacture. The MCC-H and MPC-H had higher levels of crosslinking[13−16] and low meltability, while MCC-L and MPC-L had a low level of crosslinking and hence had more meltability as measured by melt tests.
The PCP made using MCC-H did not melt at 90 °C as it was crosslinked too much[14,15]. These results are supported by the Schreiber melt test (Table 4) and rheology (Figs 2 & 3), as described above. As expected, samples with a low melt area had a high TT, and samples with a high melt area had a low TT. The CN-CN interactions were so strong in MCC-H that the matrix showed no signs of melting, even at the highest temperature. MCC, primarily intact CN, could be the reason for high TT in PCP. At elevated temperatures (> 40 °C), the CN-CN interaction (the number and strength) determines melting behavior[63,67]. Hydrophobic interactions, electrostatic repulsion, hydrogen bonds, CCP crosslinks, and disulfide bonds all play a critical role in cheese melt characteristics[63]; the TGase covalent bonding role needs further investigation. A further detailed study is required at a molecular level to determine the effect of such covalent bonds.
Overall, the use of MCC and MPC in SoS formulation affects viscosity during manufacture, texture, and melt characteristics. TGase treatment changes the functionality of MCC and MPC in SoS PCP formulation with an increase in viscosity during manufacture at higher levels of TGase usage and also restricts melt.
-
The unmelted and melted functional properties of PCP were affected by TGase treatment. The MPC samples had higher viscosity during manufacture as compared to MCC samples. The MPC samples showed restricted melt and softer texture compared to MCC samples. As the TGase addition increased, there was a significant (p ≤ 0.05) increase in TT and a significant (p ≤ 0.05) decrease in the Schreiber melt area. Rheological studies also confirmed the results. The PCP made from MCC had higher TT and Schreiber melt area values than that made from MPC as an ingredient (TGase or no TGase). It was concluded that TGase treatment modifies the melt characteristics of MCC and MPC in PCP slice formulations. By controlling the crosslinking new PCP products can be manufactured that meet specific functional requirements.
We thank Dairy Research Institute (Rosemont, IL, USA) and Midwest Dairy Foods Research Center (St. Paul, MN, USA) for funding this project.
-
The authors declare that they have no conflict of interest.
- Copyright: © 2023 by the author(s). Published by Maximum Academic Press on behalf of Nanjing Agricultural University. This article is an open access article distributed under Creative Commons Attribution License (CC BY 4.0), visit https://creativecommons.org/licenses/by/4.0/.
-
About this article
Cite this article
Salunke P, Metzger LE. 2023. Impact of transglutaminase treated micellar casein concentrate and milk protein concentrate on the functionality of processed cheese product slice formulations. Food Materials Research 3:31 doi: 10.48130/FMR-2023-0031 

Impact of transglutaminase treated micellar casein concentrate and milk protein concentrate on the functionality of processed cheese product slice formulations
- Received: 20 July 2023
- Accepted: 29 August 2023
- Published online: 10 November 2023
Abstract: Milk protein concentrate (MPC) is used as an ingredient in processed cheese product (PCP) formulations. However, its use can result in texture defects such as a soft body and restricted melting characteristics. The use of micellar casein concentrate (MCC), which has a higher level of casein and less serum protein, improves the texture of PCP. Further improvement in PCP products may be possible using transglutaminase (TGase), an enzyme that can crosslink proteins. This study aimed to determine the effect of TGase treatment of MPC and MCC retentates on the functionality of MPC and MCC when used in a PCP slice formulation. Three lots of MCC and MPC retentate were produced using microfiltration and ultrafiltration, respectively. Each replicate of retentate was divided into three equal portions and treated with transglutaminase enzyme at three different levels: 0.3 U/g of protein, 3.0 U/g of protein, and no TGase addition. The retentates were spray-dried, and powders were used in PCP slice formulation. Functional properties of PCP were analyzed using a penetration test, Dynamic stress rheology (DSR) for transition temperature (TT), and Schreiber melt test. As the TGase addition increased, there was a significant (p ≤ 0.05) increase in TT and a significant (p ≤ 0.05) decrease in the Schreiber melt area. The PCP made from MCC had higher TT and Schreiber melt area values than that made from MPC as an ingredient (TGase or no TGase). It was concluded that TGase treatment modifies the melt characteristics of MCC and MPC in PCP applications.
-
Key words:
- Transglutaminase /
- MCC or MPC /
- Process cheese product slice functionality