


-
Tea plant [Camellia sinensis (L.) O. Kuntze], is suitable for growing in acidic soil with pH 4.5−6.5. Aluminum (Al) toxicity is currently a crucial factor limiting plant growth in acidic environments, because when the pH of the soil is less than 5, Al can be transformed into phytotoxic trivalent cation (Al3+) that are readily absorbed by plants, thereby affecting plant growth[1]. As an Al hyperaccumulating plant, C. sinensis can contain up to 30,000 mg·kg−1 of Al in its mature leaves without showing symptoms of Al toxicity[2]. Appropriate Al concentration promotes the growth and development of tea plants. Once it exceeds 1 mmol·L−1, C. sinensis suffer from a negative effect on its normal growth[3].
Various strategies for plants to cope with Al toxicity include external exclusion mechanisms such as increasing Al chelation and reducing Al uptake by plants, as well as increasing antioxidant enzyme activity and reducing toxic substances caused by reactive oxygen species and free radicals, among other internal detoxification mechanisms[4]. Meanwhile, excessive Al also has a certain impact on the tea quality components of tea polyphenols, catechins, amino acids, caffeine and other substances[5]. Not only that, tea consumption also increases dietary intake of Al, which is thought to be associated with Alzheimer's disease[6]. Therefore, exploration of measures to reduce content of Al in C. sinensis is of great significance in alleviating Al stress and improving tea quality.
Hydrogen sulfide (H2S) is regarded as a poisonous gas and atmospheric pollutant, but it was subsequently found to be the third gaseous signaling molecule after nitric oxide (NO) and carbon monoxide (CO)[7]. And synthesizes endogenous H2S mainly through L-cysteine desulphydrase (LCD), which is widely present in plants[8]. Recently, research on H2S has begun to reveal the role of these molecules in regulating plant abiotic and biotic stress resistance responses. Through the exogenous application of H2S donors, H2S has been proven to regulate plant growth and increase plant tolerance to drought, salt, temperature, and metal stress. It can be seen that H2S plays vital roles in facilitating plant with tolerance to environmental stresses[9]. However, the role of H2S in alleviating Al stress of C. sinensis is still unclear.
There are many studies on Al enrichment in tea plants, but currently there is a lack of research on H2S signaling molecules for Al tolerance in tea plants. Now, through different hydroponic treatments (0.4Al, H2S + 0.4Al, PAG + 0.4Al, 2Al, H2S + 2Al, PAG + 2Al, 4Al, H2S + 4Al, PAG + 4Al), we investigated the effects of H2S preapplication on the biomass, the content and transfer rate of Al and other elements in different tissues, the content of chlorophyll, photosynthetic indexes, the ultrastructure, the antioxidant enzyme activity and tea quality components under Al stress. Preliminary exploration of the role of exogenous H2S in the physiological response of tea plants to Al stress provides new ideas for further research on alleviating Al stress and reducing Al accumulation in tea plants.
-
For the experiment, annual cutting seedlings of C. sinensis cv. 'Zhongcha 108' were obtained from the Nanjing (Ya Run Tea Co., Ltd., Jiangsu Province, China). The tea seedlings were firstly pre-cultured in water for 5 d, then transferred to 1/8, 1/4, and 1/2 total nutrient solutions to culture for 5 d in each strength nutrient solution, and finally transferred to total nutrient solutions for 10 d (culture medium was replaced every 5 d)[10]. The seedlings with consistent growth were used to carry out the subsequent treatment assays with H2S or PAG and Al3+ as shown in Table 1. For treatments, Al2(SO4)3·18H2O, Na2S·9H2O and DL-propargylglycine (PAG) were the Al3+ donor[11], H2S donor[12] and L-cysteine desulfurase (LCD) inhibitor[13], respectively. And solution pH was adjusted to 4.5 ± 0.1 with 1.0 mol·L−1 NaOH or 1.0 mol·L−1 HCl. The experiments were performed in the Intelligent Greenhouse of Nanjing Agricultural University (China), controlled growth room at 25 °C/22 °C with 16 h light/8 h dark cycle, 30,000 l x light intensity and a relative humidity of 75%.
Table 1. Description of nine experimental treatments.
Treatments Days 1−15 Days 15−30 0.4Al (control) 0.4 mmol·L−1 Al3+ 0.4 mmol·L−1 Al3+ H2S + 0.4Al 100 μmol·L−1 H2S + 0.4 mmol·L−1 Al3+ 0.4 mmol·L−1 Al3+ PAG + 0.4Al 1 mmol·L−1 PAG + 0.4 mmol·L−1 Al3+ 0.4 mmol·L−1 Al3+ 2Al 0.4 mmol·L−1 Al3+ 2 mmol·L−1 Al3+ H2S + 2Al 100 μmol·L−1 H2S + 0.4 mmol·L−1 Al3+ 2 mmol·L−1 Al3+ PAG + 2Al 1 mmol·L−1 PAG + 0.4 mmol·L−1 Al3+ 2 mmol·L−1 Al3+ 4Al 0.4 mmol·L−1 Al3+ 4 mmol·L−1 Al3+ H2S + 4Al 100 μmol·L−1 H2S + 0.4 mmol·L−1 Al3+ 4 mmol·L−1 Al3+ PAG + 4Al 1 mmol·L−1 PAG + 0.4 mmol·L−1 Al3+ 4 mmol·L−1 Al3+ Fresh and dry weight analysis
-
Plants were collected and separated into young leaf (the first and second leaf from the top of plants), mature leaf (remaining leaves), stem and root. Fresh weight (FW) of seedlings were weighed instantly after harvesting and then placed into an oven at 105 °C for 30 min and then baked at 80 °C until biomass became stable. The dry weight (DW) immediately weighed after removal from the oven.
Root activity assessments
-
Root activity was measured using the 2,3,5-tripheyl tetrazolium chloride (TTC) method[14]. About 0.5 g of fresh root tips were placed in a mixture of 5 mL 1% TTC and 5 mL phosphate buffer for 1 h at 37 °C in the dark. The assays were terminated by adding 2 mL 1.0 mol·L−1 H2SO4 to the reaction mixture. The reduced TTC was extracted with 3-4 mL ethyl acetate, then ethyl acetate was added to the 10 mL level, and absorbance was read at 485 nm.
Transmission electron microscopy
-
Leaf fragments without veins were collected from randomly selected plants, then fixed 24 h in 2.5 % glutaraldehyde solution and stored at 4 °C. Samples were rinsed three times with the same phosphate-buffered saline (PBS, pH 7.2), and post-fixed in 1% osmium oxide for 1 h, washed three times with distilled water. The samples were dehydrated in a graded series of ethanol (50%, 70%, 80%, and 100 %) and at the end treated with absolute acetone for 24 h. Ultra-thin sections (≤ 100 nm) of specimens were prepared for viewing.
Measurement of chlorophyll content and photosynthesis parameters
-
Chlorophyll a and chlorophyll b of randomly selected mature leaves per treatment were measured as described previously[15]. Samples were completely immersed with 10.0 mL mixture of acetone-95% ethanol-water (9:9:2, v:v) and transferred into tubes placed in a dark place until the leaves turn completely white. The OD665 and OD649 values were used to calculate chlorophyll content. A LI-6400XT portable photosynthesis system (Li-Cor Biosciences, Lincoln, Nebraska, USA) was used to measure net photosynthetic rate (Pn), stomatal conductance (Gs), transpiration rate (Tr), and intercellular CO2 concentration (Ci) with 1,200 μmol·m−2·s−1 illuminance and 500 μmol·mol–1 flow rate.
Assay of Al and other elemental concentrations
-
The plant samples with 0.2 g were placed into the digestion vessels, mixed with HNO3 : HClO4, (4:1, v:v) and digested in microwave digestion system. The concentrations of Al, calcium (Ca), magnesium (Mg), manganese (Mn), iron (Fe) and zinc (Zn) in the filtrate were determined using inductively coupled plasma optical emission (ICP-OES, PerkinElmer Inc.) following a standard procedure.
Analysis of lipid peroxidation and proline content
-
Lipid peroxidation was measured in terms of malondialdehyde (MDA) content according to Alatawi et al.[16]. Fresh leaves (0.1 g) were ground and extracted in 1 mL of 10% trichloroacetic acid (TCA), then the supernatant was collected by centrifuging at 5,000 rpm for 10 min. 0.5 mL supernatant (0.5 mL distilled water as control) were homogenized in 0.5 ml of 0.6 % 2-thiobarbituric acid (TBA) and heat in boiling water for 15 min, then cooled until room temperature. The absorbance of the supernatant was measured at 532, 600, and 450 nm.
Proline content was determined using the acid ninhydrin method[17]. First, 0.1 g of leaf samples was added to 1 ml of 3% sulfosalicylic acid solution and extracted in boiling water for 10 min, then centrifuged at 5,000 rpm for 10 min. Next, 0.2 mL of supernatant was homogenized and mixed with 0.2 mL of acetic acid and 0.2 mL of 2.5% acid ninhydrin and kept at boiling point for 30 min, then cooled until room temperature, 0.4 mL of toluene treated and then oscillated by vortex for 30 s. After 10 min, supernatant centrifuged at 3,000 rpm for 5 min. Finally, the absorbance was scored at 520 nm.
Determination of GSH, GSSG and enzyme activity
-
The glutathione (GSH) and oxidized glutathione (GSSG) were measured by GSH and GSSG kit (NO. BC1170, NO. BC1180; Beijing Solarbio Science & Technology Co., Ltd., China). LCD enzyme was detected by referring to the LCD kit (NO. MBE21193; Nanjing Maibo Biotechnology Co., Ltd., China). The activities of glutathiones-transferase (GST) and glutathione reductase (GR) was determined following the description by kit (NO. BC0350, NO. BC1160; Beijing Solarbio Science & Technology Co., Ltd., China). Superoxide dismutase (SOD), peroxidase (POD) and catalase (CAT) was performed according to instructions of the kits (NO. R22262, NO. R3031, NO. R22072; Shanghai Yuanye Biotechnology Co., Ltd., China), respectively.
Determination of tea components content
-
The contents assay viz. tea polyphenols, catechins, amino acids and caffeine was measured according to GB/T 8313-2018[18], GB/T 8314-2013[19], and GB/T 8312-2013[20], respectively.
Data statistics and analysis
-
All the data were from three independent experiments with three biological repeats. The experimental data were statistically processed using Excel 2016, GraphPad Prism 8.0 and variance analysis software SPSS 20.0 (SPSS Inc. version 22.0, Chicago, IL, USA). Different lowercase letters on the graphs indicate that the mean values among different H2S conditions under the same Al concentration treatment were statistically different at p < 0.05 level, and different uppercase letters represent significant differences among different Al concentration treatments under the same H2S condition at p < 0.05 level.
-
As expected, new root of C. sinensis treated with 2Al and 4Al was less than that of normal 0.4Al culture, but early application of H2S compared to lone Al treatment effectively promoted the root development, while PAG + Al significantly inhibited root growth (Fig. 1). Moreover, application of PAG not only inhibited normal development of root system, but also inhibited the growth of leaves (Fig. 1c, f & i). Chlorosis, even leaf abscission symptoms in leaves have also occurred (Fig. 1c, f & i).
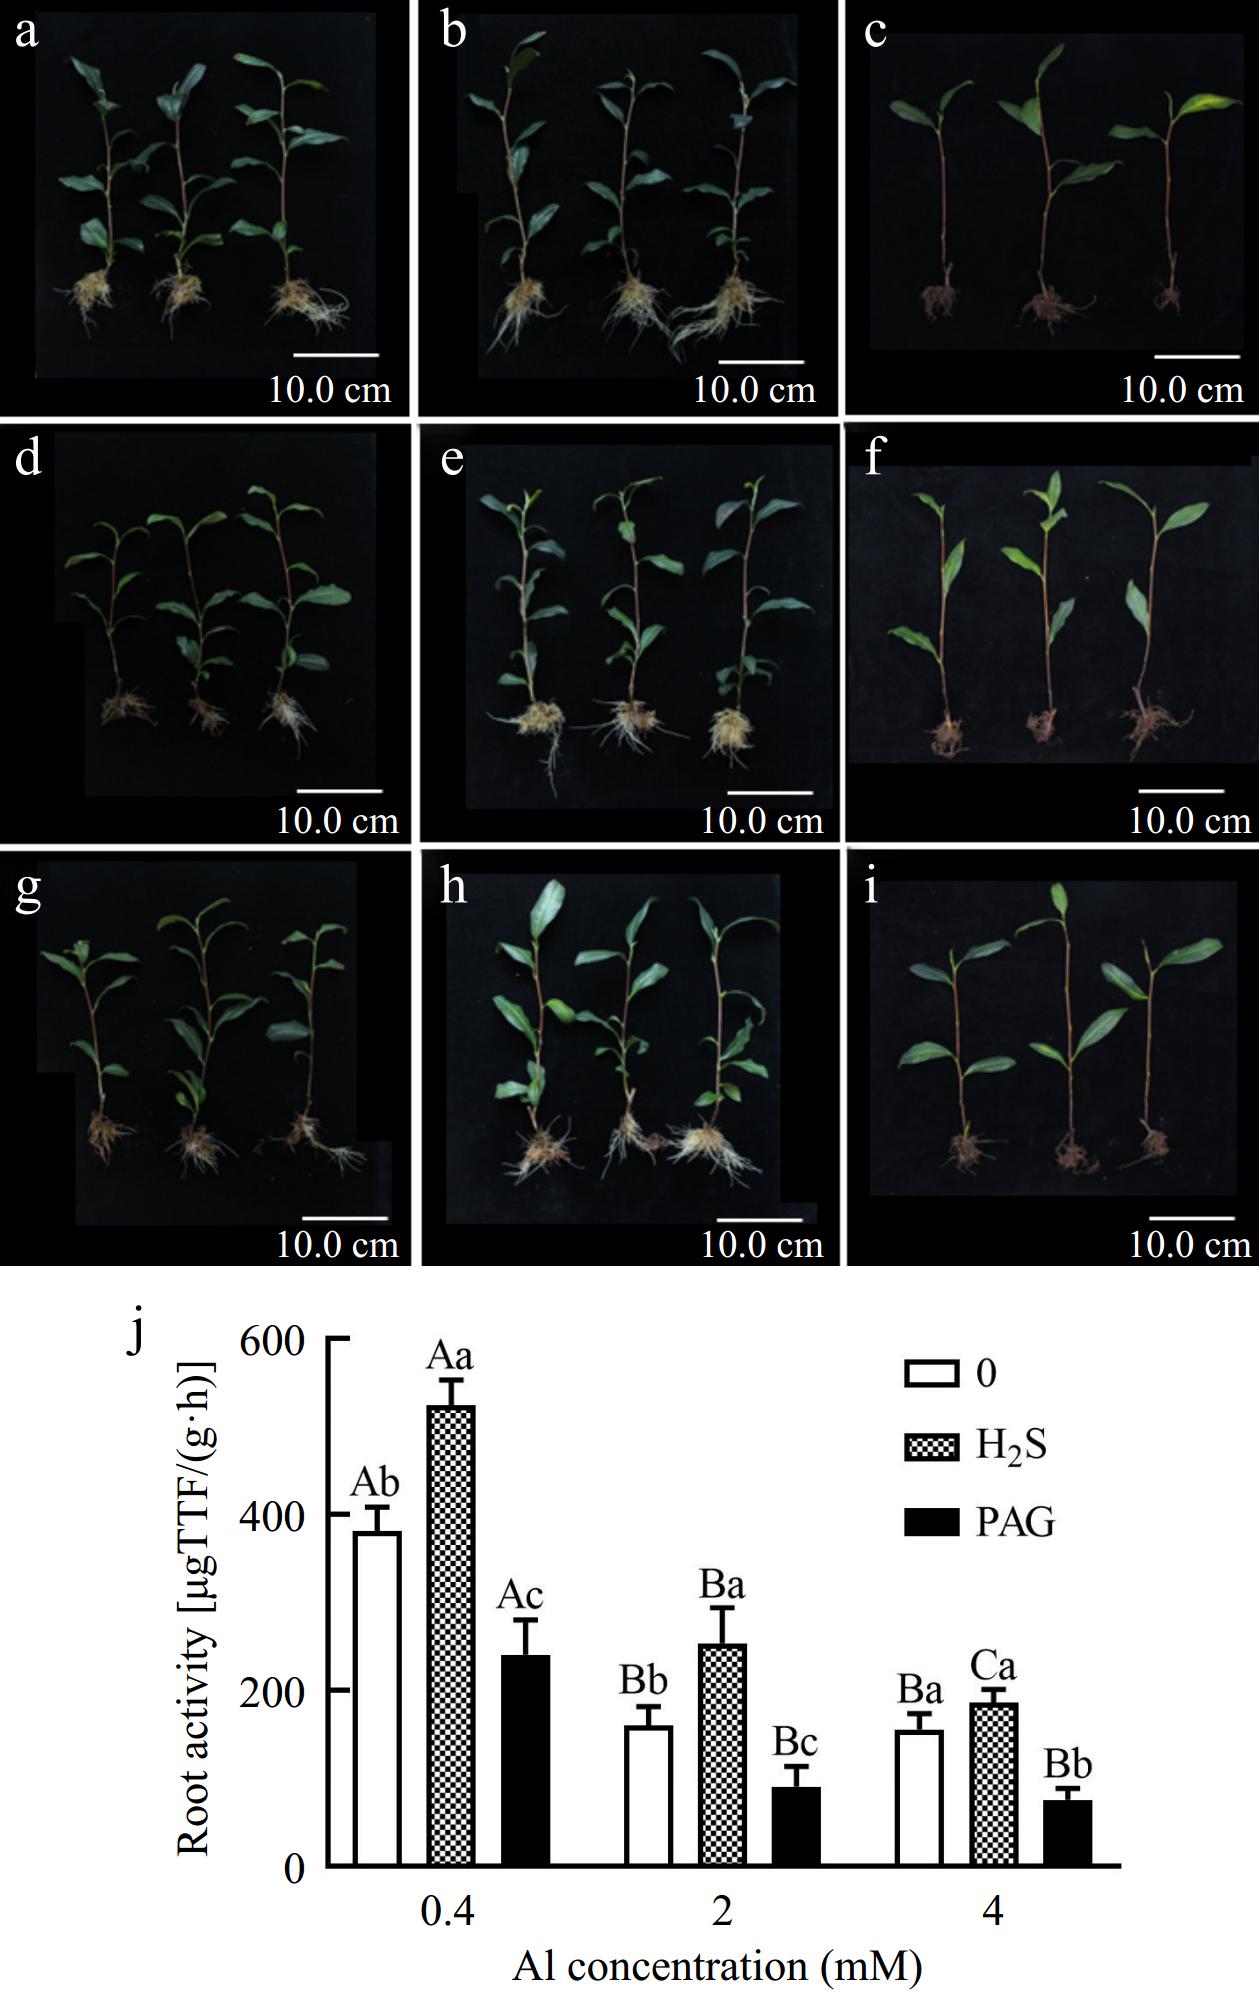
Figure 1.
Effect of different treatments on symptoms, (a) 0.4Al, (b) H2S + 0.4Al, (c) PAG + 0.4Al, (d) 2Al, (e) H2S + 2Al, (f) PAG + 2Al, (g) 4Al, (h) H2S + 4Al, (i) PAG + 4Al, and (j) root activity in C. sinensis. Different lowercase letters in (j) represent significant differences among different H2S conditions under the same Al concentration treatment, and different uppercase letters represent significant differences among different Al concentration treatments under the same H2S condition (p < 0.05), as determined by the Duncan test.
To further clarify whether H2S is beneficial for tea root growth under different Al conditions, we explored root activity. We observed higher concentrations (2Al and 4Al) resulted in a greatly decrease in root activity (Fig. 1j). And an increase of 37.59%, 58.42%, and 19.55% in root activity under H2S pretreatment compared to the separate 0.4Al, 2Al and 4Al treatments, respectively (Fig. 1j). However, exogenous PAG treatment significantly inhibited root activity compared to various Al concentrations (Fig. 1j).
Effects different treatments on fresh and dry weight
-
Overall, the total fresh weight (FW) and dry weight (DW) of tea plants were both increased by early application of H2S, while the use of PAG reduced the FW and DW of C. sinensis (Fig. 2e, j). Moreover, the results showed that, except for H2S + 4Al, which did not increase FW in the leaves compared to 4Al, the FW of other different tissues under H2S + Al treatments showed an increase in FW compared to the single Al treatment (Fig. 2a−d). In addition, the DW of other tissues increased under H2S + Al treatments compared to single Al treatment for tea seedlings, except for H2S + 4Al which showed decrease in DW of old leaves compared to 4Al (Fig. 2f−i).
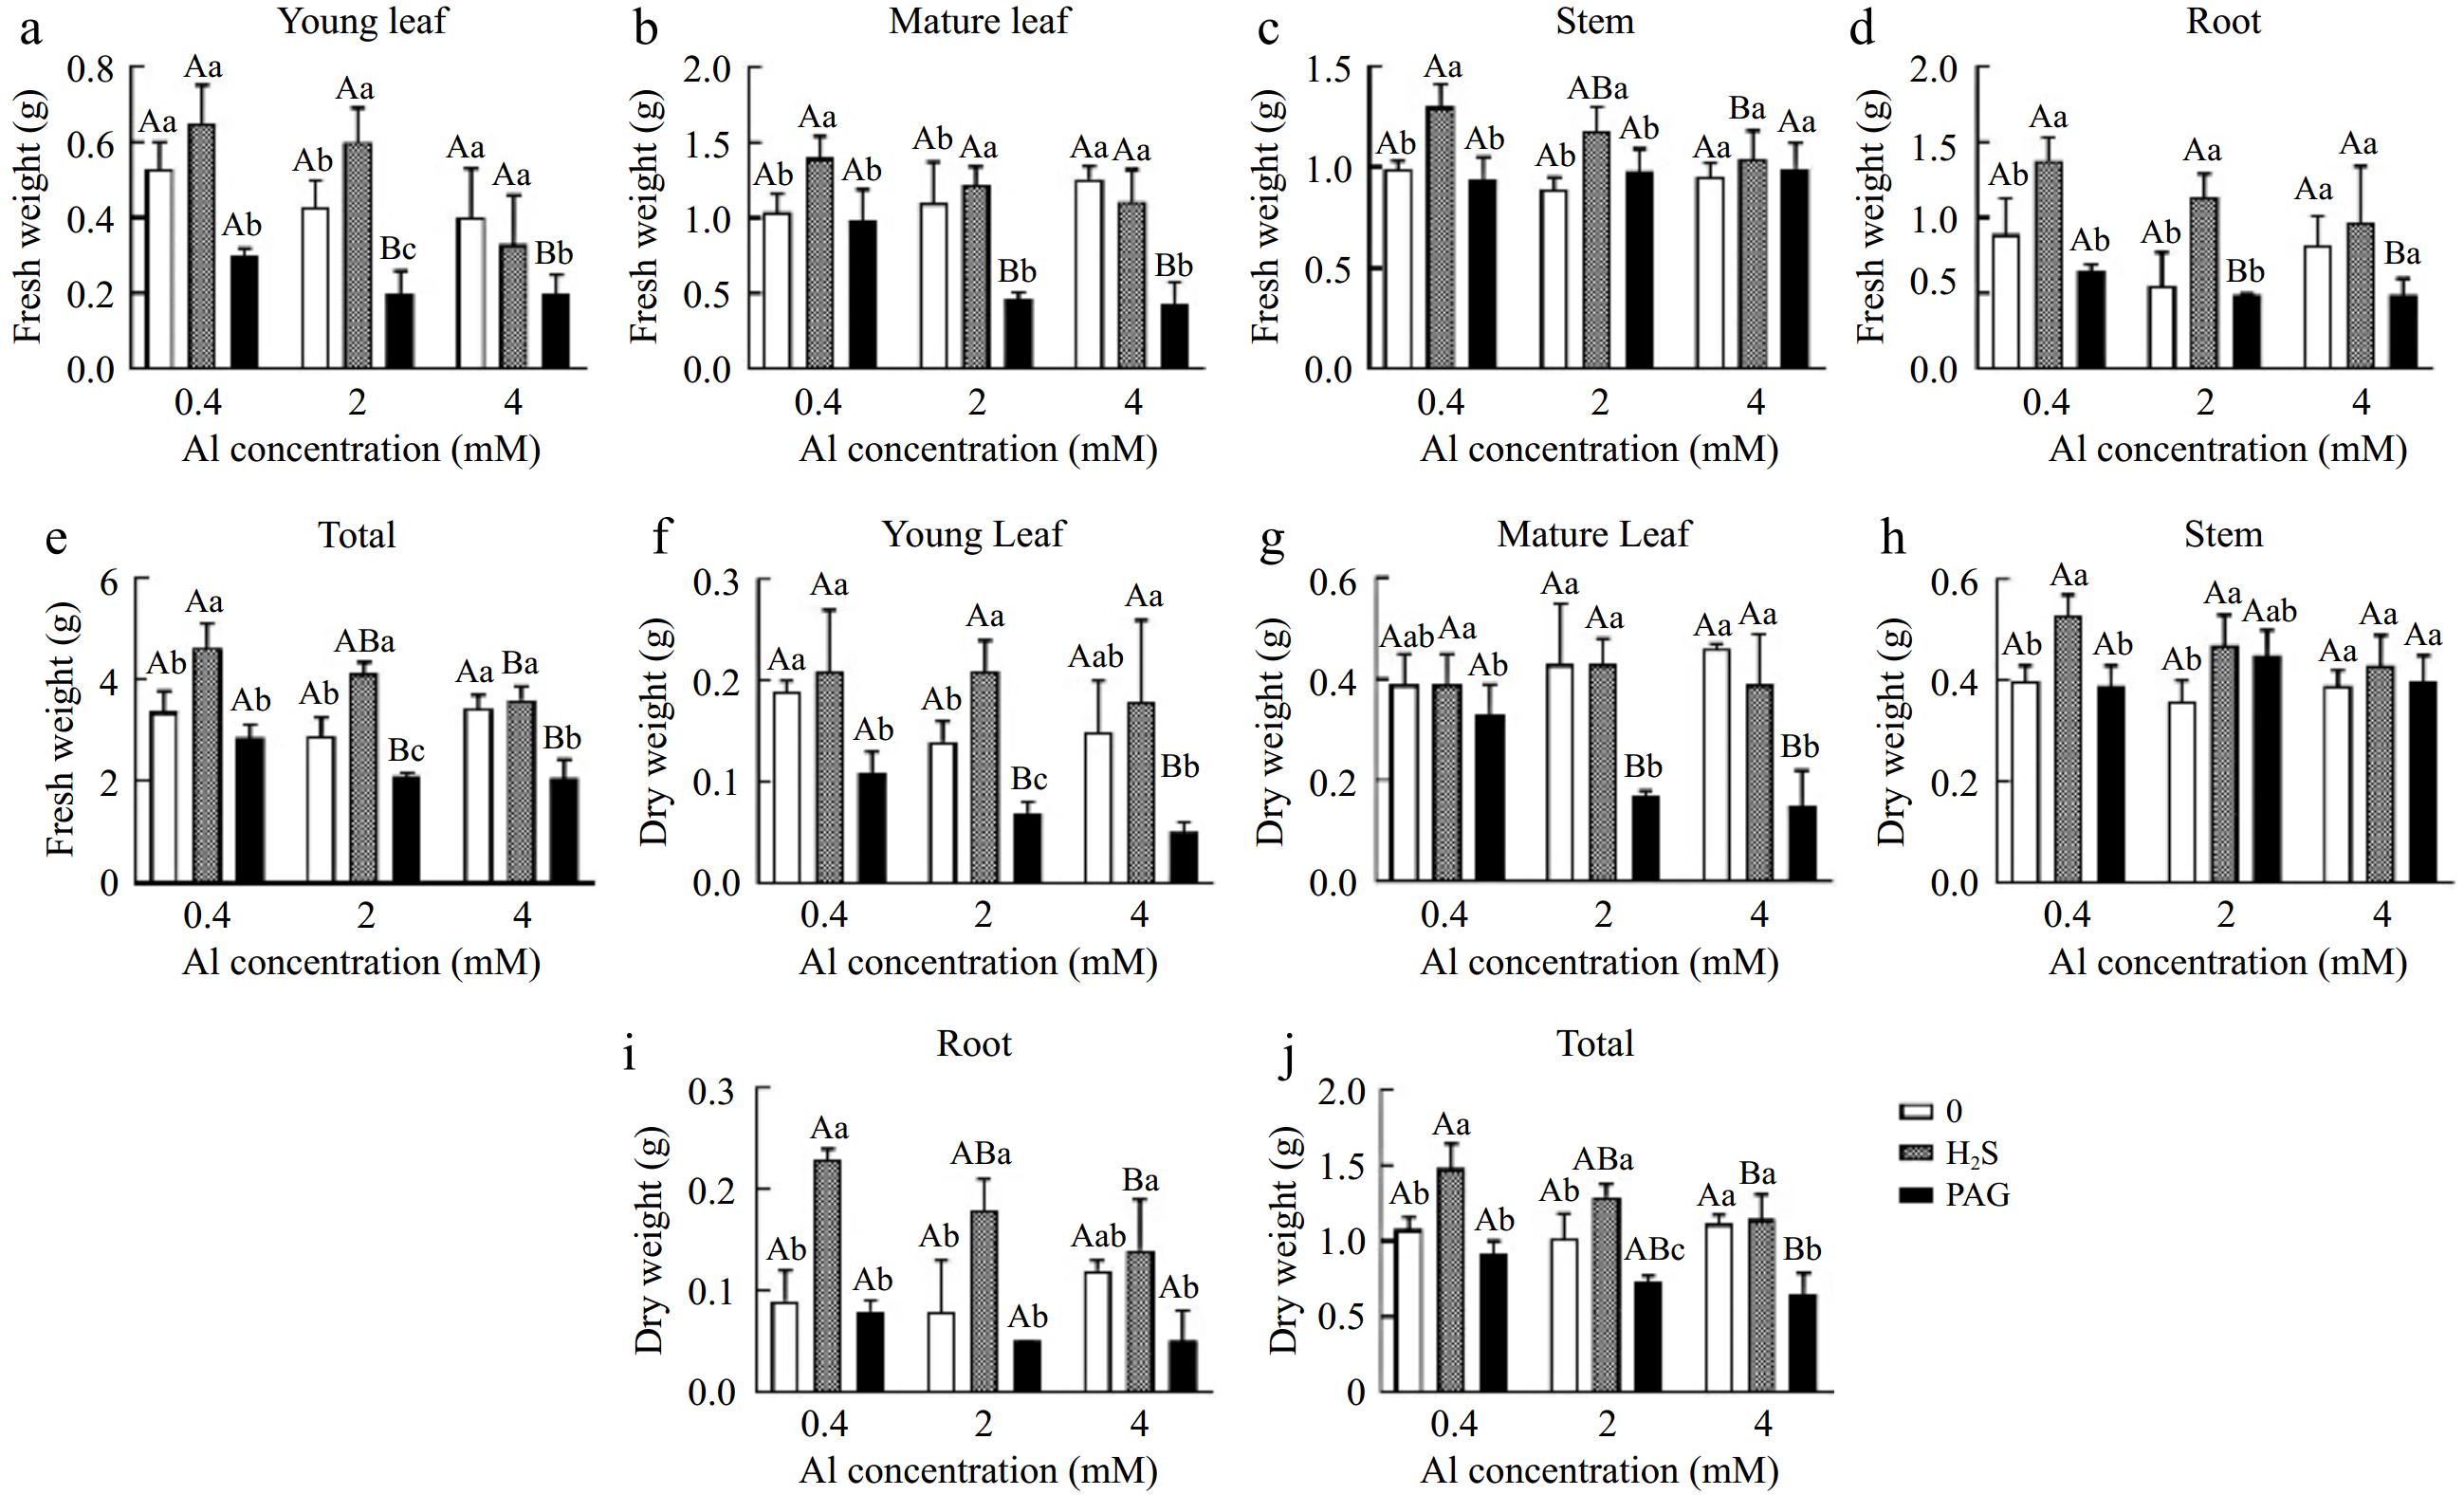
Figure 2.
Fresh and dry weight in (a, f) young leaves, (b, g) matures leaves, (c, h) stems, (d, i) roots, and (e, j) total content of Al of C. sinensis cultured with different treatments. Different lowercase letters represent significant differences among different H2S conditions under the same Al concentration treatment, and different uppercase letters represent significant differences among different Al concentration treatments under the same H2S condition (p < 0.05), as determined by the Duncan test.
Effect of H2S on accumulation and translocation factor of Al in C. sinensis
-
There was no significant decrease in content of Al between pre-applied H2S treatment and single Al treatment in young leaves (Table 2). Nevertheless, compared with 0.4Al treatment, content of Al in roots markedly increased when H2S was applied in advance, while accumulation of Al in roots was dramatically reduced when H2S was applied in advance to the 2 mM Al3+ and 4 mM Al3+ treatments (Table 2). Meanwhile, compared to other treatments within the group, content of Al was the highest in roots when PAG-pretreated was applied in advance, with similar performance in total Al content (Table 2). Unusually, pretreatment with H2S increased content of Al in mature leaves compared to Al treatment alone, and there was a similar trend of Al accumulation in stems (Table 2). Under normal Al concentration, the translocation factor (TF) of Al of 0.4Al is the highest, which is 1.7 times that of H2S + 0.4Al and 10.625 times that of PAG + 0.4Al (Table 2). Whereas, TF of Al demonstrated H2S + Al > Al > PAG + Al after 2Al and 4Al treatment (Table 2).
Table 2. Effects on content and translocation factor (TF) of Al in C. sinensis under different treatments.
Elements Treatment YL (mg·kg−1) ML (mg·kg−1) S (mg·kg−1) R (mg·kg−1) Total content (mg·kg−1) TF (%) Al 0.4Al 551.30 ± 25.52Ba 1204.96 ± 324.00Aa 427.13 ± 12.20Ba 2566.89 ± 96.52Bc 4750.29 ± 207.35Bc 0.85 ± 0.14Aa 0.4Al + H2S 474.49 ± 57.74Ba 1605.65 ± 30.85Ba 558.06 ± 69.96Ca 5323.33 ± 506.90Cb 7961.52 ± 573.30Bb 0.50 ± 0.04Bb 0.4Al + PAG 291.67 ± 33.05Cb 1125.82 ± 345.62Aa 537.35 ± 118.21Aa 23523.28 ± 1412.99Ba 25478.12 ± 1623.32Ba 0.08 ± 0.01Bc 2Al 700.68 ± 14.51Ab 1232.58 ± 102.65Ab 735.12 ± 40.15Ab 15651.00 ± 387.50Ab 18319.37 ± 478.25Ab 0.17 ± 0.01Bb 2Al + H2S 758.33 ± 51.39Ab 2000.13 ± 209.09Aa 976.59 ± 29.70Aa 8574.85 ± 700.31Bc 12309.90 ± 638.39Ac 0.44 ± 0.05Ba 2Al + PAG 999.06 ± 45.47Ba 1101.78 ± 48.02Ab 669.60 ± 131.31Ab 28361.41 ± 199.73Aa 31131.86 ± 296.48Aa 0.10 ± 0.01ABc 4Al 771.52 ± 123.22Ab 1342.59 ± 60.73Aa 675.39 ± 120.29Aa 14741.91 ± 2122.85Ab 17531.41 ± 2218.98Ab 0.19 ± 0.03Bb 4Al + H2S 819.06 ± 20.35Ab 1475.13 ± 107.29Ba 732.93 ± 62.82Ba 10066.06 ± 835.49Ac 13093.18 ± 954.89Ab 0.30 ± 0.02Aa 4Al + PAG 1285.44 ± 106.37Aa 1086.46 ± 135.20Ab 756.13 ± 104.12Aa 26682.34 ± 3130.59ABc 29810.37 ± 3150.15Aa 0.12 ± 0.02AAc Values are the mean ± SD (n = 3). Different lowercase letters represent significant differences among different H2S conditions under the same Al concentration treatment, and different uppercase letters represent significant differences among different Al concentration treatments under the same H2S condition (p < 0.05), as determined by the Duncan test. H2S affects ion homeostasis of C. sinensis after different treatments
-
Content of Ca increased in the solution with H2S or PAG pre-applied, and this increase was more elevated in 0.4Al than 2Al, 4Al in young leaves, while more increased in 2Al and 4Al than 0.4Al in mature leaves (Table 3). In stems, application of PAG remarkably enhanced the concentrations of Ca under 0.4Al, but decreased content of Ca in 2Al and 4Al (Table 3). Moreover, results in roots showed that content of Ca under H2S + 0.4Al was 2.71 times that of 0.4 Al, and content of Ca in PAG + 0.4Al was 4.5 times that of 0.4 Al, but H2S + 4Al and PAG + 4Al inhibited content of Ca compared to 4Al, and changes in content of Ca between 2Al, H2S + 2Al, and PAG + 2Al groups were relatively small (Table 3). After H2S combined 2Al significantly improved content of total Ca, while a little effect on 0.4Al and 4Al (Table 3). In addition, the TF of Ca exhibited 0.4Al > H2S + 0.4Al > PAG + 0.4Al, while H2S +2 Al and PAG + 2Al have no significant effect on the TF of Ca compared to 2Al, only H2S + 4Al significantly promoted TF of Ca compared to 4Al (Table 3).
Table 3. Effects on content and translocation factor (TF) of Ca, Mg, Zn, Mn, Fe in C. sinensis under different treatments.
Elements Treatment YL (mg·kg−1) ML (mg·kg−1) S (mg·kg−1) R (mg·kg−1) Total content (mg·kg−1) TF (%) Ca 0.4Al 6168.53 ± 606.30Bb 13894.03 ± 340.79Aab 2746.77 ± 24.59Bb 476.37 ± 41.02Cc 23285.69 ± 1696.58Bb 47.92 ± 0.76Aa 0.4Al + H2S 8064.69 ± 66.16Ca 13027.66 ± 1043.18Bb 2781.84 ± 61.89Cb 1289.49 ± 60.48Bb 25163.67 ± 436.51Cb 18.53 ± 0.58Ab 0.4Al + PAG 9322.85 ± 1413.64Aa 14978.35 ± 230.29Aa 3606.75 ± 523.74Aa 2144.36 ± 58.02Aa 30052.32 ± 1938.42Aa 13.03 ± 1.24Ac 2Al 11223.02 ± 223.36Aa 12447.40 ± 1926.26Ab 3559.11 ± 198.46Aa 1573.00 ± 74.02Ba 28802.53 ± 598.30Ac 17.33 ± 0.62Ba 2Al + H2S 11693.96 ± 749.31Aa 15968.96 ± 553.09Aa 3955.32 ± 217.77Aa 1695.65 ± 273.89Aa 33313.87 ± 1007.07Aa 19.05 ± 3.82Aa 2Al + PAG 10558.09 ± 739.25Aa 15748.44 ± 629.97Ba 3026.63 ± 321.80Ab 1905.82 ± 193.23ABa 31238.99 ± 388.96Ab 15.51 ± 1.78Aa 4Al 10986.74 ± 1426.59Aa 12852.33 ± 968.51Ab 3355.19 ± 272.64Aab 1878.07 ± 191.42Aa 29072.34 ± 1204.10Aa 14.57 ± 1.35Cb 4Al + H2S 10405.55 ± 102.64Ba 14656.58 ± 769.17ABa 3566.27 ± 65.69Ba 1511.59 ± 84.73ABb 30140.00 ± 1162.14Ba 18.96 ± 0.69Aa 4Al + PAG 10806.80 ± 1205.83Aa 12881.85 ± 15.75Bb 3227.25 ± 1.88Ab 1713.41 ± 164.33Bab 28629.31 ± 1365.33Aa 15.77 ± 0.97Ab Mg 0.4Al 2161.53 ± 297.57Ba 2987.80 ± 291.75Aab 1388.72 ± 43.03Bb 346.52 ± 15.37Bc 6884.56 ± 597.72Bb 18.87 ± 1.45Aa 0.4Al + H2S 2679.11 ± 76.29Ca 2869.31 ± 12.76Ab 1326.99 ± 29.76Bb 1384.29 ± 37.80Aa 8259.70 ± 93.16Ca 4.97 ± 0.21Bc 0.4Al + PAG 2551.51 ± 378.60Ba 3266.05 ± 76.24Aa 2152.37 ± 144.18Aa 497.68 ± 22.78Ab 8467.61 ± 526.12ABa 16.04 ± 1.39Ab 2Al 3203.55 ± 83.10Aa 2612.19 ± 216.71Ab 1578.27 ± 51.43Ab 924.90 ± 98.81Ab 8318.92 ± 253.97Ac 8.06 ± 0.95Bb 2Al + H2S 3307.60 ± 162.06Aa 3142.00 ± 338.93Aa 1660.00 ± 103.48Ab 1322.66 ± 58.80Aa 9432.27 ± 159.11Aa 6.14 ± 0.43Ab 2Al + PAG 3089.27 ± 163.42Aa 3290.93 ± 108.91Aa 1908.25 ± 31.93Ba 498.33 ± 39.52Ac 8786.78 ± 71.55Ab 16.70 ± 1.37Aa 4Al 3610.66 ± 446.66Aa 2809.35 ± 171.88Aa 1442.35 ± 119.96ABb 954.41 ± 122.46Ab 8816.77 ± 562.41Aa 8.30 ± 0.78Bb 4Al + H2S 3059.80 ± 57.45Bb 2752.72 ± 222.97Aa 1561.74 ± 53.55Ab 1284.43 ± 54.96Aa 8658.69 ± 280.14Ba 5.74 ± 0.13Ab 4Al + PAG 2707.61 ± 5.02ABb 2584.47 ± 406.13Ba 2072.19 ± 16.34ABa 387.73 ± 33.22Bc 7752.01 ± 387.21Bb 19.12 ± 2.39Aa Zn 0.4Al 8.70 ± 1.12Ca 12.22 ± 1.13Ba 18.92 ± 1.49Bb 23.29 ± 1.72Bc 63.12 ± 2.34Bc 1.72 ± 0.14Aa 0.4Al + H2S 11.58 ± 3.00Ca 14.66 ± 2.74Aa 20.42 ± 2.36Bb 82.47 ± 4.76Ca 129.13 ± 5.16Ba 0.57 ± 0.04Bc 0.4Al + PAG 9.33 ± 1.22Ca 12.43 ± 0.50Ba 25.11 ± 0.62Ba 59.10 ± 2.76Aa 105.96 ± 1.00Cb 0.80 ± 0.07Cb 2Al 13.68 ± 1.25Bab 14.98 ± 1.59ABa 27.60 ± 2.46Aa 74.61 ± 5.32Aa 130.86 ± 3.45Ab 0.76 ± 0.11Bb 2Al + H2S 15.49 ± 0.95Ba 16.72 ± 1.98Aa 26.31 ± 3.59ABa 123.25 ± 4.99Aa 181.77 ± 5.41Aa 0.48 ± 0.02Cc 2Al + PAG 11.80 ± 0.93Bb 20.59 ± 4.06Aa 30.27 ± 1.78Aa 55.57 ± 2.46Aa 118.24 ± 3.15Bc 1.13 ± 0.07Aa 4Al 17.09 ± 2.08Ab 18.44 ± 4.07Aa 29.14 ± 2.30Aa 82.54 ± 7.89Aa 147.20 ± 14.19Ab 0.78 ± 0.09Ba 4Al + H2S 21.37 ± 0.92Aa 17.90 ± 0.30Aa 31.47 ± 5.39Aa 101.06 ± 5.07Aa 171.80 ± 9.69Aa 0.70 ± 0.02Aa 4Al + PAG 14.61 ± 1.07Ab 13.16 ± 0.38Bb 33.98 ± 3.70Aa 67.89 ± 9.40Aa 129.63 ± 7.39Ab 0.93 ± 0.19ABa Mn 0.4Al 434.54 ± 49.93Bb 545.22 ± 57.44Ab 166.17 ± 11.21Ab 134.39 ± 12.51Cc 1280.32 ± 34.67Cc 8.60 ± 1.20Aa 0.4Al + H2S 331.68 ± 11.06Cb 877.57 ± 9.52Aa 344.66 ± 11.87Ba 754.57 ± 31.78Ab 2308.49 ± 11.48Bb 2.06 ± 0.12Bb 0.4Al + PAG 834.44 ± 114.52Aa 550.37 ± 95.76Ab 133.36 ± 16.66Ac 4346.17 ± 226.23ABa 5864.34 ± 188.71Aa 0.35 ± 0.03Bc 2Al 580.86 ± 12.29Ac 493.94 ± 29.55Ac 140.13 ± 9.00Bb 331.60 ± 27.71Bc 1546.53 ± 53.41Bc 3.68 ± 0.26Ba 2Al + H2S 725.34 ± 47.40Ab 812.18 ± 82.33Aa 441.12 ± 40.94Aa 700.79 ± 23.40Bb 2679.43 ± 33.48Ab 2.83 ± 0.08Ab 2Al + PAG 928.92 ± 45.21Aa 624.51 ± 22.29Ab 98.97 ± 8.63Ab 3967.98 ± 23.31Ba 5620.38 ± 56.40Aa 0.42 ± 0.01Ac 4Al 460.62 ± 66.33Bb 555.60 ± 64.32Ac 177.93 ± 12.21Ab 556.44 ± 62.27Ab 1750.59 ± 105.01Ab 2.16 ± 0.17Cb 4Al + H2S 628.13 ± 14.12Ba 689.53 ± 39.43Ba 276.52 ± 2.49Ca 555.42 ± 21.57Cb 2149.60 ± 47.85Cb 2.87 ± 0.16Aa 4Al + PAG 435.88 ± 72.96Bb 601.91 ± 11.98Aab 107.04 ± 23.12Ac 4802.02 ± 610.68Aa 5946.86 ± 651.79Aa 0.24 ± 0.02Cc Fe 0.4Al 83.08 ± 8.24Bc 228.98 ± 29.41Ab 116.78 ± 11.68Ab 212.67 ± 18.38Cc 641.51 ± 8.04Bc 2.03 ± 0.29Aa 0.4Al + H2S 142.21 ± 15.79Aa 399.33 ± 0.52Aa 292.37 ± 11.60Aa 401.46 ± 66.03Ab 1235.37 ± 78.04Ab 2.11 ± 0.34Aa 0.4Al + PAG 111.92 ± 8.22Bb 230.35 ± 33.40ABb 110.94 ± 14.25Ab 956.68 ± 72.57Aa 1409.89 ± 74.53Ba 0.48 ± 0.04Ab 2Al 147.45 ± 5.50Ab 207.06 ± 16.44Aa 122.89 ± 29.28Aa 702.60 ± 109.64Ab 1180.00 ± 150.22Ab 0.69 ± 0.07Ba 2Al + H2S 130.75 ± 8.31Ab 257.56 ± 31.45Ba 136.29 ± 7.22Ca 521.81 ± 202.62Ab 1046.41 ± 198.89Ab 1.13 ± 0.50Ba 2Al + PAG 216.42 ± 11.66Aa 266.43 ± 43.53Aa 110.46 ± 8.78Aa 1110.40 ± 18.95Aa 1703.70 ± 19.91Aa 0.53 ± 0.04Aa 4Al 134.64 ± 13.60Ab 208.35 ± 12.59Ab 105.13 ± 5.55Ab 534.53 ± 88.15Bb 982.65 ± 96.52Ab 0.85 ± 0.16Bb 4Al + H2S 145.29 ± 2.86Ab 270.95 ± 21.28Ba 201.43 ± 16.05Ba 368.04 ± 37.29Ab 985.70 ± 44.68Ab 1.69 ± 0.16ABa 4Al + PAG 230.61 ± 38.35Aa 163.31 ± 45.36Bb 103.44 ± 3.47Ab 944.38 ± 142.73Aa 1441.74 ± 137.29Ba 0.54 ± 0.14Ac Values are the mean ± SD (n = 3). Different lowercase letters represent significant differences among different H2S conditions under the same Al concentration treatment, and different uppercase letters represent significant differences among different Al concentration treatments under the same H2S condition (p < 0.05), as determined by the Duncan test. Content of Mg in young leaves were found to significantly inhibited only in H2S + 4Al and PAG + 4Al compared to 4Al, but there was no significant change in content of Mg between treatments at only 4Al in mature leaves (Table 3). The application of exogenous PAG contributed to increase in content of Mg in stems, but H2S had a small effect on the level of Mg compared to Al alone in stems (Table 3). However, H2S significantly increased Mg levels in roots (Table 3). It was found that the change in total content of Mg was not significant under H2S + 4Al compared to 4Al, while content of Mg under other H2S + Al treatments significantly increased compared to Al alone (Table 3). However, the TF of Mg was inhibited by 73.66% under H2S + 0.4Al compared to 0.4Al, 23.82% under H2S + 2Al compared to 2Al, and 30.84% under H2S + 4Al compared to 4Al (Table 3).
It was demonstrated that H2S promoted an increase in content of Zn in different tissues (Table 3). Meanwhile, the total content of Zn also showed that H2S-pretreated significantly promoted the accumulation of Zn in C.sinensis. The effects of H2S and PAG on TF of Zn under different Al concentrations were also inconsistent. Significantly inhibited TF of Zn was observed in exogenous H2S or PAG followed by 0.4Al, however, TF of Zn showed significant performance as PAG + 2Al > 2Al > H2S + 2Al, but there was no significant difference in the effect of exogenous H2S or PAG on TF of Zn at 4Al (Table 3).
Content of Mn further increased after applying H2S + 2Al and H2S + 4Al to young leaves, while content of Mn was decreased but not significant in H2S + 0.4 Al compared with simple Al treatment (Table 3). It was H2S + Al that dramatically increased Mn levels compared to Al in mature leaves, consistent with the performance in stems (Table 3). In roots, it was PAG + Al that showed a significant increase in content of Mn compared to Al, and H2S significantly promoted an increase in Mn only at 0.4Al and 2Al (Table 3). It is interesting to note that total content of Mn was similar to the content of Mn under each treatment in roots (Table 3). The early application of PAG increased the accumulation of total Mn in tea plants compared to Al alone, but its TF was significantly inhibited, with TF of Mn at 0.4Al was 24.57 times that of H2S + 0.4Al, 2Al was 8.76 times that of H2S + 2Al, and 4Al was nine times that of H2S + 4Al.
Exogenous H2S followed by 0.4Al resulted in a remarkable increase in the content of Fe in young leaves, but the effect of H2S on content of Fe was not significant at 2Al and 4Al, whereas PAG showed a significant increase in content of Fe (Table 3). H2S also increased content of Fe in mature leaves at various Al concentrations, as well as in stems (Table 3). Whereas, exogenous PAG significantly increased content of Fe in roots, and the total content of Fe was also significantly affected by exogenous PAG (Table 3). Under different Al concentrations, H2S + Al exhibited a promotion of Fe-TF, while PAG + Al inhibited TF of Fe (Table 3).
Observation of ultrastructure under different treatments
-
A clear cell membrane could be seen in normal Al concentration, and the well-developed chloroplast having regular arrangements of thylakoid membranes could also be observed (Fig. 3a). At the same time, no osmiophilic granules (OG) were present in chloroplasts under H2S + 0.4Al (Fig. 3b), but application of PAG + 0.4Al led to appearance of OG in chloroplasts (Fig. 3c). Under stress of 2Al, the chloroplast membranes (PE) were still visible, but OG appeared (Fig. 3d), H2S reduced OG (Fig. 3e), and the early application of PAG generated more OG (Fig. 3f). Although, chloroplast structure was relatively intact, cells with scattered stromal lamellae under 4Al stress, and the stromal lamellar structure of H2S + 4Al loosened even more (Fig. 3g, h), with solubilization and even vacuolation occurring in PAG + 4Al (Fig. 3i).
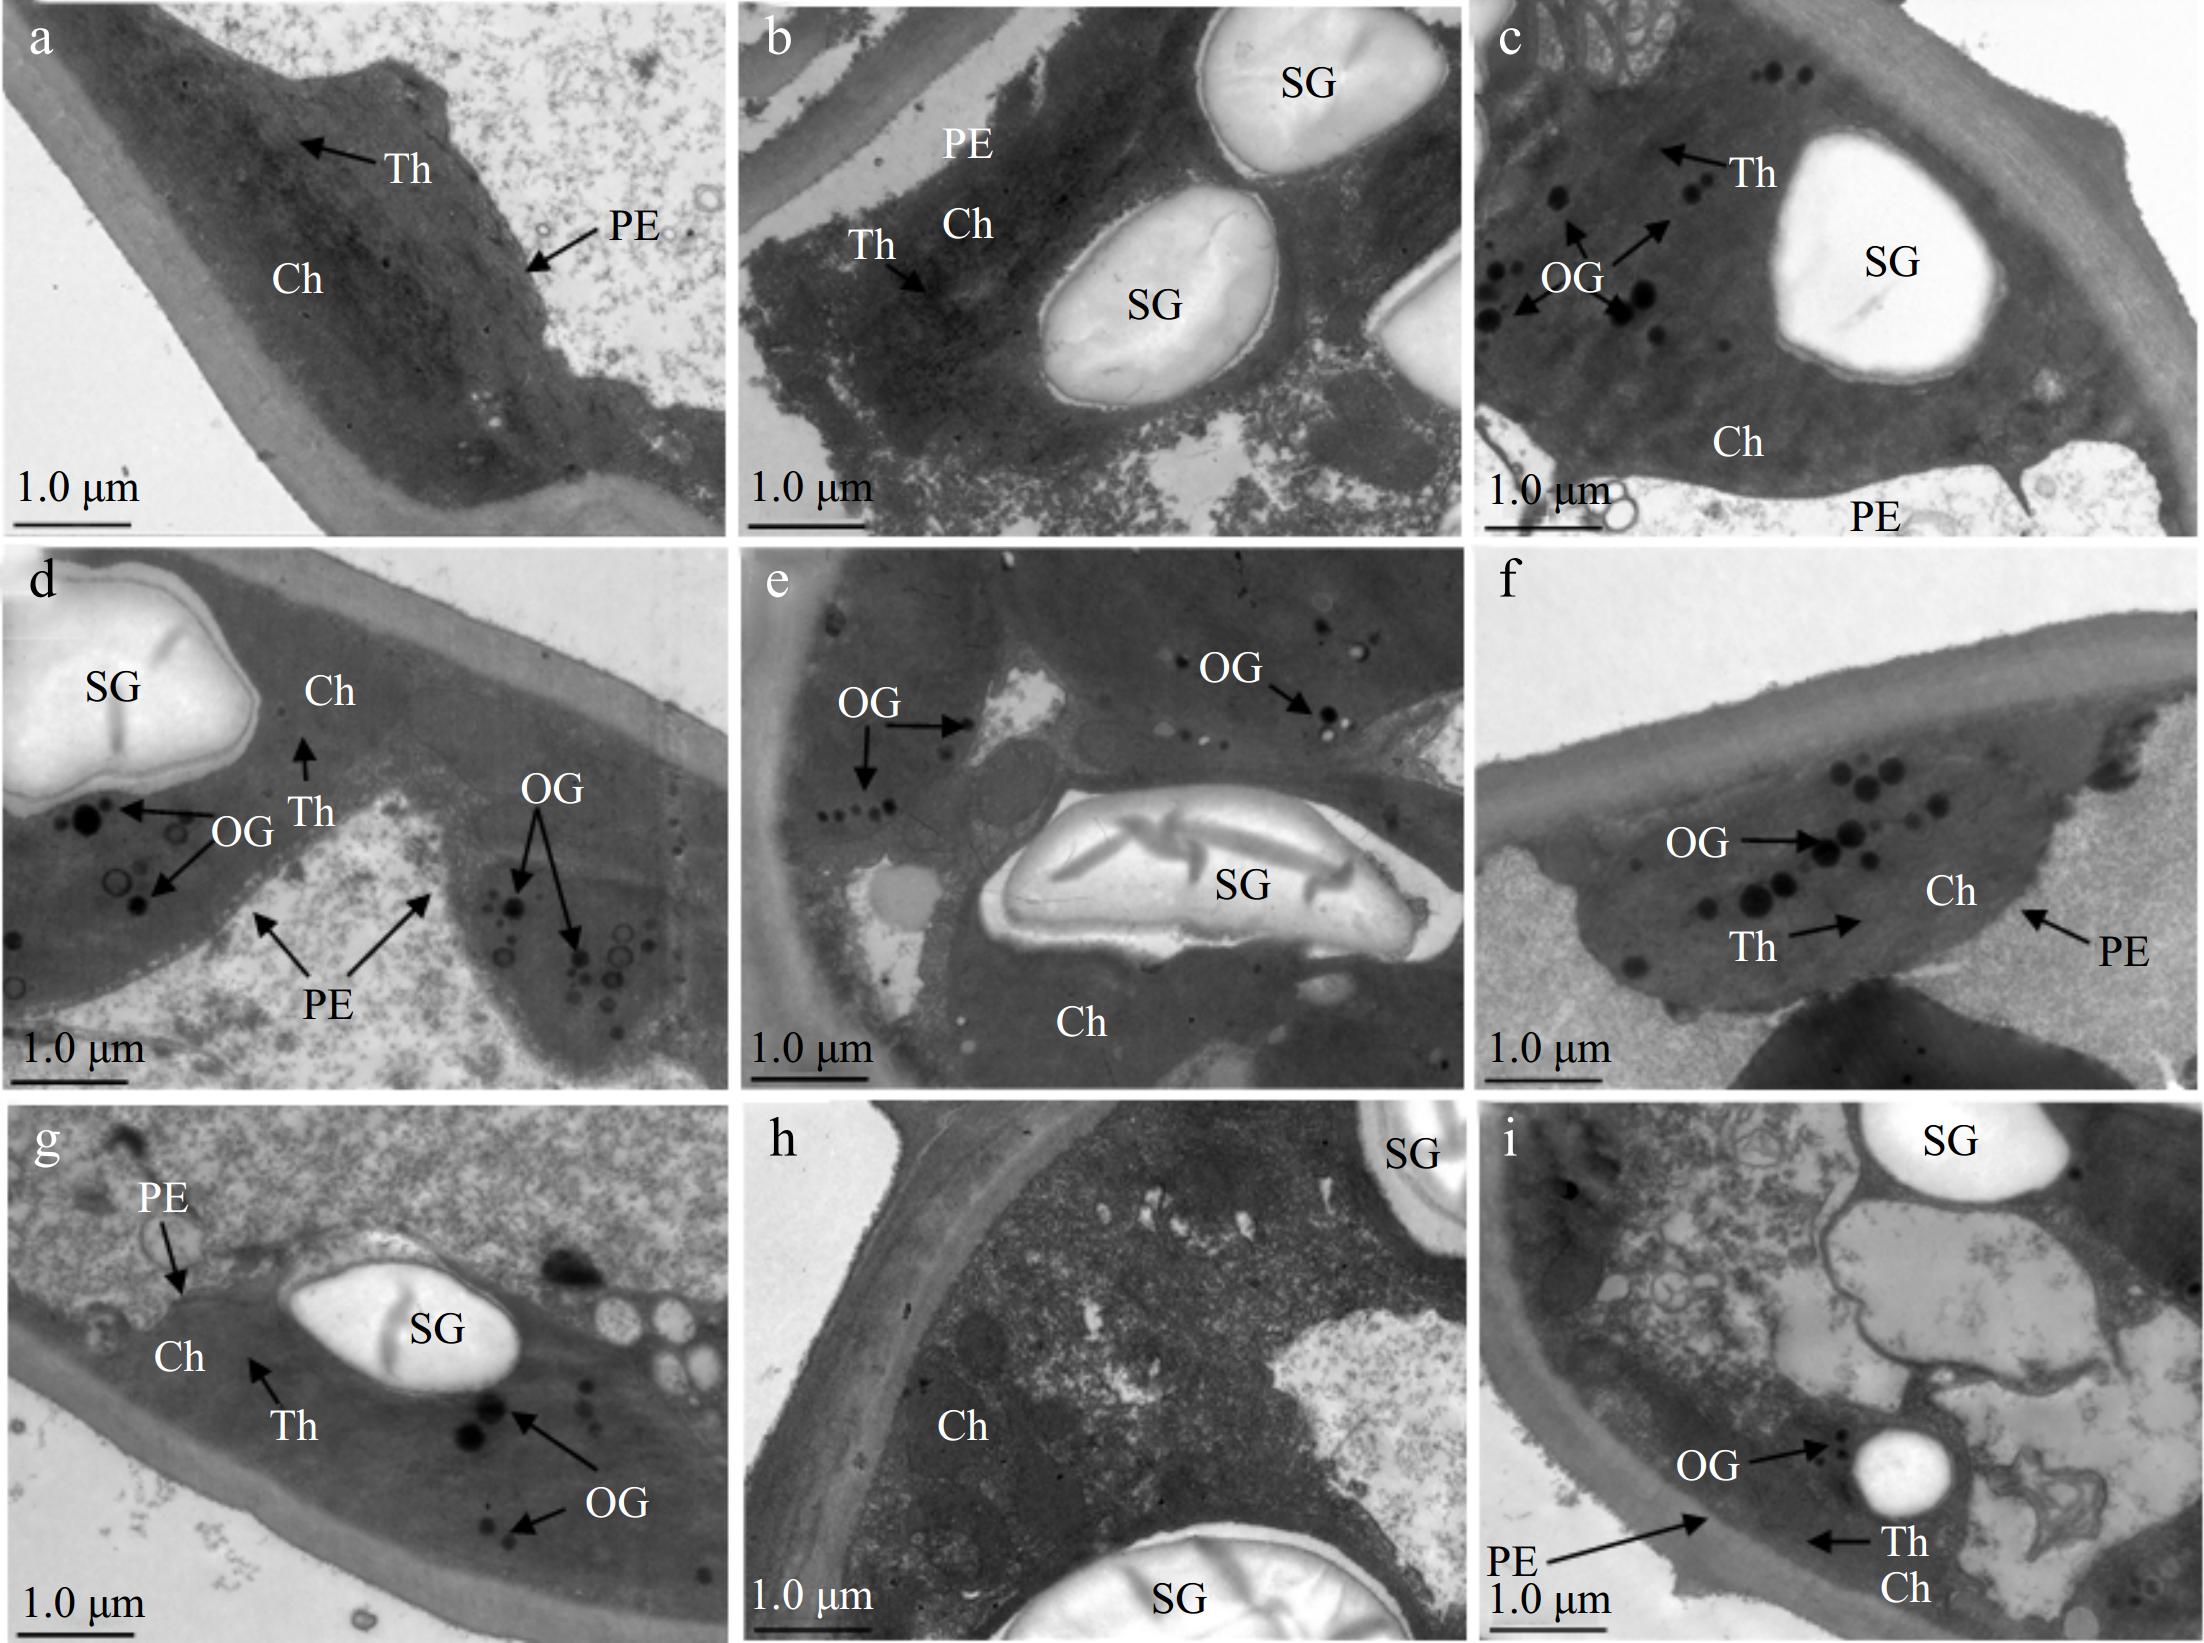
Figure 3.
Different changes in ultrastructure of C. sinensis after different treatments. (a) 0.4Al, (b) H2S + 0.4Al, (c) PAG + 0.4Al, (d) 2Al, (e) H2S + 2Al, (f) PAG + 2Al, (g) 4Al, h: H2S + 4Al, (i) PAG + 4Al. PE: chloroplast membrane, Ch: chloroplast, SG: starch granules, Th: matrix lamellae, OG: osmiophilic granule. Scale bar = 1.0 μm.
Chlorophyll content and photosynthetic parameters analysis
-
An increase was observed in chl a content under H2S as compared to Al treatment alone, however, reduction of chl a showed in exogenous PAG, and chl b content has the same performance (Fig. 4a, b). Furthermore, total chlorophyll content also has the same trend, and with the increase of Al concentration, the total chlorophyll content of H2S + Al increases by 21.15%, 11.59%, and 17.64% compared to Al, respectively (Fig. 4c). Nevertheless, the results of chl a/chl b showed the opposite, namely PAG + Al > Al > H2S + Al (Fig. 4d).
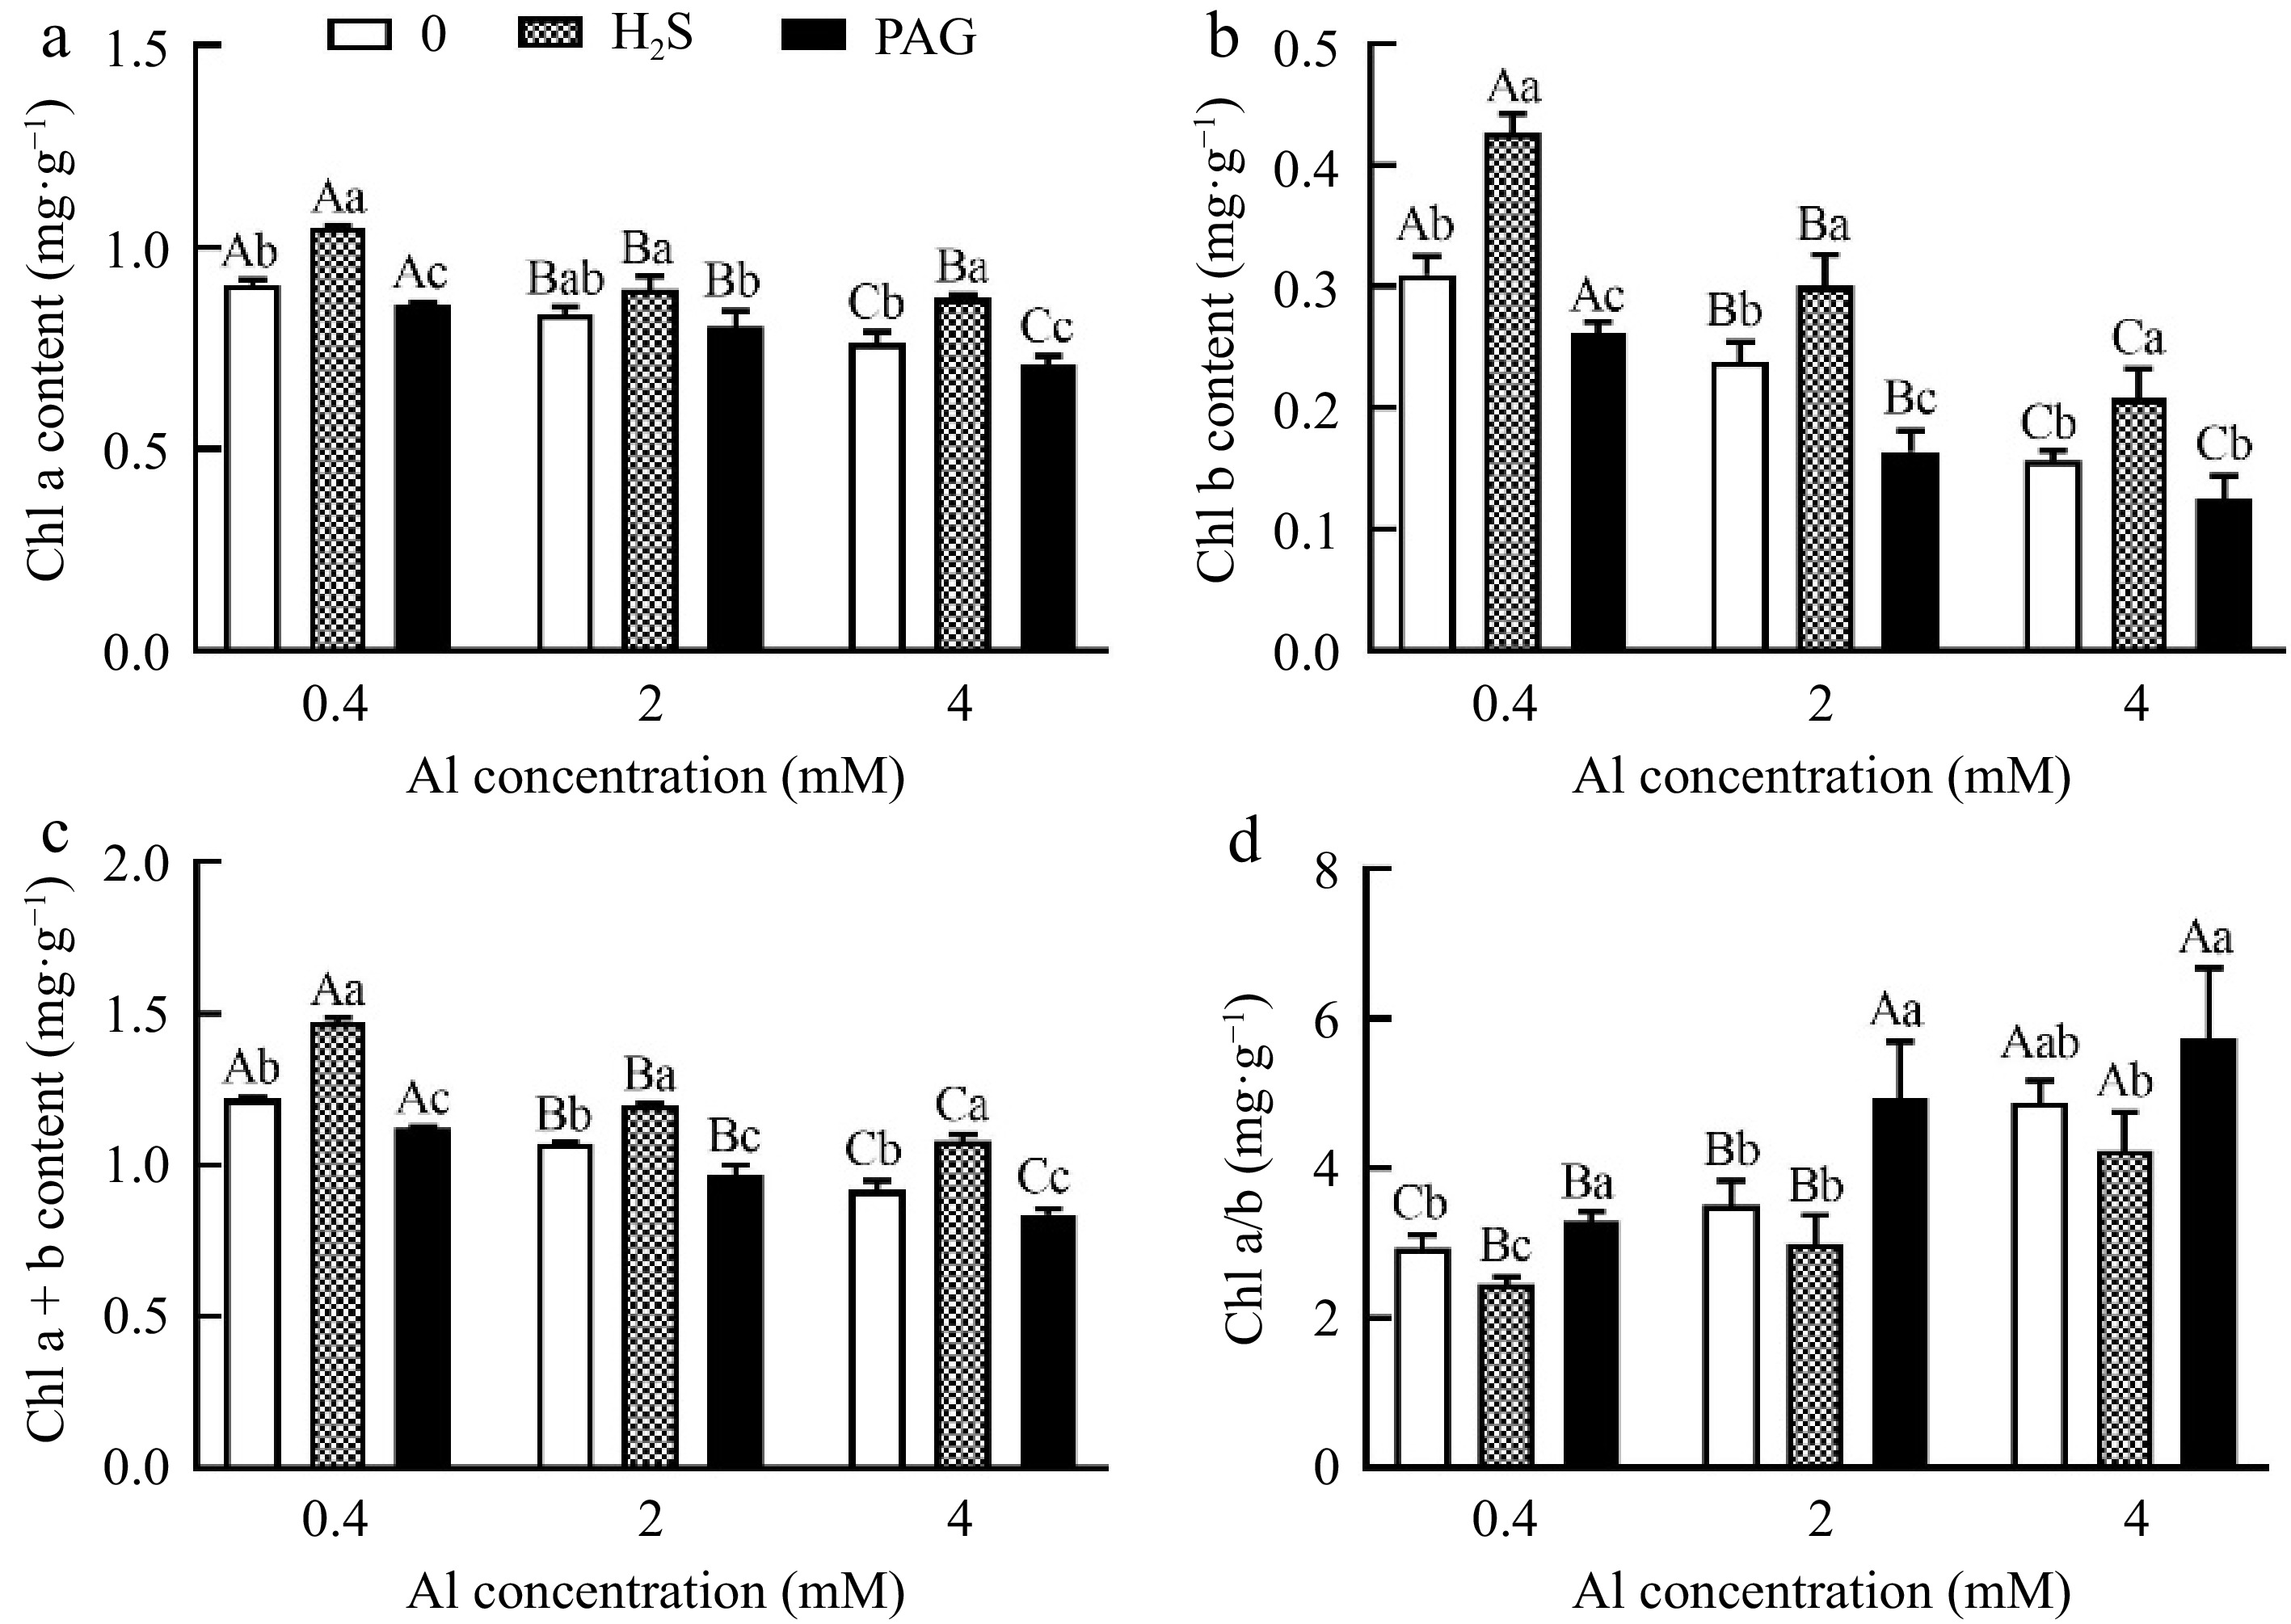
Figure 4.
Changes in chlorophyll content of C. sinensis after different treatments. Different lowercase letters represent significant differences among different H2S conditions under the same Al concentration treatment, and different uppercase letters represent significant differences among different Al concentration treatments under the same H2S condition (p < 0.05), as determined by the Duncan test.
Pn under 0.4Al was significantly promoted by application of H2S, but pretreatment with PAG significantly decreased Pn (Fig. 5a). Differently, the effect of applying H2S and PAG on Pn showed an opposite trend at 2Al, and exogenous application of H2S and PAG showed significant inhibition compared to 4Al alone (Fig. 5a). Gs showed a consistent trend at 0.4Al and 4Al, with H2S + Al > Al > PAG + Al (Fig. 5b). Ci were different under different treatments with different Al concentrations, namely H2S + 0.4Al > 0.4Al > PAG + 0.4Al, 2Al > H2S + 2Al > PAG + 2Al, and PAG + 4Al > 4Al > H2S + 4Al (Fig. 5c). The results of Tr under normal Al concentration were consistent with those of Pn, Gs and Ci, but at high concentrations of Al, they showed 2Al > PAG + 2Al > H2S + 2Al, 4Al > H2S + 4Al > PAG + 4Al, respectively (Fig. 5d). Tr agreed with Pn, Gs, Ci results at normal Al concentration, but exhibited 2Al > PAG + 2Al > H2S + 2Al and 4Al > H2S + 4Al > PAG + 4Al, respectively, at Al stress concentrations (Fig. 5).
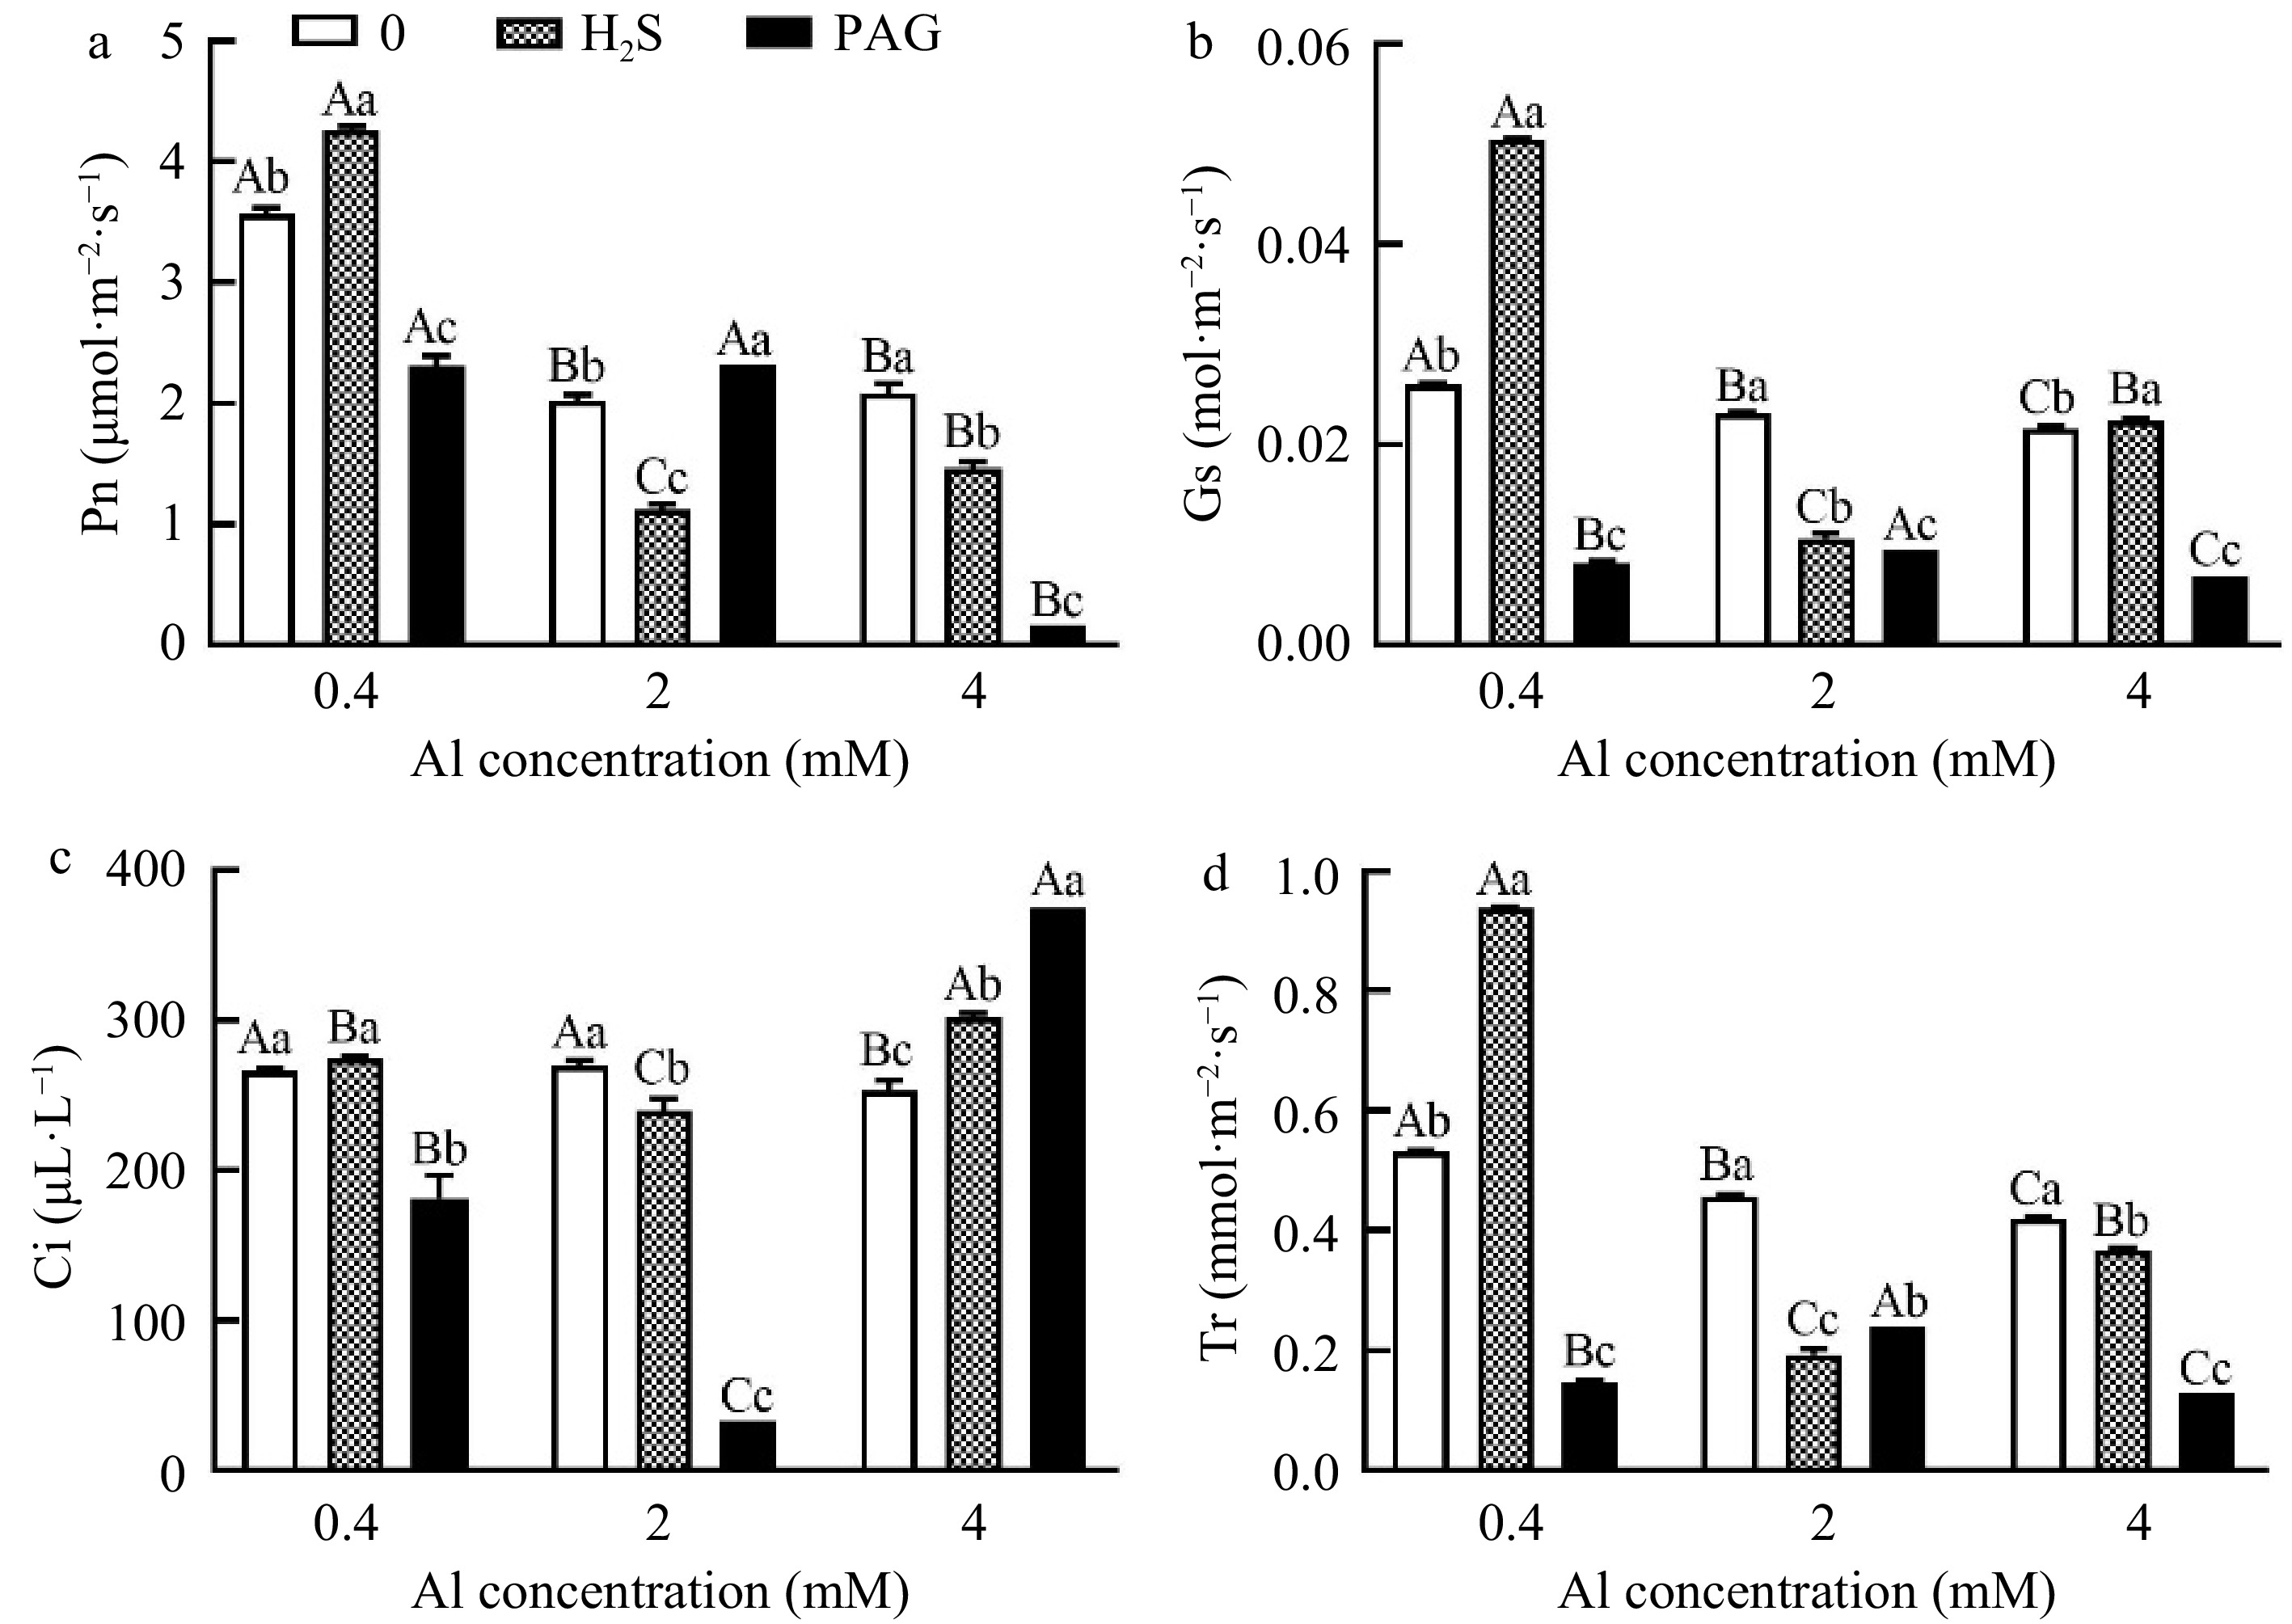
Figure 5.
Changes in photosynthetic parameters of C. sinensis under different treatments. Different lowercase letters represent significant differences among different H2S conditions under the same Al concentration treatment, and different uppercase letters represent significant differences among different Al concentration treatments under the same H2S condition (p < 0.05), as determined by the Duncan test.
Effects of H2S on Proline, MDA content and enzyme activity under Al conditions
-
Interestingly, MDA content in leaves of H2S pretreatment was inhibited by 3.61% compared to 2Al, whereas preincubation of PAG significantly increased MDA content (Fig. 6a). Proline content significantly accumulated in Al stress compared to 0.4Al, and its content increases by 2.82% under H2S + 2Al compared to 2Al, while pretreatment with H2S before 4Al treatment did not inhibit lipid peroxidation through proline content (Fig. 6b).
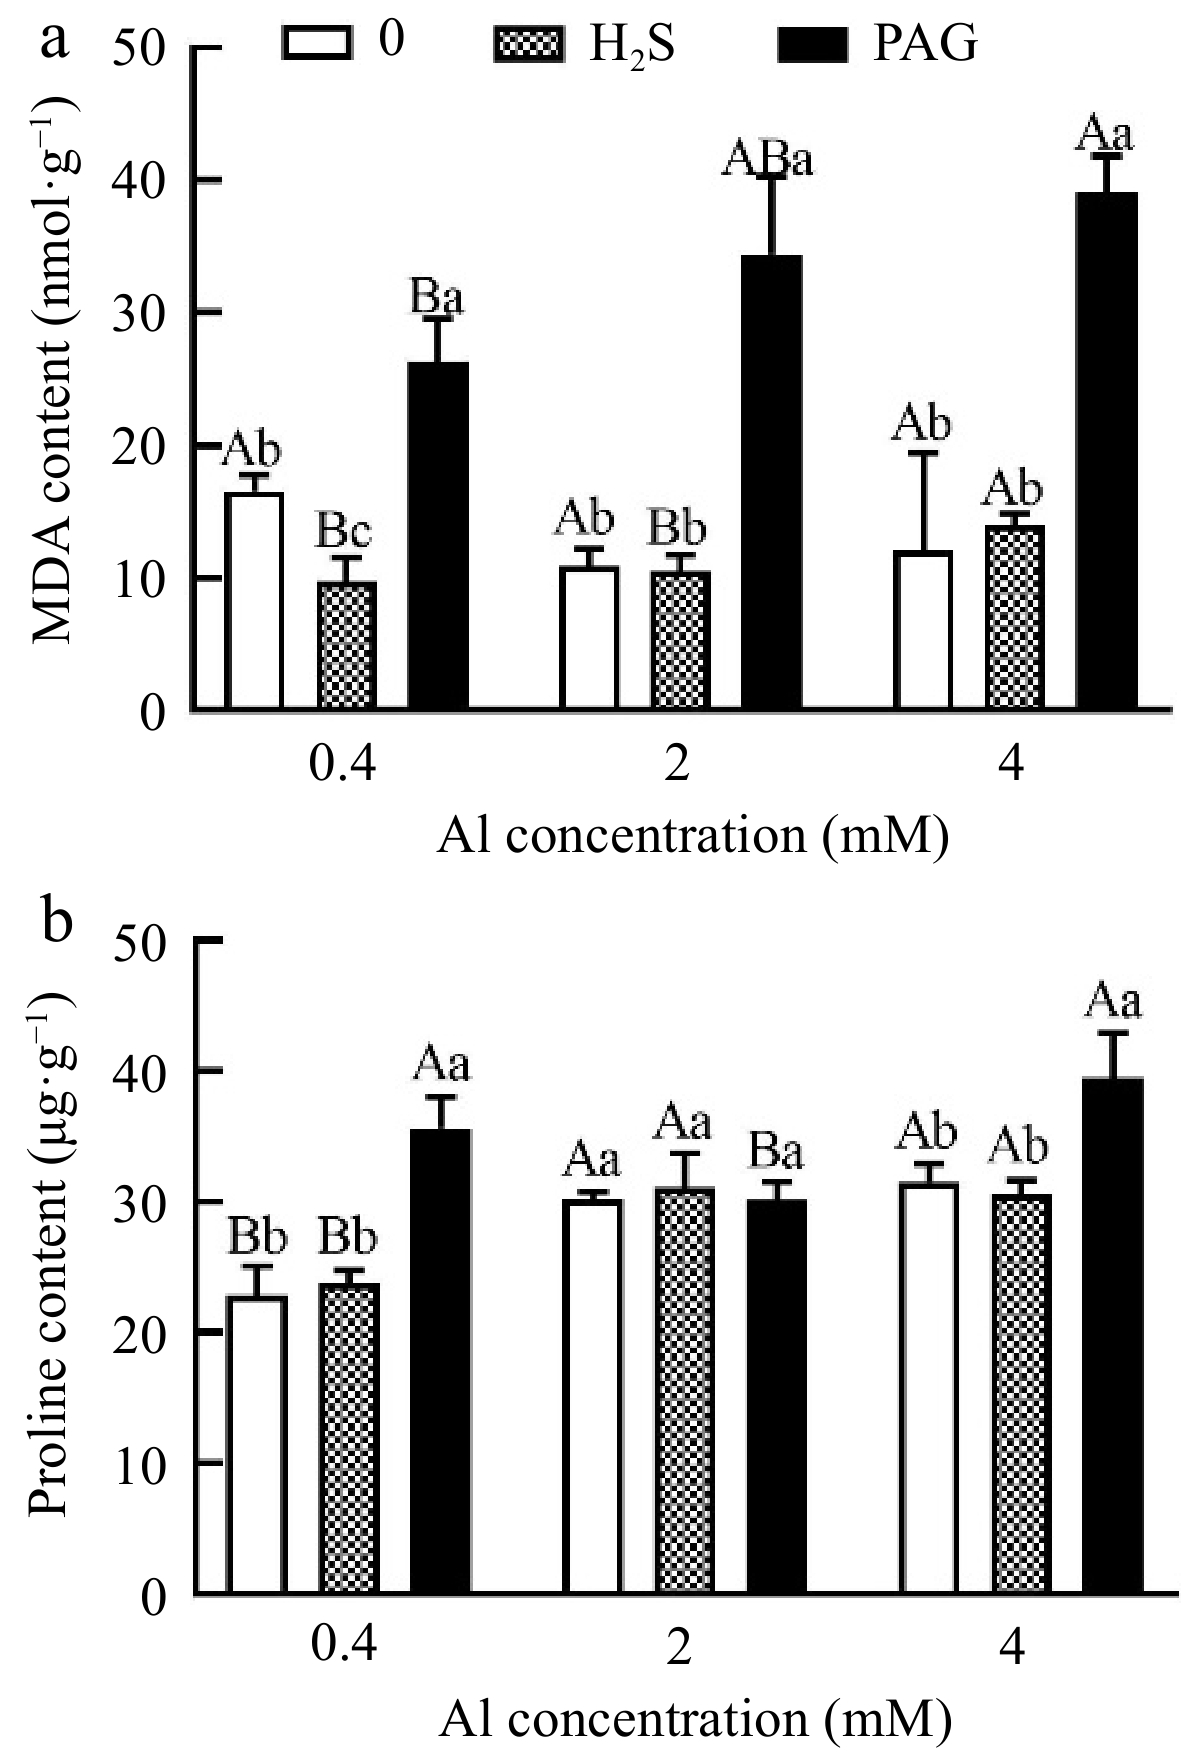
Figure 6.
The effect of different treatments on (a) MDA and (b) proline content in tea leaves. Different lowercase letters represent significant differences among different H2S conditions under the same Al concentration treatment, and different uppercase letters represent significant differences among different Al concentration treatments under the same H2S condition (p < 0.05), as determined by the Duncan test.
Similar tendency was observed in roots and leaves under normal Al, with H2S + 0.4Al compared to 0.4Al not significantly increasing CAT activity by 15% and 16.67%, respectively (Fig. 7a & b). CAT showed the highest activity of H2S + 2Al in leaves, but the lowest activity in roots under H2S + 2Al (Fig. 7a & b). And CAT activity of leaves at 4Al was higher than that of H2S + 4Al at 4Al and PAG + 4Al, while the CAT activity in roots treated with PAG + 4Al was higher than that of 4Al and H2S + 4Al (Fig. 7a & b).

Figure 7.
C. sinensis on antioxidant enzyme activities in (a), (c), (e) leaves and (b), (d), (f) roots with different treatments. Different lowercase letters represent significant differences among different H2S conditions under the same Al concentration treatment, and different uppercase letters represent significant differences among different Al concentration treatments under the same H2S condition (p < 0.05), as determined by the Duncan test.
Similarly, POD activity showed the same trend in roots and leaves only under normal Al, with POD activity in PAG + 0.4Al greater than that in 0.4Al and H2S + 0.4Al (Fig. 7c & d). Meanwhile, it is noteworthy that POD activity after H2S + 2Al is 3.56 times compared to 2Al in leaves, while the lowest POD activity was observed in the roots at H2S + 2Al, and the same was showed PAG + Al > Al > H2S + Al at 4 Al (Fig. 7c & d). However, there was no significant difference between the treatments at 4Al for the leaves (Fig. 7c).
Compared with 0.4Al treatment, H2S + 0.4Al treatment increased SOD activity in leaves and roots (Fig. 7e & f). However, there was no significant difference in SOD activity after applying H2S at 4 mM Al3+ in the roots and leaves (Fig. 7e & f).
But the application of H2S and PAG under 2Al conditions in leaves failed to stimulate the activity of SOD, and pretreatment with H2S or PAG in roots dramatically decreased the activity of SOD (Fig. 7e & f). Furthermore, there was no significant difference in SOD activity among different treatments at 4Al in leaves and roots (Fig. 7e & f).
GSH content in leaves under normal Al and 2Al all exhibited H2S + Al > Al > PAG + Al, but GSH exhibited Al > H2S + Al > PAG + Al in 4Al (Fig. 8a). The content of GSSG was decreased in PAG-treated at 0.4Al and 2Al, but was increased in PAG + 4Al cultures (Fig. 8b). Noteworthy, no significant change of GSH/GSSG was discovered when H2S or PAG was added together with Al treatment (Fig. 8c).
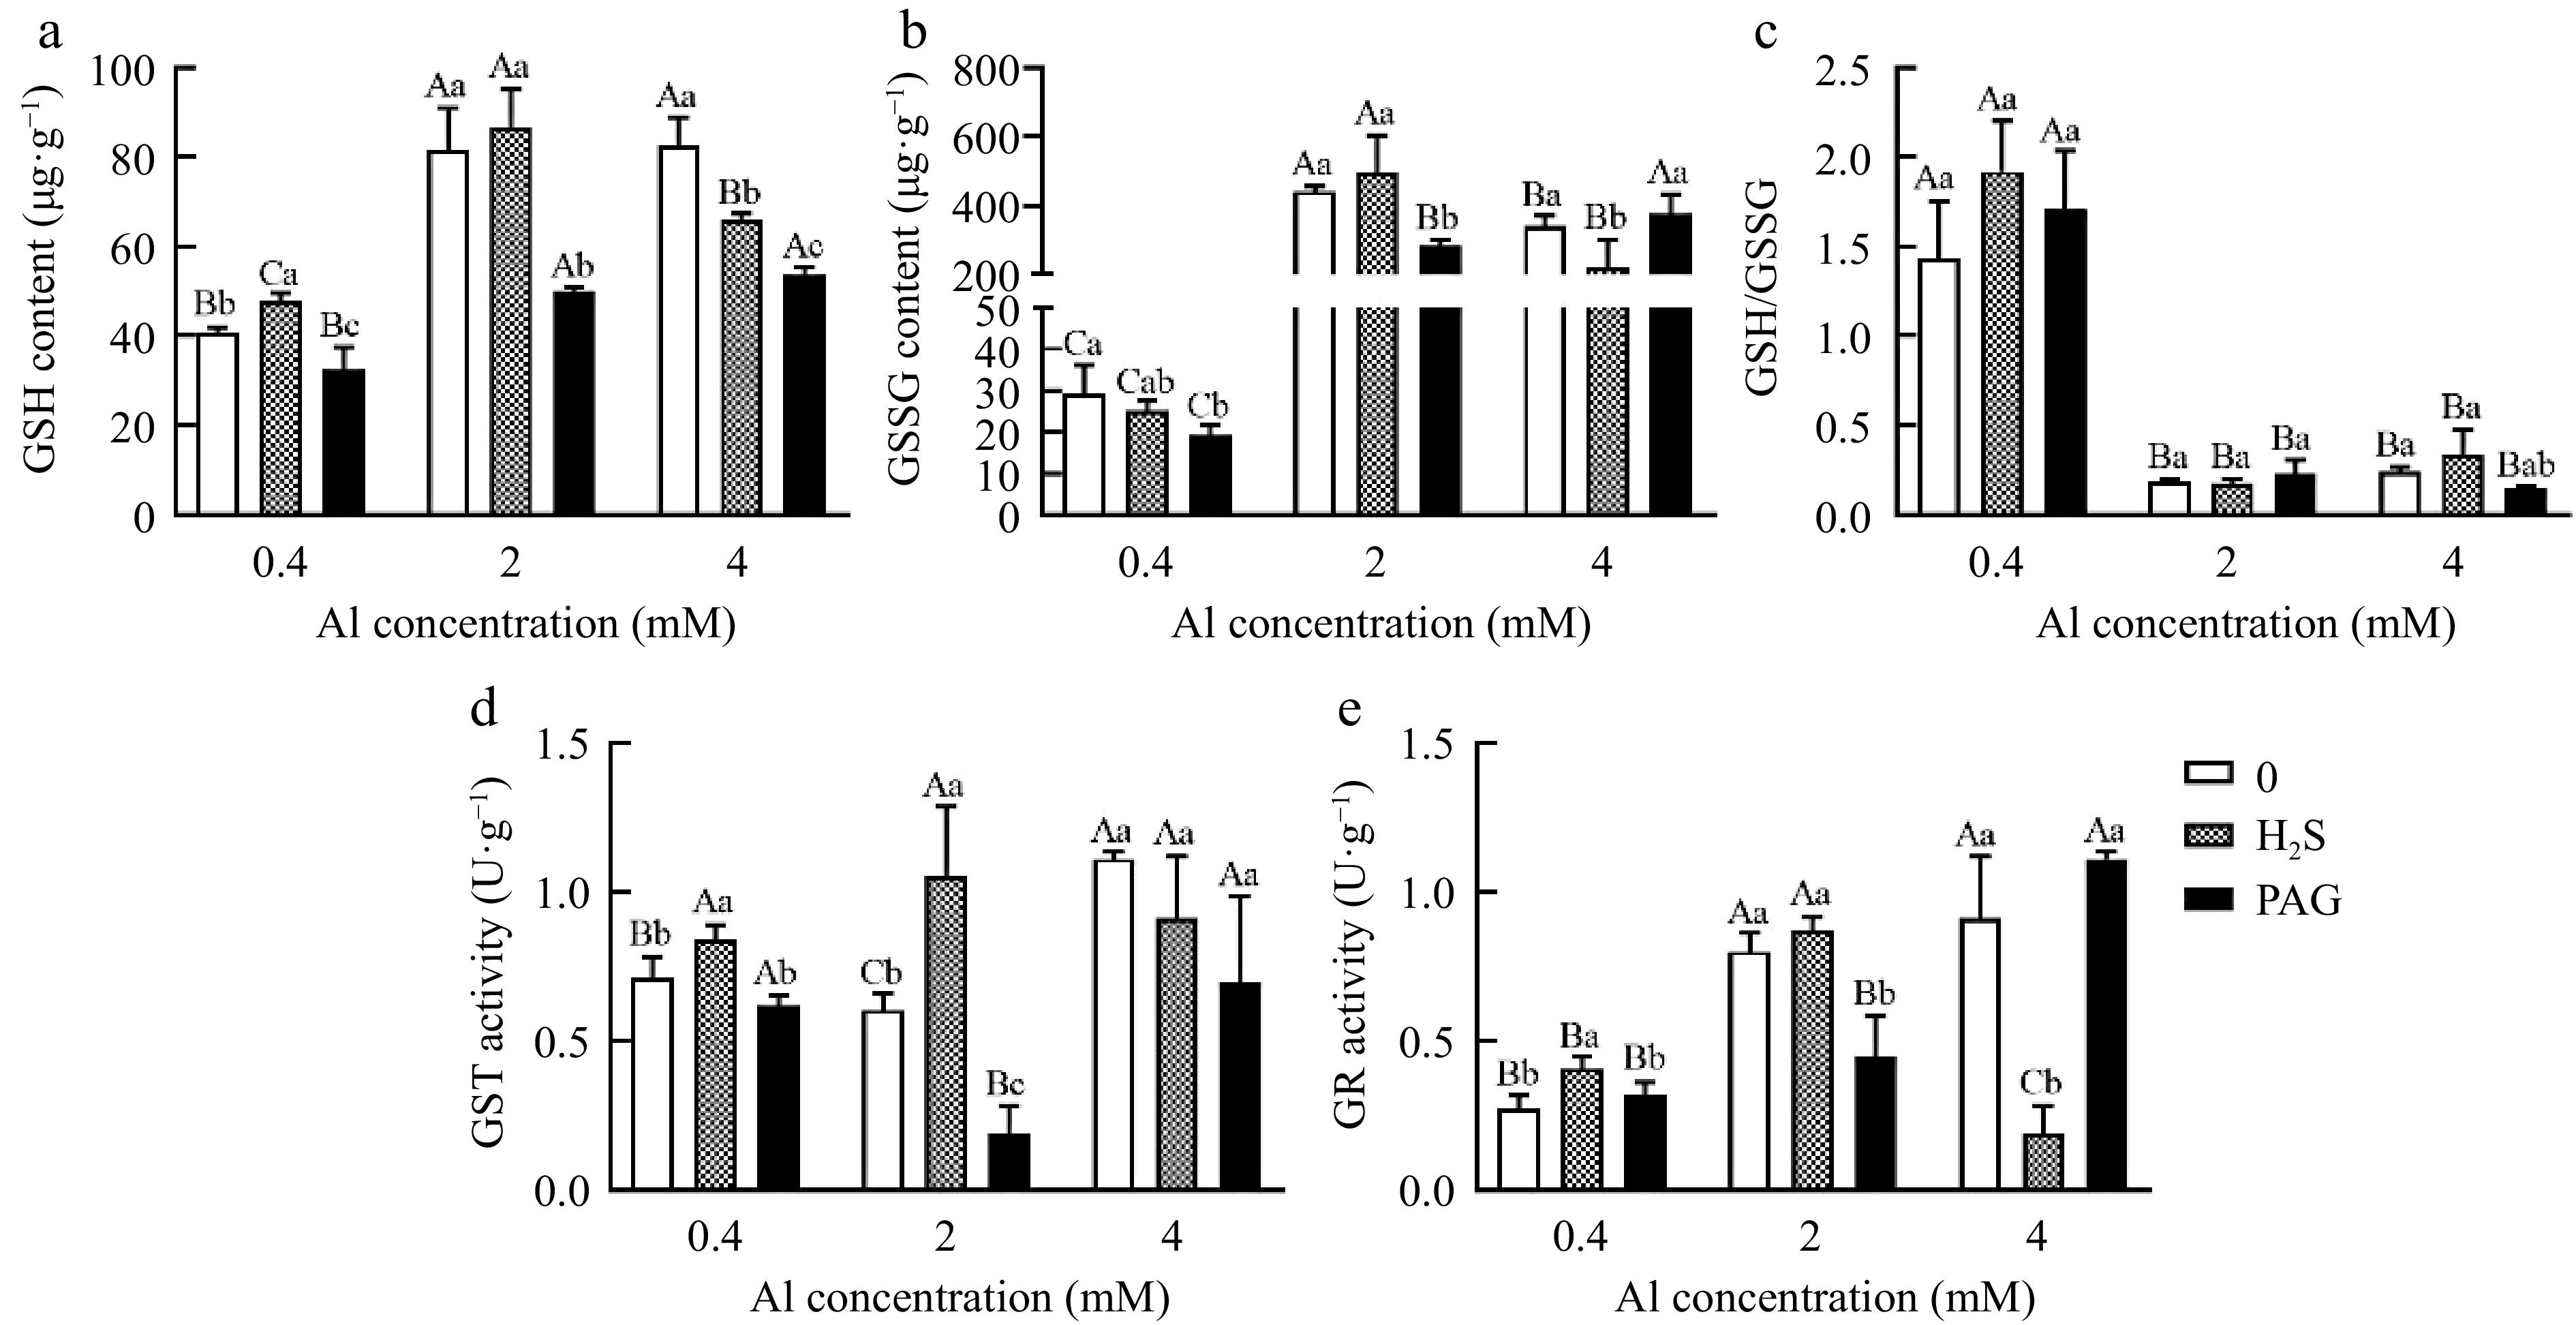
Figure 8.
Effect of different treatments on (a) GSH content, (b) GSSG content, (c) GSH/GSSG, (d) GST activity and (e) GR activity in tea leaves. Different lowercase letters represent significant differences among different H2S conditions under the same Al concentration treatment, and different uppercase letters represent significant differences among different Al concentration treatments under the same H2S condition (p < 0.05), as determined by the Duncan test.
It was found that GST activity in leaves was higher in H2S + 0.4Al than under 0.4Al and PAG + 0 .4Al treatments (Fig. 8d). And GST activity exhibited the highest in H2S + Al, followed by 2Al, and the lowest in PAG + 2Al. Unlike under 4Al where the activity of GST was inhibited by 4Al treatment with H2S and PAG, although the level of decrease was not significant (Fig. 8d).
Tea leaves exposed to H2S + 0.4Al treatment exhibited a significant increase of GR activity in comparison with 0.4Al alone and PAG + 0.4Al samples (Fig. 8e). PAG + 2Al and H2S + 4Al treatments had the lowest GR activity compared with 2Al and 4Al, respectively (Fig. 8e).
LCD activity only showed H2S + 0.4Al > 0.4Al > PAG + 0.4Al under normal Al concentration in leaves, and there was a significant difference among different treatments (Fig. 9a). However, the application of high concentration Al showed no significant difference under early application of H2S or PAG (Fig. 9a). What is different in root is that except for the insignificant difference in LCD activity between H2S + 2Al, 2Al and PAG + 2Al, all other groups showed significant differences, and LCD activity showed H2S + Al > Al > PAG + Al (Fig. 9b).
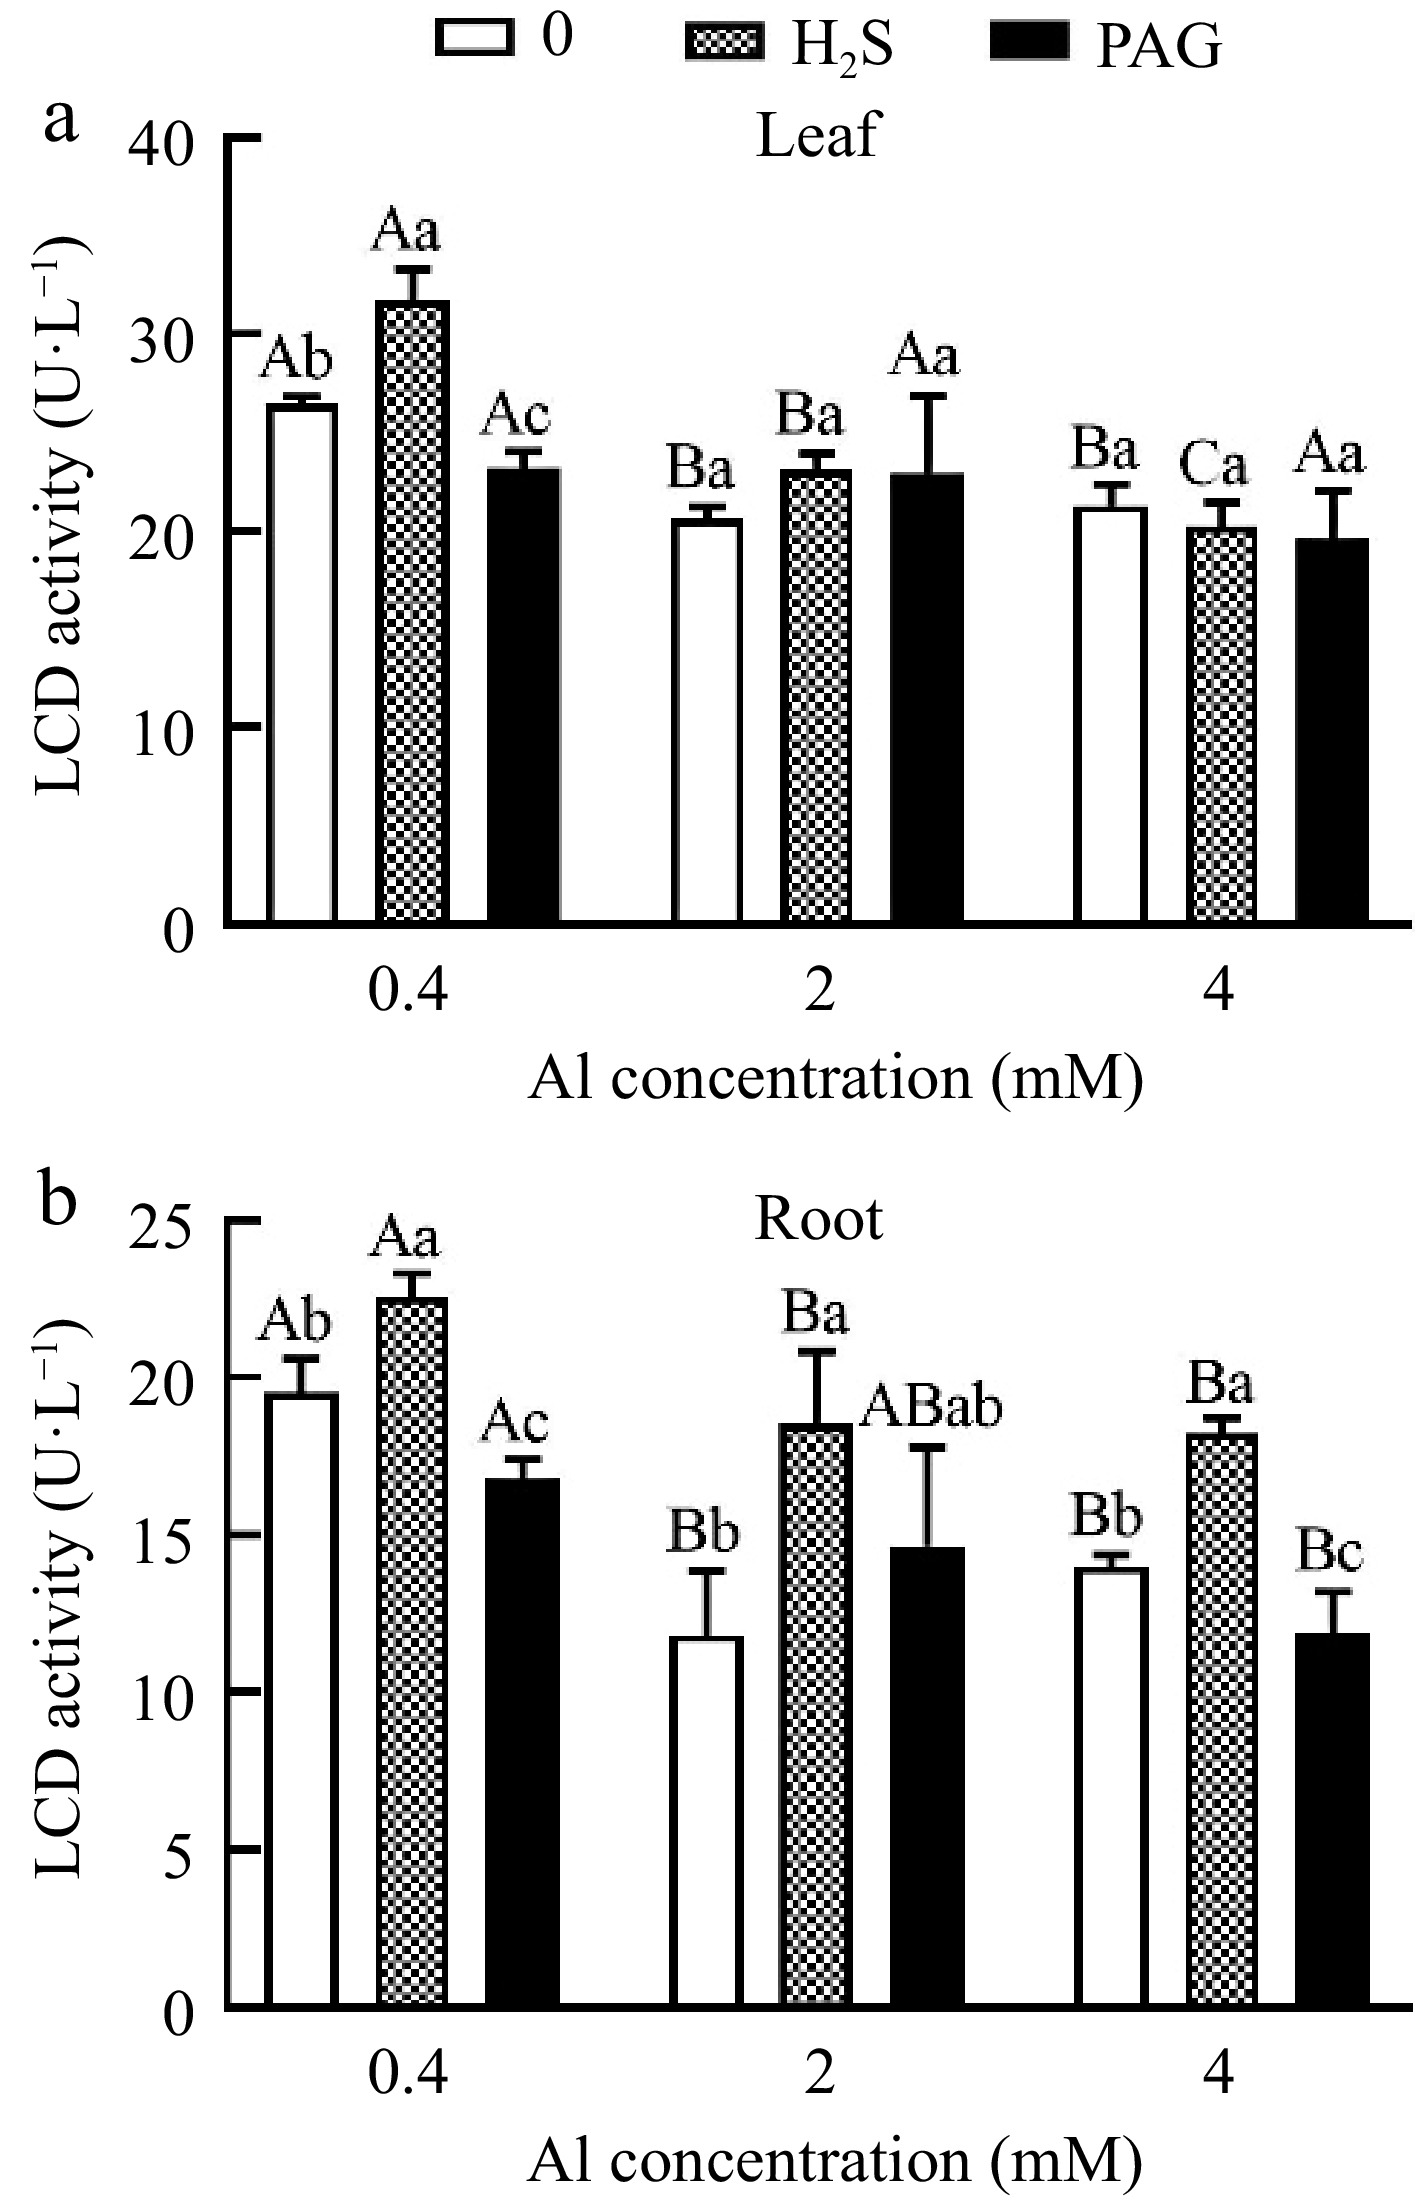
Figure 9.
C. sinensis on LCD activities in (a) leaves and (b) roots with different treatments. Different lowercase letters represent significant differences among different H2S conditions under the same Al concentration treatment, and different uppercase letters represent significant differences among different Al concentration treatments under the same H2S condition (p < 0.05), as determined by the Duncan test.
Response of tea components to different treatments
-
The synthesis of tea polyphenols was drastically promoted by H2S + 0.4Al, but slightly deduced by PAG + 0.4Al (Fig. 10a). Compared to 2Al, H2S + 2Al increased tea polyphenol content, while PAG + 2Al decreased tea polyphenol content, both of which were not significant (Fig. 10a). Similarly, the effects of various treatments based on 4Al on tea polyphenols were not significant (Fig. 10a).
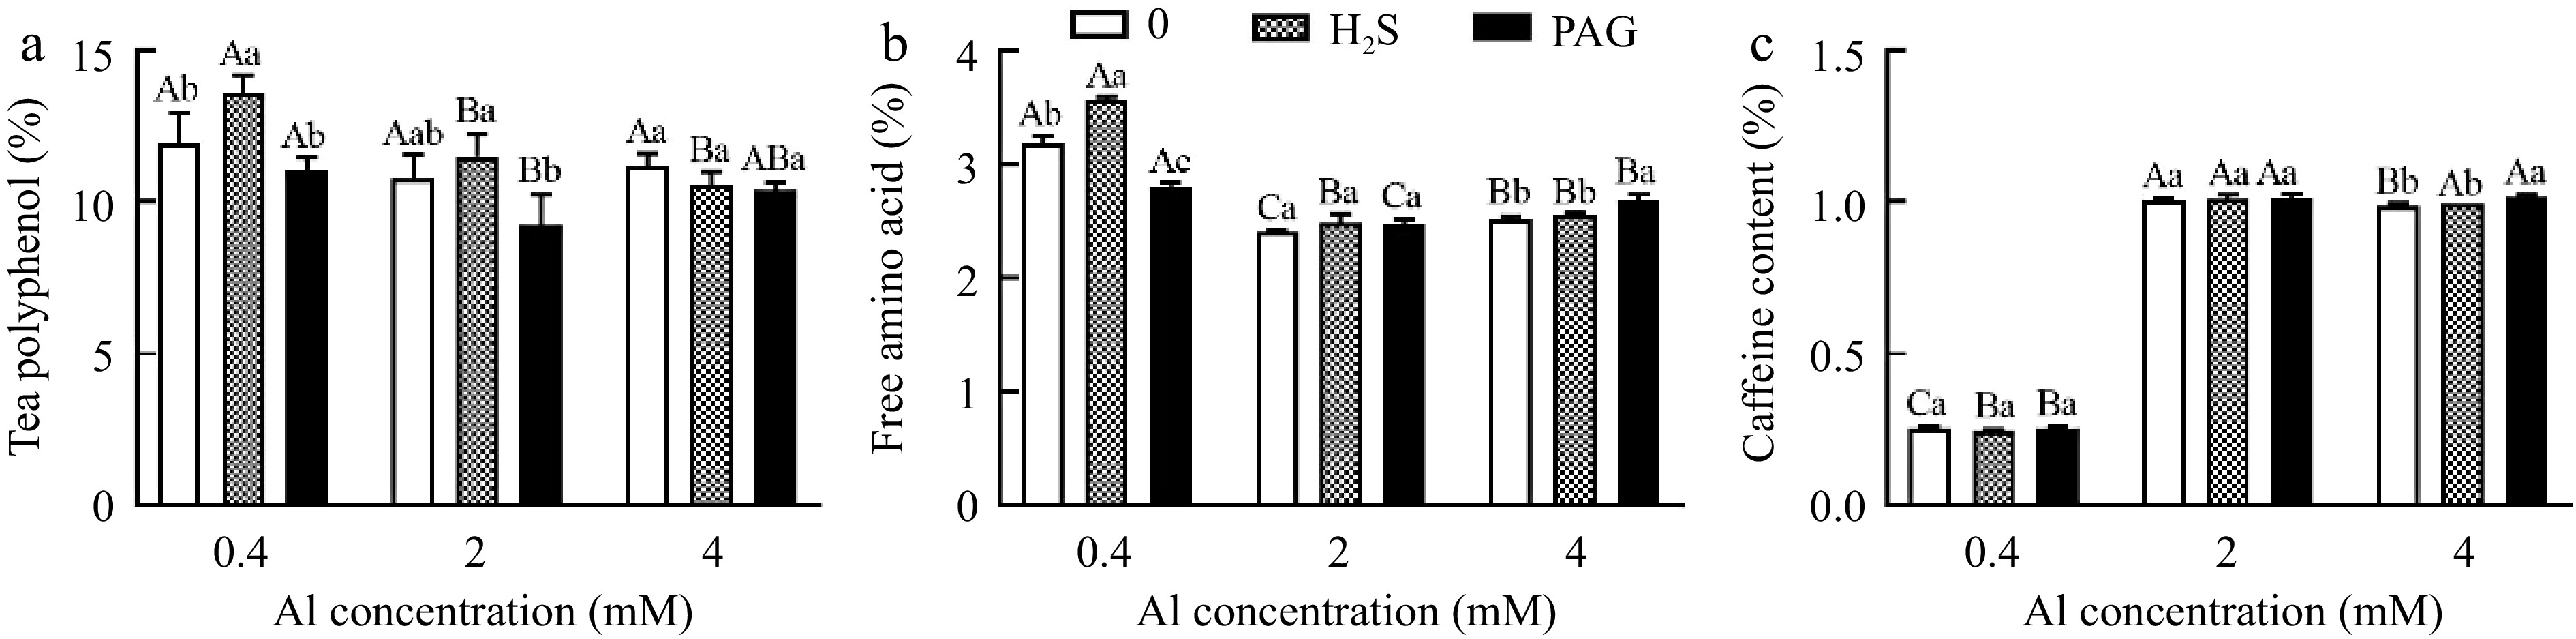
Figure 10.
The performance of (a) tea polyphenol, (b) free amino acid and (c) caffeine content in different treatments. Different lowercase letters represent significant differences among different H2S conditions under the same Al concentration treatment, and different uppercase letters represent significant differences among different Al concentration treatments under the same H2S condition (p < 0.05), as determined by the Duncan test.
H2S + 0.4Al treatment induced the highest content of amino acids after treatment, significantly higher than both Al and PAG + 0.4Al (Fig. 10b). H2S + 2Al and H2S + 4Al did not significantly affect the amino acid content when compared to 2Al and 4Al, respectively (Fig. 10b). With PAG + 0.4Al treatment, amino acid content increased compared to 0.4Al, but amino acid content inhibited in PAG + 4Al, and no significant difference between PAG + 2Al and 2Al (Fig. 10b).
Caffeine content at normal Al concentration showed no significant difference in caffeine content among H2S + 0.4Al, 0.4Al, PAG + 0.4Al. And H2S + 2Al, 2Al, PAG + 2Al were the same (Fig. 10c). The caffeine content only after being subjected to PAG + 4Al was greater than that of H2S + 4Al and 4Al (Fig. 10c).
Results showed that the most abundant one was epicatechin (EC), along with of epigallocatechin (EGC), epigallocatechin gallate (EGCG), gallocatechin (GC), gallocatechin gallate (GCG), epicatechin gallate (ECG) and catechin (C) detected in tea leaves (Table 4). Compared to 0.4Al, H2S + 0.4Al increased the total catechin content by 9.48%, while H2S + 4Al has a 14.45% increase in total catechin content compared to 4Al (Table 4). In each component, GC and EGC under H2S + 2Al were increased compared to 2Al. C and EC contents can be generally stimulated under H2S + 0.4Al and PAG + 0.4Al, while C and EC contents were reduced by H2S + 4Al (Table 4). Although the contents of EGCG, ECG and GCG of ester catechins were relatively low, early application of H2S was still sufficient to stimulate an increase in EGCG, ECG, and GCG at 0.4Al and 2Al (Table 4). It was found that H2S + 0.4Al increased EGCG by 19.35% compared to 0.4Al, and H2S + 2Al increased EGCG by 8.70% compared to 2Al. Interestingly, even with early application of H2S, EGCG, ECG, and GCG were still repressed by 4Al (Table 4).
Table 4. Effect of different treatments on catechins in C. sinensis.
Treatment GC
(%)EGC
(%)C
(%)EC
(%)EGCG
(%)ECG
(%)GCG
(%)Total catechins (%) 0.4Al 0.81 ± 0.03Aa 2.92 ± 0.41Aa 0.24 ± 0.00Ab 3.68 ± 0.42Ab 0.93 ± 0.09Ab 0.38 ± 0.01Aa 0.62 ± 0.06Ab 9.81 ± 1.00Aa 0.4Al + H2S 0.80 ± 0.01Aa 2.91 ± 0.06Aa 0.248 ± 0.00Aa 4.30 ± 0.17Aa 1.11 ± 0.04Aa 0.39 ± 0.00Aa 0.73 ± 0.01Aa 10.74 ± 0.16Aa 0.4Al + PAG 0.82 ± 0.01Aa 2.44 ± 0.22Aa 0.25 ± 0.00Aa 3.95 ± 0.13Aab 0.94 ± 0.05Ab 0.37 ± 0.01Ab 0.59 ± 0.04Ab 9.61 ± 0.23Aa 2Al 0.76 ± 0.01Ba 2.30 ± 0.35Aa 0.24 ± 0.00Aa 3.44 ± 0.29Aa 0.92 ± 0.05Aa 0.37 ± 0.01Aa 0.60 ± 0.04Aa 9.41 ± 1.30Aa 2Al + H2S 0.79 ± 0.02Aa 2.80 ± 0.40Aa 0.24 ± 0.01Ba 3.35 ± 0.64Ba 1.00 ± 0.15ABa 0.37 ± 0.01Ba 0.62 ± 0.07Ba 8.91 ± 0.76ABa 2Al + PAG 0.76 ± 0.04Ba 2.58 ± 0.31Aa 0.24 ± 0.00Ba 3.76 ± 0.62Aa 1.06 ± 0.17Aa 0.38 ± 0.01Aa 0.67 ± 0.09Aa 9.91 ± 1.19Aa 4Al 0.75 ± 0.02Ba 2.31 ± 0.45Aab 0.24 ± 0.01Aa 3.59 ± 0.81Aab 0.96 ± 0.11Ab 0.37 ± 0.01Aa 0.57 ± 0.06Ab 7.82 ± 0.03Aab 4Al + H2S 0.77 ± 0.02Aa 2.11 ± 0.09Bb 0.23 ± 0.00Bb 2.75 ± 0.04Bb 0.82 ± 0.03Bb 0.36 ± 0.00Ca 0.53 ± 0.01Bb 8.95 ± 1.57Bb 4Al + PAG 0.76 ± 0.01Ba 2.80 ± 0.32Aa 0.25 ± 0.00Aa 4.11 ± 0.51Aa 1.16 ± 0.11Aa 0.33 ± 0.00Bb 0.70 ± 0.04Aa 10.26 ± 0.99Aa Data are mean values ± SD (n = 3). Different lowercase letters represent significant differences among different H2S conditions under the same Al concentration treatment, and different uppercase letters represent significant differences among different Al concentration treatments under the same H2S condition (p < 0.05), as determined by the Duncan test. -
It is easy to accumulate too much availability Al3+ in the rhizosphere environment of C. sinensis suitable for planting in acid soil. Al actually has been regarded as an essential element with dose‐dependent effect, which is first reflected in root growth and development[3]. Root growth is stimulated in low concentrations of Al, while in high concentrations of Al, growth of the root and the plant is delayed[21]. In the present study, we also demonstrated that the effects on root development was strongly dependent on the Al concentration, the root system was damaged and new roots failed to generate by Al stress concentration (Fig. 1a−i). At the same time, it showed that H2S broke the restriction of Al stress on root development, but PAG promoted the root development hindered by Al stress (Fig. 1a−i). Moreover, pre-treatment with H2S increased total FW, total DW and root activity of C. sinensis to cope with excessive Al inhibition (Fig. 1j & 2). Recent research has demonstrated that H2S alleviates the inhibition of plant growth under metal stress in various crop plant species, including mungbean[22], soybean[23] and Miscanthus sacchariflorus[24]. These results indicated that H2S can effectively alleviate the growth and development of C. sinensis under Al stress.
H2S promotes plant ion absorption of C. sinensis under Al stress
-
Maintaining constant intracellular ion homeostasis is crucial for plants adapting to stress environments. Most of Al in C. sinensis was contained in root after Al stress (Table 2), affecting the root growth attributes more than the shoot growth attributes, which ultimately limited the growth and development of plants. Similar results were also observed in previous studies[25,26]. H2S alleviated the enrichment of Al in roots and promoted the TF of Al under Al stress, while PAG increased the accumulation of Al and inhibited the TF of Al (Table 2). Moreover, H2S application helped to maintain ion homeostasis by accumulating Ca in mature leaves, Mg, Zn in root and Mn in above-ground parts and increasing the TF of Fe under Al stress (Table 3). It has also been reported that H2S improves nutrients uptake under Al stress[27]. The results showed that H2S directly mitigated inhibitory effect of Al toxicity on root growth by decreasing content of Al in root systems, thus pre-application of H2S promoted the root growth and development of C. sinensis. Therefore, an increased uptake of Ca, Mg, Zn and Mn has been explained as a consequence of the stimulation of root growth under H2S.
H2S enhances chlorophyll synthesis and ultrastructural stability under Al stress
-
We confirmed that excessive accumulation of Al disrupted ultrastructural and inhibited several processes, such as chlorophyll content and photosynthesis. Meanwhile, application of exogenous H2S enhanced chlorophyll content under Al stress conditions (Fig. 4), which was also reported by Ali et al.[27], who determined that H2S increased chlorophyll a and chlorophyll b by reducing damage to thylakoids in the chloroplast of Brassica napus. It is well known that the chlorophyll content and photosynthetic rate are closely correlated in plants. However, this result indicates that H2S failed to promote photosynthesis in C. sinensis under Al stress (Fig. 5), suggesting that H2S mitigates Al toxicity mainly through the increase of chlorophyll content and ultrastructural stabilization rather than regulating photosynthetic parameters.
H2S regulates the antioxidant system of C. sinensis to resist Al stress
-
Plants suffering from Al toxicity often exhibit symptoms associated with membrane lipid peroxidation, which result in accumulation of MDA[28]. As previously studied[29], the present results indicated that H2S reduce accumulation of MDA in leaves at 2Al (Fig. 6a). Proline participates in removal membrane lipid peroxidation under stress conditions[30]. However, using exogenous H2S at 2Al concentration only increases proline content in tea leaves by 2.82% compared to 2Al alone (Fig. 6b). CAT,POD and SOD are the main antioxidant enzymes in plants, all of which are involved in inhibition of oxidative stress and lipid peroxidation[31] in plants under excessive Al conditions, thus mitigating Al toxicity in plants[32]. CAT and POD played a role in the leaves under H2S + 2Al, because the activities of CAT and POD in H2S + 2Al were significantly higher than those in 2Al (Fig. 7a and 7c). There is also evidence indicating that H2S-induced alleviation in Al toxicity is attributed to elevated CAT and POD activities, but in barley roots[33]. At the same time, H2S + 2Al and H2S + 4Al reduced CAT, POD and SOD activities in roots, compared with 2Al and 4Al, respectively (Fig. 7b, d & f). When concerning reactive oxygen species scavenging systems, it is speculated that H2S may alleviate Al toxicity through elevated CAT and POD activities in leaves, while the root system mainly alleviates Al injury through other ways, thus the activities of CAT,POD and SOD decreased. Taken together this data supports the idea that H2S reduces MDA and increases proline levels by regulating antioxidant enzyme activity to alleviate stress in 2Al treatment in leaves.
GSH, the major non-enzymatic antioxidants in the ASA-GSH cycle contribute to plant antioxidant defense[34]. Consistent with previous research results[35], the GSH content in leaves significantly increased after exposure to Al stress. Although exogenous H2S reduced the GSH content in barley leaves[35], it did not decrease GSH content in tea leaves under H2S + 2Al, and only decreased the GSH content under H2S + 4Al (Fig. 8a), indicating that H2S responds to 4Al toxicity by altering GSH content in leaves, triggering the AsA-GSH cycle and improving antioxidant capacity. Consistently, levels of GSSG, which is reduced to GSH, enhanced in leaves during Al stress exposure, and H2S reduce the content of GSSG only in 4Al (Fig. 8b). The GSH/GSSG ratio is also an important indicator of intracellular redox homeostasis within cells. Exogenous H2S modulated the GSH/GSSG ratios by altering GSH and GSSG to varying levels, but resulting in a little change in GSH/GSSG compared to Al stress alone (Fig. 8c). These outcomes are consistent with the findings of previous studies on bermudagrass[36] and rice[37]. GST has been found to catalyze the chelation of GSH with metals and reduce the toxicity of metals to plants[38]. The GST activity under H2S + 2Al not H2S + 4Al stress was significantly enhanced (Fig. 8d), plants rely on the binding to minimize damage, which was consistent with the study of Miscanthus sacchariflorus[24].
GR regulates the redox state of glutathione by converting GSSG into GSH, and also responsible for combating a large amount of reactive oxygen species in plants[39]. The GR activity in this study shown an increase under Al stress which is similar to the observations made by Devi et al.[40]. Higher GR activity after H2S + 2Al and lower GR activity under H2S + 4Al were observed, respectively in comparison to 2Al and 4Al (Fig. 8e). The above results confirmed that H2S alleviates 2Al stress by regulating substances derived from antioxidant system, whereas the mechanism was complex, resulting in a small pattern of changes in H2S + 4Al compared with 4Al stress alone.
LCD is primarily responsible for catalyses the decomposition of cysteine to H2S. Further enzyme analysis indicated that the externally applied H2S enhanced the activity of LCD relative to Al alone stress, which was especially significant in roots. In Spinacia oleracea also clearly showed an increase in LCD activity with application H2S[41], and an early H2S signal might promoted higher LCD activity than Al stress after 3 h[42]. Taken together, LCD activity regulates the internal H2S pathway in C. sinensis and plays a more effective role in roots rather than leaves
H2S altered tea components during Al stress
-
Various components of the tea plant, including tea polyphenols, amino acids, caffeine, catechins, are not only closely related to the flavor of the tea plant, but also have an effect when C. sinensis is exposed to stress. The synthesis of amino acids, caffeine, and catechins is regulated by Al[43]. In this study, compared with normal Al concentration, the changes in tea polyphenol content under Al stress were not significant, while the content of free amino acids was significantly reduced and the content of caffeine was significantly increased (Fig. 9). At normal Al concentration, early application of H2S increases the content of these substances (Fig. 9), which may be related to the promotion of tea roots growth by H2S[44]. As a major component of the ester type catechins, EGCG has been reported to chelate Al, thus conferring Al tolerance to plants[45]. It was found that the EGCG content increased by 8.70% under H2S + 2Al compared to 2Al, and excessive stress of 4Al may lead to a decrease in EGCG content, and even with the addition of exogenous H2S, the changes in content remains small under 4Al stress (Table 4). Combined with the above results, it providing further evidence that the part of H2S that promotes the increase of components may have chelated with too much Al at H2S + Al, resulting in a decrease in the final content, or may be caused by severe stress at 4Al.
-
Our results indicate that H2S may be pivotal actor in enhancing the resistance of C. sinensis to Al stress. Increasing biomass, promoting root activity, reducing accumulation of Al in roots and increasing TF of Al, regulating the content of Ca, Mg, Zn, Mn and Fe and their TF in different tissues, increasing chlorophyll content, maintaining ultrastructural homeostasis, regulating substances related to antioxidant pathways and tea plant components all play key roles in the ameliorating effect. Moreover, compared to 4Al, H2S can better alleviate the stress caused by 2Al.
-
The authors confirm contribution to the paper as follows: conceptualization: Shu Z, Sui X, Wang Y; investigation: Shu Z, Huang P, Wan S; data curation: Zhang Y, Xing A; project administration: Shu Z, Wang Y; supervision: Wang Y; resources: Li X; formal analysis, visualization, writing—original draft preparation: Xing A; writing—review and editing: Xing A, Liu S, Chen X, Li X, Wang Y; funding acquisition: Chen X, Wang Y. All authors read and approved the final manuscript.
-
All data generated or analyzed during this study are available within the article.
We thank Professor Yanjie Xie from College of Life Sciences, Nanjing Agricultural University, for revising the paper. We thank Dr. Yuehua Ma (Central Laboratory of College of Horticulture, Nanjing Agricultural University) for using Microporous Plate Detecting Instrument (Cytation3, BioteK, USA). This work was supported by the National Natural Science Foundation of China (31972457), Jiangsu Agricultural Industry Technology System (JATS[2023]416), and Natural Resources Science and Technology Foundation of Jiangsu Province (2022018).
-
The authors declare that they have no conflict of interest.
-
# Authors contributed equally: Anqi Xing, Zaifa Shu
- Copyright: © 2024 by the author(s). Published by Maximum Academic Press, Fayetteville, GA. This article is an open access article distributed under Creative Commons Attribution License (CC BY 4.0), visit https://creativecommons.org/licenses/by/4.0/.
-
About this article
Cite this article
Xing A, Shu Z, Huang P, Zhang Y, Sui X, et al. 2024. Exogenous hydrogen sulfide enhanced Al stress tolerance in tea plant Camellia sinensis. Beverage Plant Research 4: e024 doi: 10.48130/bpr-0024-0013 

Exogenous hydrogen sulfide enhanced Al stress tolerance in tea plant Camellia sinensis
- Received: 02 December 2023
- Revised: 27 February 2024
- Accepted: 04 March 2024
- Published online: 04 July 2024
Abstract: Al is an essential element for the growth of tea plants roots, but excessive Al affects growth and development of Camellia sinensis. The underlying mechanism, particularly regulation of gas signaling molecule H2S, remains unclear. This study aims to uncover the function of H2S on C. sinensis under Al stress by treating hydroponic tea seedlings with different Al concentration, Na2S (H2S donor) and DL-propargylglycine (PAG, synthesis inhibitor). High concentration of Al inhibits growth of tea roots, while H2S significantly improves the effects caused by Al stress. Whether it is 2 mM Al3+ or 4 mM Al3+, H2S reduces content of Al in the entire plant and roots, increases root activity, further promotes root growth, increases fresh and dry weight, regulates ion homeostasis, improves cell structure, increases chlorophyll content, and thus reduces the damage of Al toxicity in C. sinensis. Moreover, in response to the stress of 2 mM Al3+, H2S simultaneously alleviates Al stress by regulating substances related to antioxidant pathways, increasing content of GSH and GSSG, enhancing activity of GST, GR, LCD, and key components of tea, in order to alleviate Al stress. These approaches have effectively improved Al tolerance of C. sinensis, providing a new perspective for the study of H2S enhancing Al tolerance.
-
Key words:
- Hydrogen sulfide /
- Al stress /
- Camellia sinensis