


-
The tea plant (Camellia sinensis) is an important global commercial crop and tea is primarily consumed as a non-alcoholic beverage made from processed leaves[1,2]. The tea plant is abundant in secondary metabolites, including, flavonoids, alkaloids, amino acids, and terpenoids[3−5], and various health-promoting functions of teas are largely attributable to these bioactive natural products. Flavonoids are one of the main secondary metabolites in tea, including chalcones, flavones, flavonols, flavanols, anthocyanins, condensed tannins or proanthocyanidins (PAs), and other specialized forms of flavonoids[6]. Of these, catechins (flavan-3-ols) are best characterized molecularly and biochemically[7−9]. The six main types of flavan-3-ols include epicatechin (EC), catechin (C), epigallocatechin (EGC), gallocatechin (GC), epicatechin-3-gallate (ECG), and epigallocatechin-3-gallate (EGCG), with EGCG being the representative catechin with the highest content in tea plants, playing essential roles in imparting bitterness and astringency[10−14]. Alongside flavan-3-ols, flavones, flavonols, and flavonol glycosides are also important secondary metabolites that affect the bitterness and astringency of tea soup[15−17]. Several typical flavones and flavonols in tea soup are apigenin, luteolin, kaempferol, quercetin, and myricetin[10]. Anthocyanins are also a branch of flavonoids, which mainly have protective effects such as antioxidant, anti-inflammatory, and anti-cancer properties, and they are mainly present in the form of glycosylation or acylation, and are generally abundant in purple plants[18].
Free amino acids constitute the principal chemical components in tea, playing a pivotal role in enhancing its pleasant flavor. Among these amino acids, L-Theanine (γ-glutamyl-L-ethylamide) a non-protein amino acid, is particularly important in affecting tea flavor[19,20]. Concomitantly, L-theanine was verified to promote the umami taste of tea infusions by neutralizing catechins, flavonol glucosides, and caffeine[21]. To date, about 26 free amino acids have been identified in tea plants[22−26], wherein L-theanine is highly accumulated in tea plants[27−28]. L-theanine can be produced by β- Oxoglutamate synthesized through GOGAT, which catalyzes the β-Oxoglutamate production of L-Glutamate, followed by L-Glutamate being catalyzed by TS to produce L-theanine[5].
The aroma of tea is also one of the important factors affecting its quality, among which lipid substances play an important role in the volatile[29]. Several important volatiles, jasmine, cis-jasmone, methyl jasmonate, hexanal, pentanal, nonanal, heptanal, (E)-2-hexenal, (E, E)-2,4-hexadienal, 1-penten-3-ol, (Z)-3-hexen-1-ol, (E)-2-Hexen-1-ol, and nerolidol, are lipid-derivative aroma compounds[30]. Furthermore, during the processing of oolong tea, extracellular lipids can also be transformed into aromatic substances and released[29]. Lipids mainly exist in the forms of fatty acyls, glycerolipids, glycerophospholipids, sphingolipids, sterol lipids, prenol lipids, saccharolipids, and polyketides in plants[31]. To date, about 170 lipids and their derivatives have been identified in tea plants[32].
China possesses abundant germplasm resources, and the genetic and metabolite diversity within its tea population significantly mirrors the global tea diversity[33]. Nevertheless, different types of secondary metabolites vary greatly in different tea cultivars[10]. Notably, 'ZJ' and 'P113' are abundant in anthocyanins[34,35], and the theanine concentration in the yellow cultivar was significantly higher than that in the green cultivar[36−38]. To better regulate and improve tea quality, it is very important to study the composition differences of different tea cultivars. Here, we integrate metabolomic analyses to study the apical bud and the 1st leaf of 'SCZ', 'HK', and 'ZJ', and the results provide metabolic markers for tea breeding, and advance our understanding of the biosynthesis of specific metabolites in tea plants.
-
Tea cultivars 'Shuchazao' (SCZ), 'Huangkui' (HK) and 'Zijuan' (ZJ) were grown in the experimental tea garden of Anhui Agricultural University (31°55' North, 117°12′ East; Hefei City, Anhui Province, China). The apical bud and the 1st leaf of five-year-old tea plants were sampled in April.
Sample preparation and extraction
-
Fresh tea samples were collected, ground into powder in liquid nitrogen, extracted with a solution of methanol, acetonitrile, and water (2:2:1), and vortexed and mixed for 30 s. Steel balls were added to the mixture, and then treated with a 45-Hz grinder for 10 min, sonicated for 10 min (in an ice water bath), and left for 1 h at −20 °C. After centrifugation at 12,000 rpm for 15 min, 500 μL of the supernatant was transferred to a new centrifuge tube. The extraction solution was dried in a vacuum concentrator, and 160 μL of solution (acetonitrile : water =1:1) was added to the metabolite extraction solution after drying and then redissolved in a whirlpool bath for 30 s and an ice water bath for 10 min. After centrifugation at 12,000 rpm for 15 min, 120 μL of supernatant was placed in an injection bottle[39]. Additionally, lidocaine was used as the internal standard.
Instrument platform and chemicals
-
Metabolites detection by Waters UPLC Acquity I-Class PLUS and Waters UPLC Xevo G2-XS QTof. Acquity UPLC HSS T3 1.8 um 2.1 * 100 mm, Waters; Methanol, acetonitrile, and acetic acid were purchased from Shanghai Guo Mei Pharmaceutical Co. UPLC-grade water was prepared from distilled water using a Milli-Q system (Millipore Laboratory, Bedford, MA, USA).
Metabolite detection parameters
-
The liquid chromatography-mass spectrometry system used for metabolomics analysis was composed of a Worth Equity I-Class PLUS ultra-high performance liquid chromatograph in series with a Worth Xevo G2-XS QTof high-resolution mass spectrometer. The chromatographic column used was the purchased Waters Equity UPLC HSS T3 column (1.8 μm 2.1 mm × 100 mm). Positive ion mode: mobile phase A: 0.1% formic acid aqueous solution; Mobile phase B: 0.1% formic acid acetonitrile. Negative ion mode: mobile phase A: 0.1% formic acid aqueous solution; Mobile phase B: 0.1% formic acid acetonitrile. The samples (2 μL injection volume) were loaded on a UPLC HSS T3 column and eluted at a flow rate of 400 μL/min. The elution program was as follows: starting with 95% and 5%, a linear gradient from 0−5.5 min, from 5% to 50%, B for 5.5−9.0 min, from 50% to 95%, B for 9.0−12 min, and B from 95% to 5% were performed, followed by washing and equilibration of the column.
Metabolome data analysis
-
Simca-P software (version 13.0) was used for unsupervised principal component analysis (PCA)[40], and orthogonal projections to latent structure-discriminant analysis (OPLS-DA) as previously described[41]. The heatmaps for metabolites relative content were conducted using the 'heatmap' package implemented in R.
-
To assess variations in metabolites among three tea cultivars, we collected the apical bud and 1st leaf from three tea cultivars, including the green cultivar 'SCZ', the yellow cultivar 'HK', and the purple cultivar 'ZJ', as shown in Fig. 1a. Clustering analysis of all metabolites showed significant differences in the chromatograms of different tissues and cultivars (Fig. 1b). A total of 505 metabolites were identified in tea plants (Supplemental Table S1). The identified metabolites can be divided into ten main categories, including flavonoids (38.03%), terpenoids (1.39%), alkaloids (2.57%), phenolamides (5.54%), vitamins (2.57%), amino acids and derivatives (11.68%), nucleotides and derivatives (9.51%), Organic acid (3.56%), lipids (8.91%), and others (16.24%) (Fig. 1c). In the PCA score plot, the cumulative contribution rate of two principal components (t1 59.5% and t 20.2%) reached 79.7% (Fig. 1d). PCA analysis results showed that variance and distinguished samples according to the different apical bud and 1st leaf of three tea cultivars, and were appropriate for further difference assessments. The current results further revealed that the tea plants are rich in secondary metabolites, and the compositions differences between different cultivars and tissues.
Figure 1.
Detection and identification of specialized metabolites. (a) The phenotypes of two tissues of the three cultivars. 'Shuchazao' (SCZ), 'Huangkui' (HK) and 'Zijuan' (ZJ). (b) Clustering heatmap tree of total metabolites of two tissues of the three cultivars. Z-scores normalize the value. Red indicates a high abundance, and blue indicates a low relative abundance of metabolites. (c) Composition and proportion of different metabolites in different tea cultivars. (d) PCA of the metabolites in different tissues of tea plants. SB: SCZ-bud; ZB: ZJ-bud; HB: HK-bud; SL: SCZ-leaf; ZL: ZJ-leaf; HL: HL-leaf.
Multivariate analysis of differential metabolites
-
To further elucidate the variances in metabolites among different cultivars, multivariate statistical methods were adopted to analyze metabolic differences. Pairwise comparisons were performed among SB vs HB, ZB vs SB, ZB vs HB, SL vs HL, ZL vs SL, and ZL vs HL of the three tea cultivars by the OPLS-DA model to identify the metabolites responsible for the observed differences (Fig. 2a, b). Consequently, high predictability (Q2Y) and strong goodness of fit (R2X, R2Y) of the OPLS-DA models were observed in the comparison between SB vs HB (R2X = 0.956, R2Y = 0.999, Q2Y = 0.995), as well as between ZB vs SB (R2X = 0.954, R2Y = 1, Q2Y = 0.999), ZB vs HB (R2X = 0.811, R2Y = 1, Q2Y = 0.997), and SL vs HL (R2X = 0.955, R2Y = 1, Q2Y = 0.998), ZL vs SL (R2X = 0.987, R2Y = 1, Q2Y = 1 ), and ZL vs HL (R2X = 0.973, R2Y = 1, Q2Y = 0.999). These parameters underscore the stability and appropriateness of the models, signifying distinct metabolic profiles among the three tea cultivars. To gain more insight into the metabolic differences between SB vs HB, ZB vs SB, ZB vs HB, SL vs HL, ZL vs SL, and ZL vs HL of the three tea cultivars, respectively, differential metabolites screening was performed by Volcano plots, and the screening results are shown in Fig. 3 and Supplemental Table S2. Approximately 505 differential metabolites were analyzed through Volcano plots, revealing 91 up-regulated and 42 down-regulated metabolites between SB and HB (Fig. 3a, Supplemental Table S3), 68 up-regulated and 52 down-regulated metabolites between SB and ZB (Fig. 3b, Supplemental Table S3), and 82 up-regulated and 61 down-regulated metabolites between ZB and HB (Fig. 3c, Supplemental Table S3). Similar results were also observed in the comparison of three different leaf groups (Fig. 3d−f, Supplemental Table S3). Attention-worthy, most differential metabolites were flavonoids (Supplemental Table S3), thus, in the following analysis process, we focus on analyzing the differences of flavonoids in three tea cultivars.
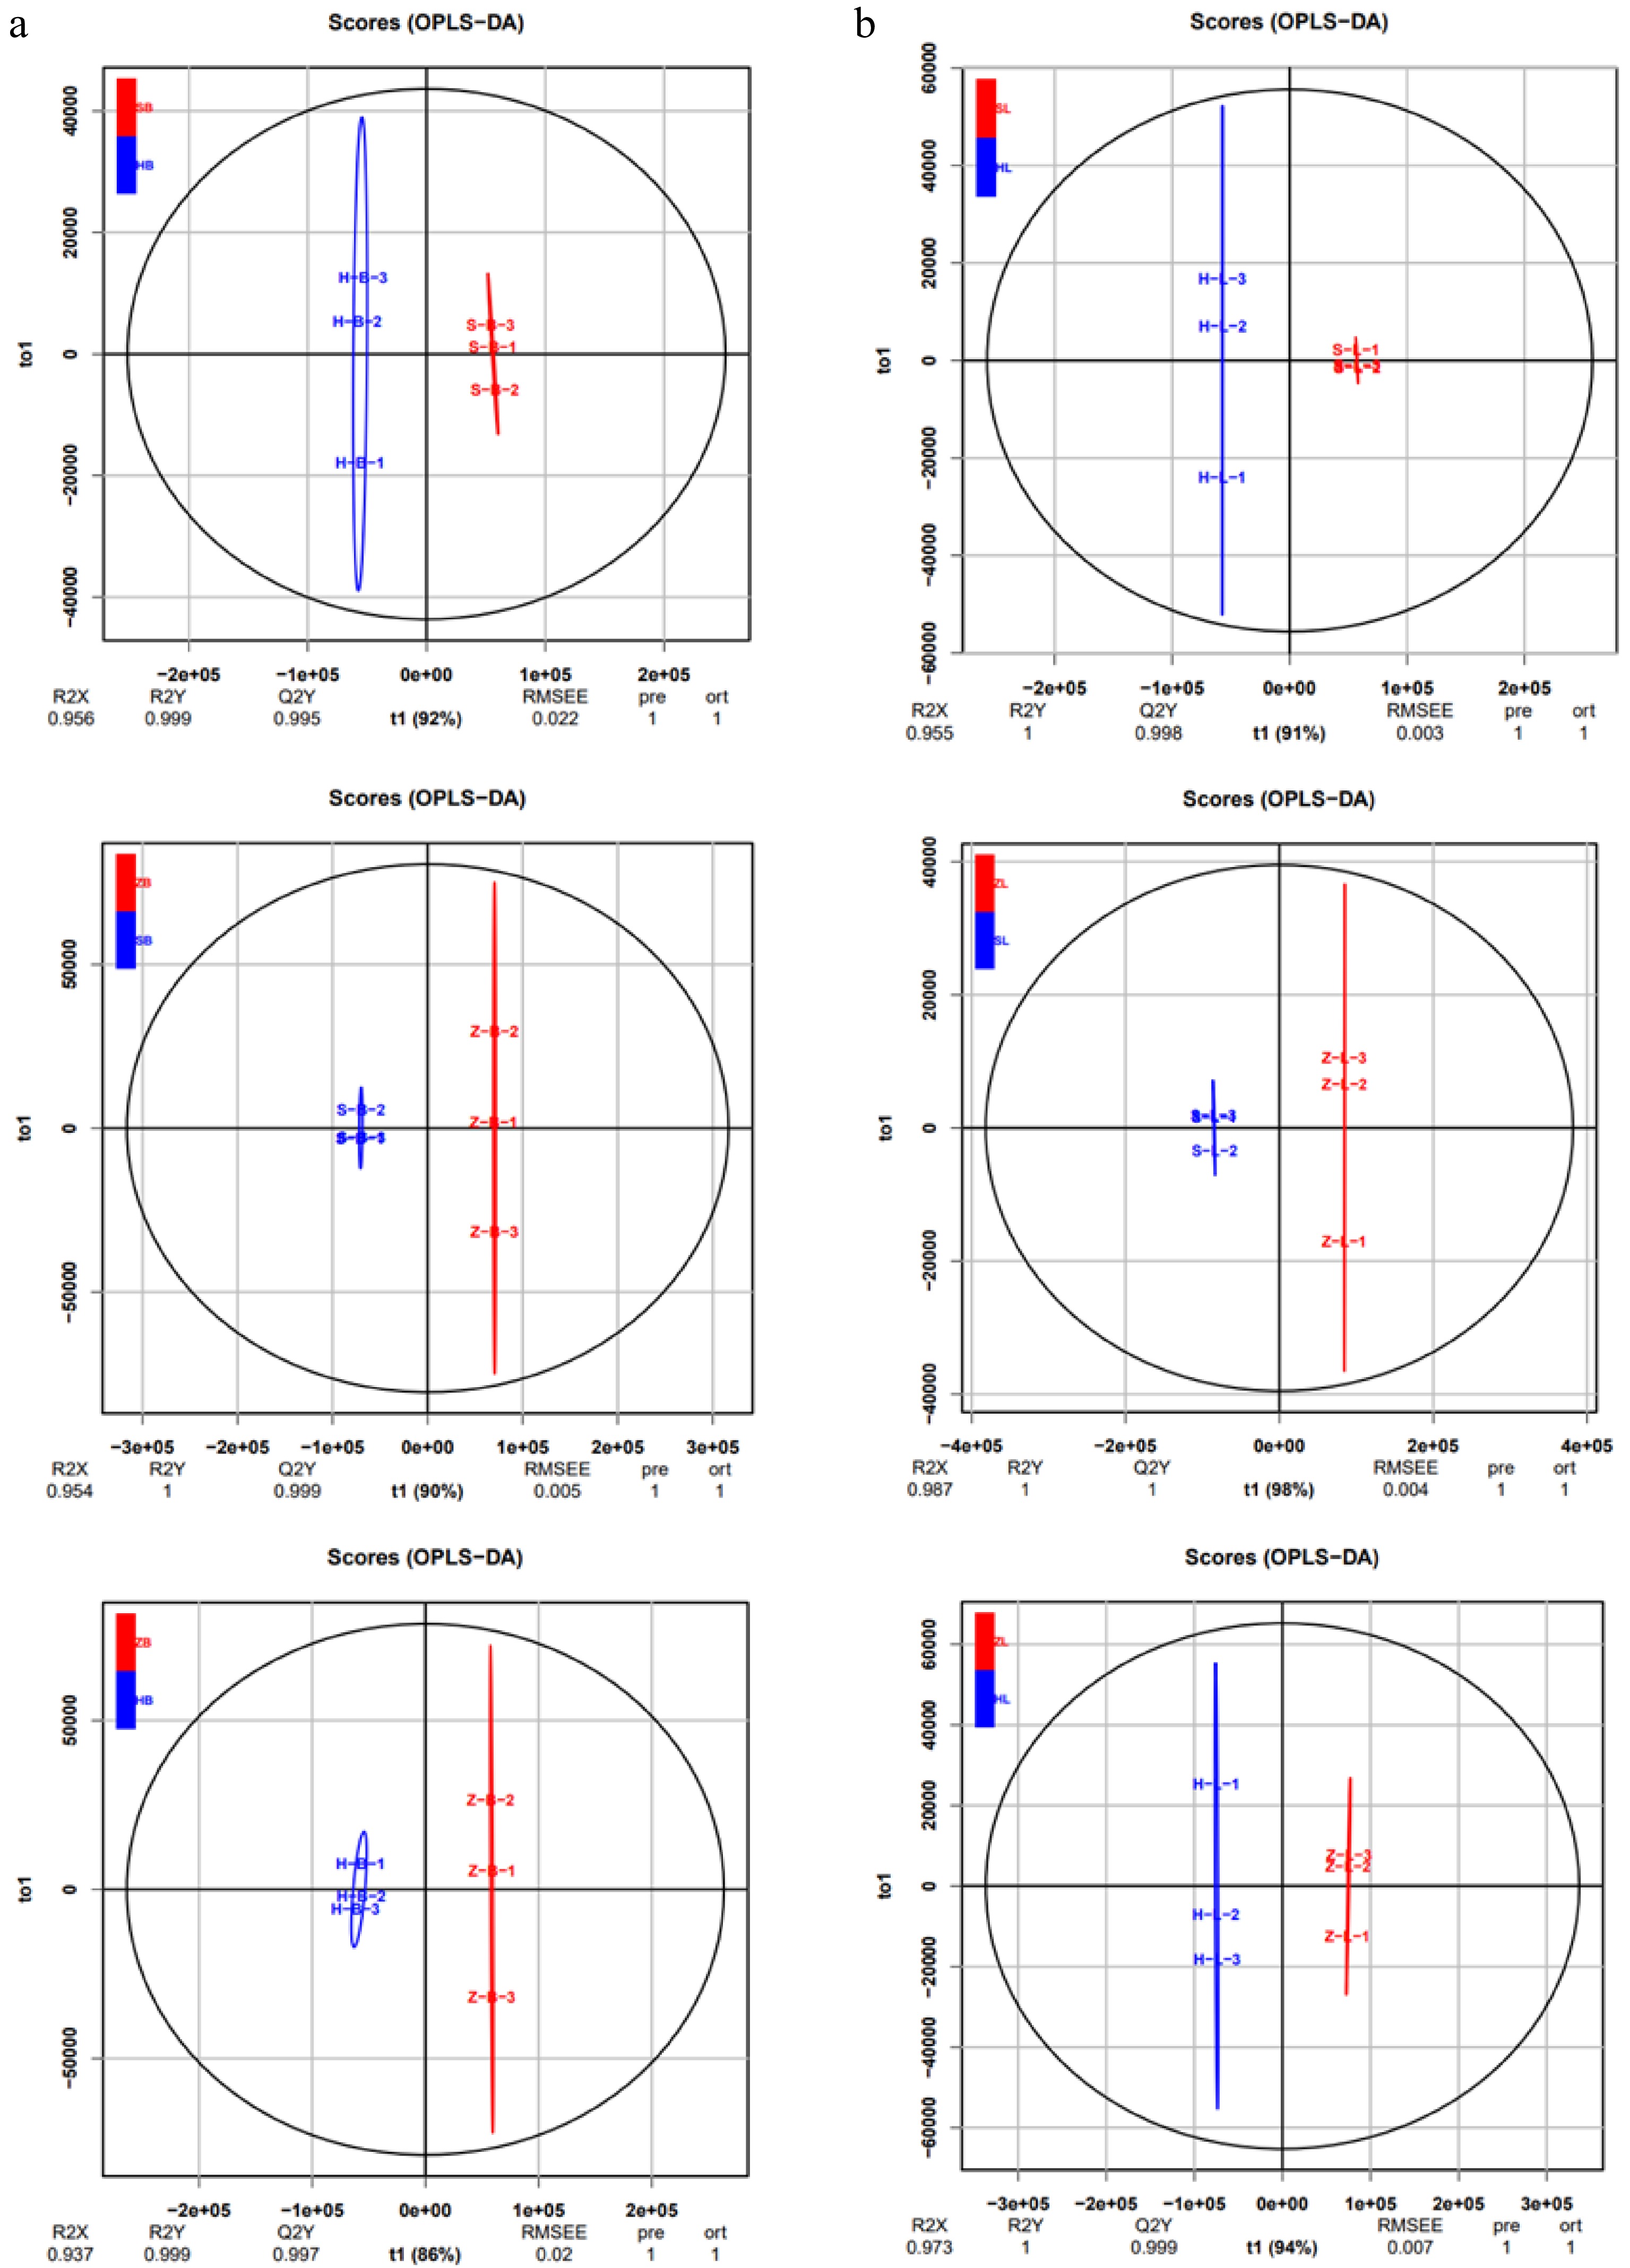
Figure 2.
Differential metabolite analysis by OPLS-DA.
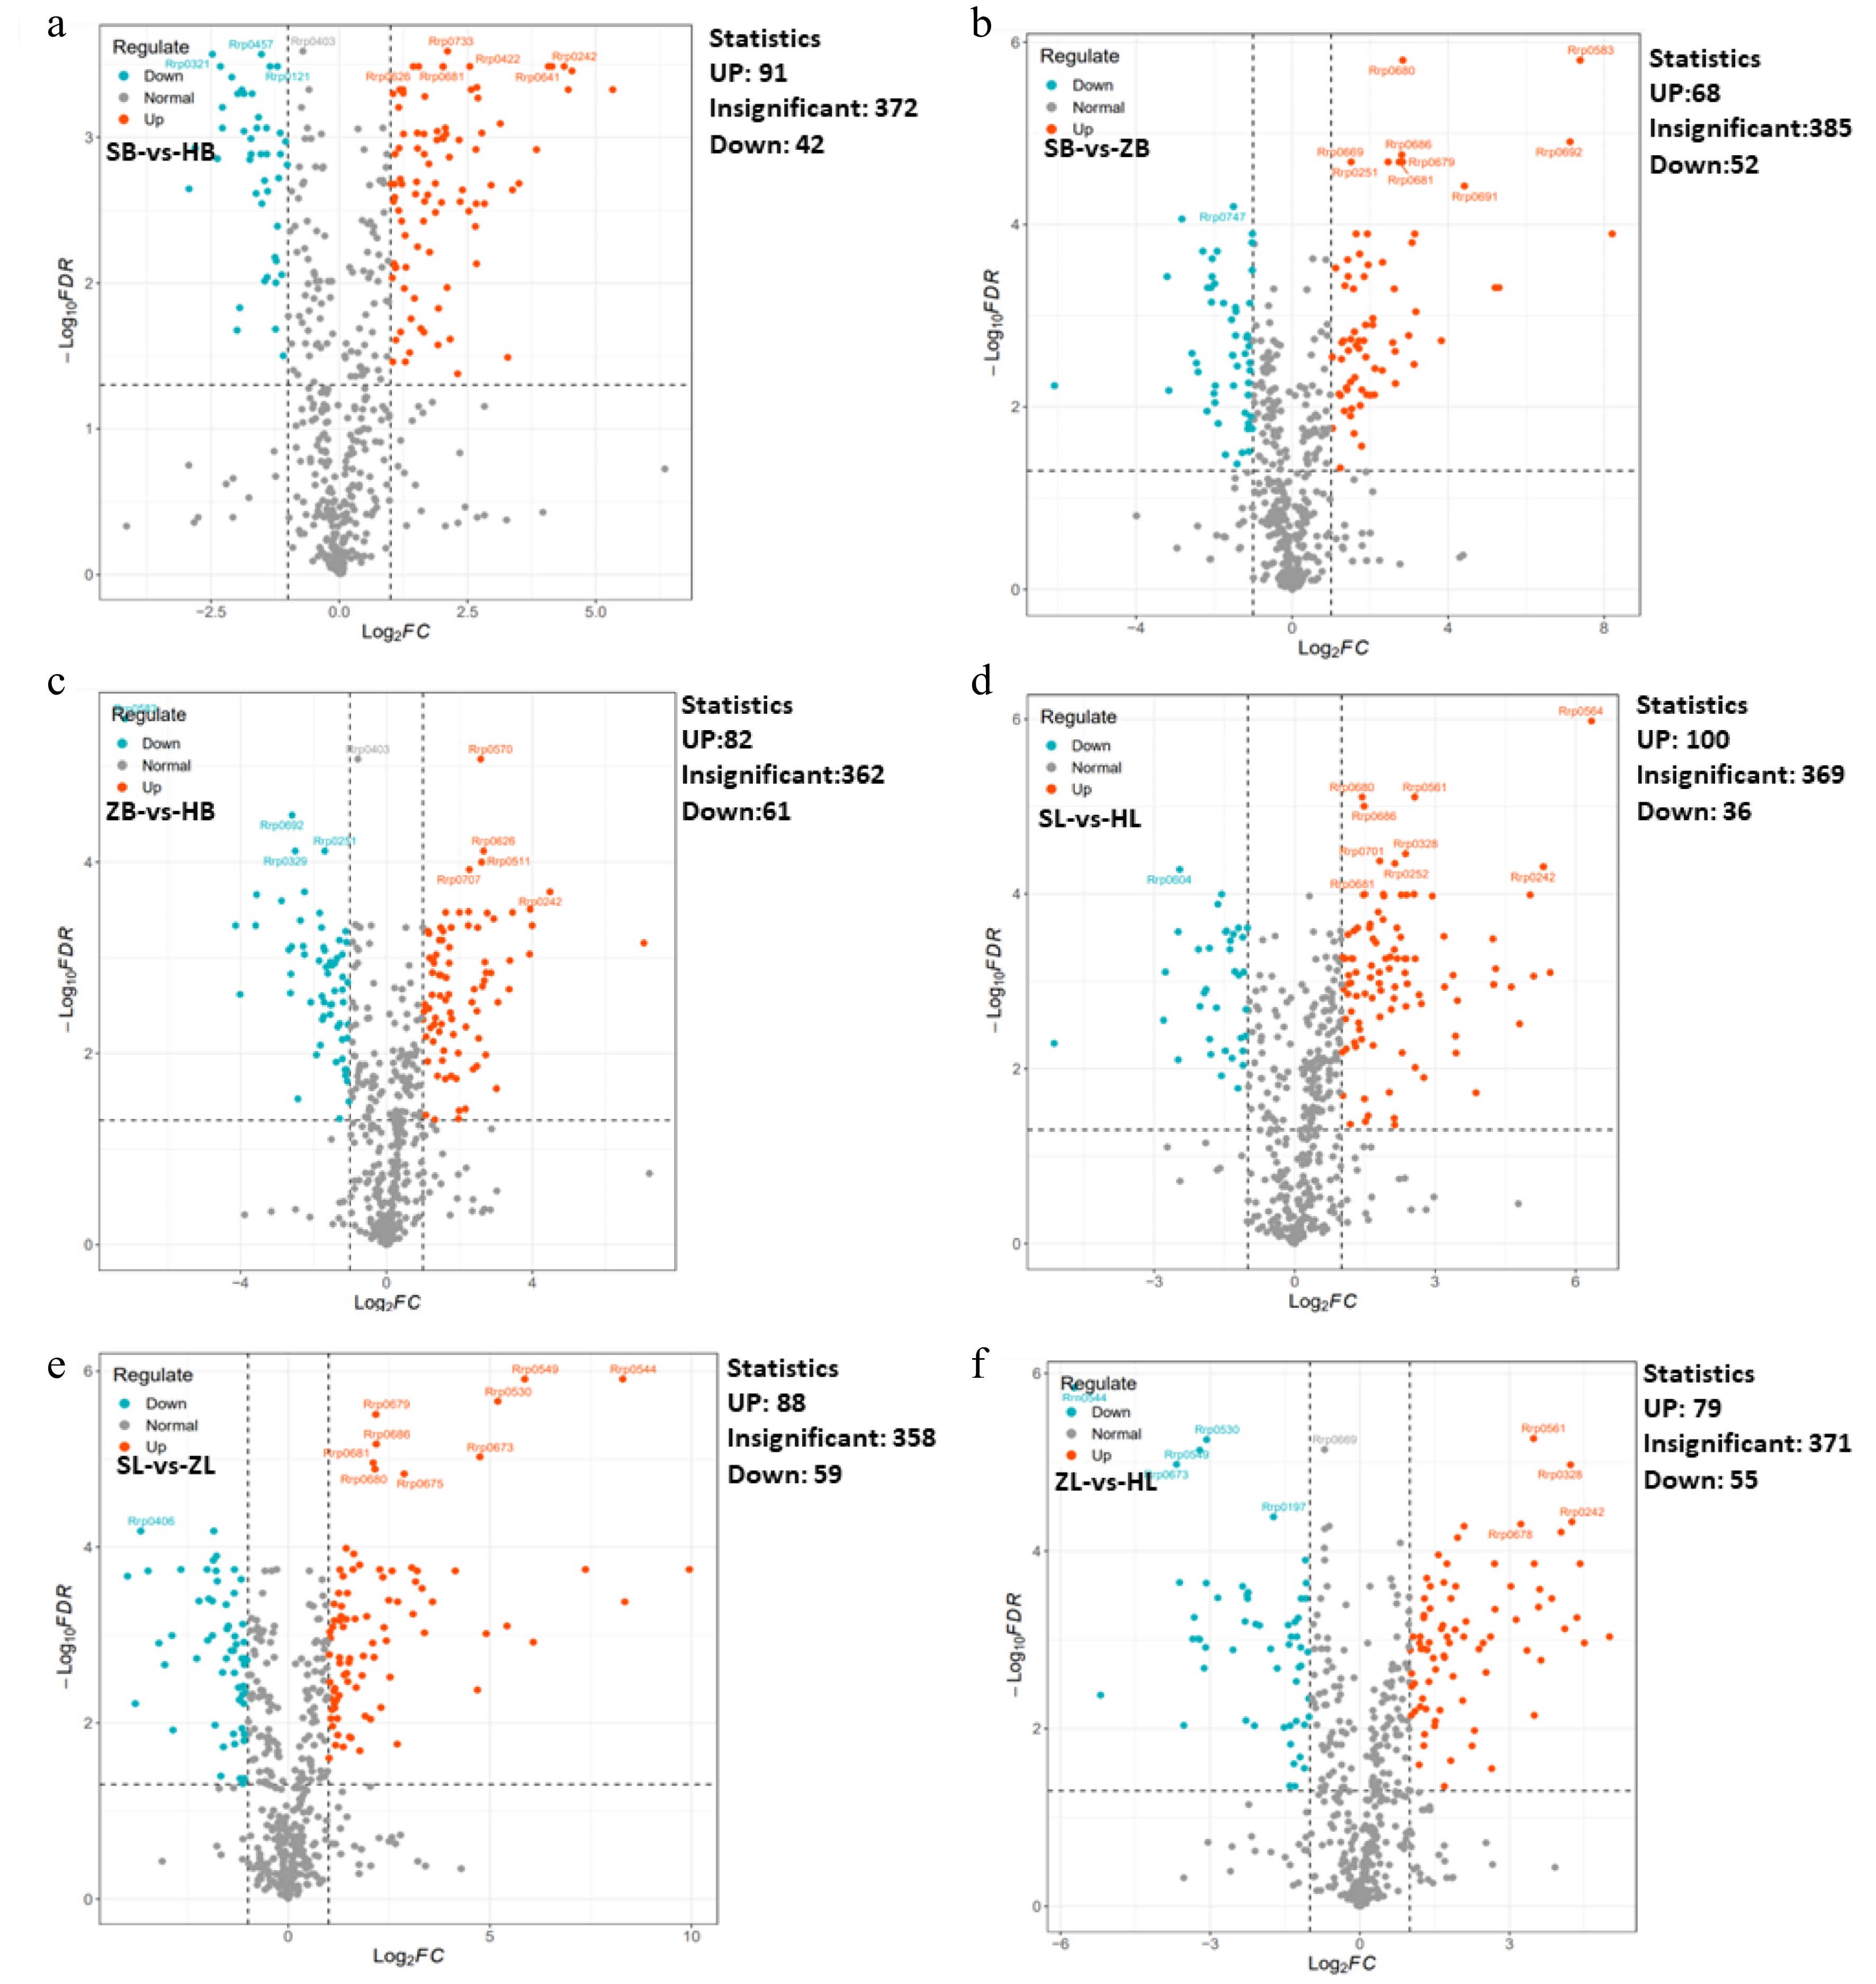
Figure 3.
Volcano plots showing the differential metabolite expression levels.
Specific analysis of differential metabolites
-
Figure 3 showed that the main differential metabolites in the six tissues of the three cultivars are flavonoids. Flavonoids are derived from the phenylpropanoids pathway, which is catalyzed by a series of enzymes to produce flavonols, anthocyanins, and flavan-3-ol (Fig. 4a). To identify specific differences in flavonoid metabolites, we conducted a more detailed analysis using cluster analysis (Fig. 4b,c). Flavan-3-ols are the main flavonoids, and their content directly affects the quality of the tea. The EGCG has the highest content of six types of catechins, and compared to 'SCZ' and 'HK', the relative content of EGCG in 'ZJ' is slightly lower in both the apical bud and the 1st leaf, as shown in part P1 of Fig. 4b. The accumulation of two other typical catechins, EC and C, in 'HK' is inferior to that in 'ZJ' and 'SCZ', as shown in part P2 of Fig. 4b. In contrast to flavan-3-ols, anthocyanins mainly accumulate in the form of glycosides in 'ZJ', as shown in part P3 of Fig. 4b, except for cyanidin 3,5-O-digglucoside, indicating a correlation with the color attributes. Additionally, beyond catechins and anthocyanins, flavonols and glycosides are also important factors affecting tea quality. Among the six tissues of three cultivars, flavonoids mainly exist in the form of glycosides, mainly flavonol glycosides (Fig. 4c). Furthermore, flavonol glycosides, similar to anthocyanin glycosides, accumulate in 'ZJ', as shown in part P4 of Fig. 4c. In addition to the above characteristics, the accumulation of flavonols and flavonol glycosides in the apical buds of the three varieties is slightly lower than that in the leaves (Fig. 4c). These findings indicate that 'SCZ' mainly accumulates a large number of flavan-3-ols, such as EGCG, EC, and C, while anthocyanins, anthocyanin glycosides, and flavonol glycosides are mainly accumulated in 'ZJ'. In comparison to the other two cultivars, the synthesis, and accumulation of flavonoid metabolites in 'HK' are comparatively less, suggesting a potential correlation with genetic factors.
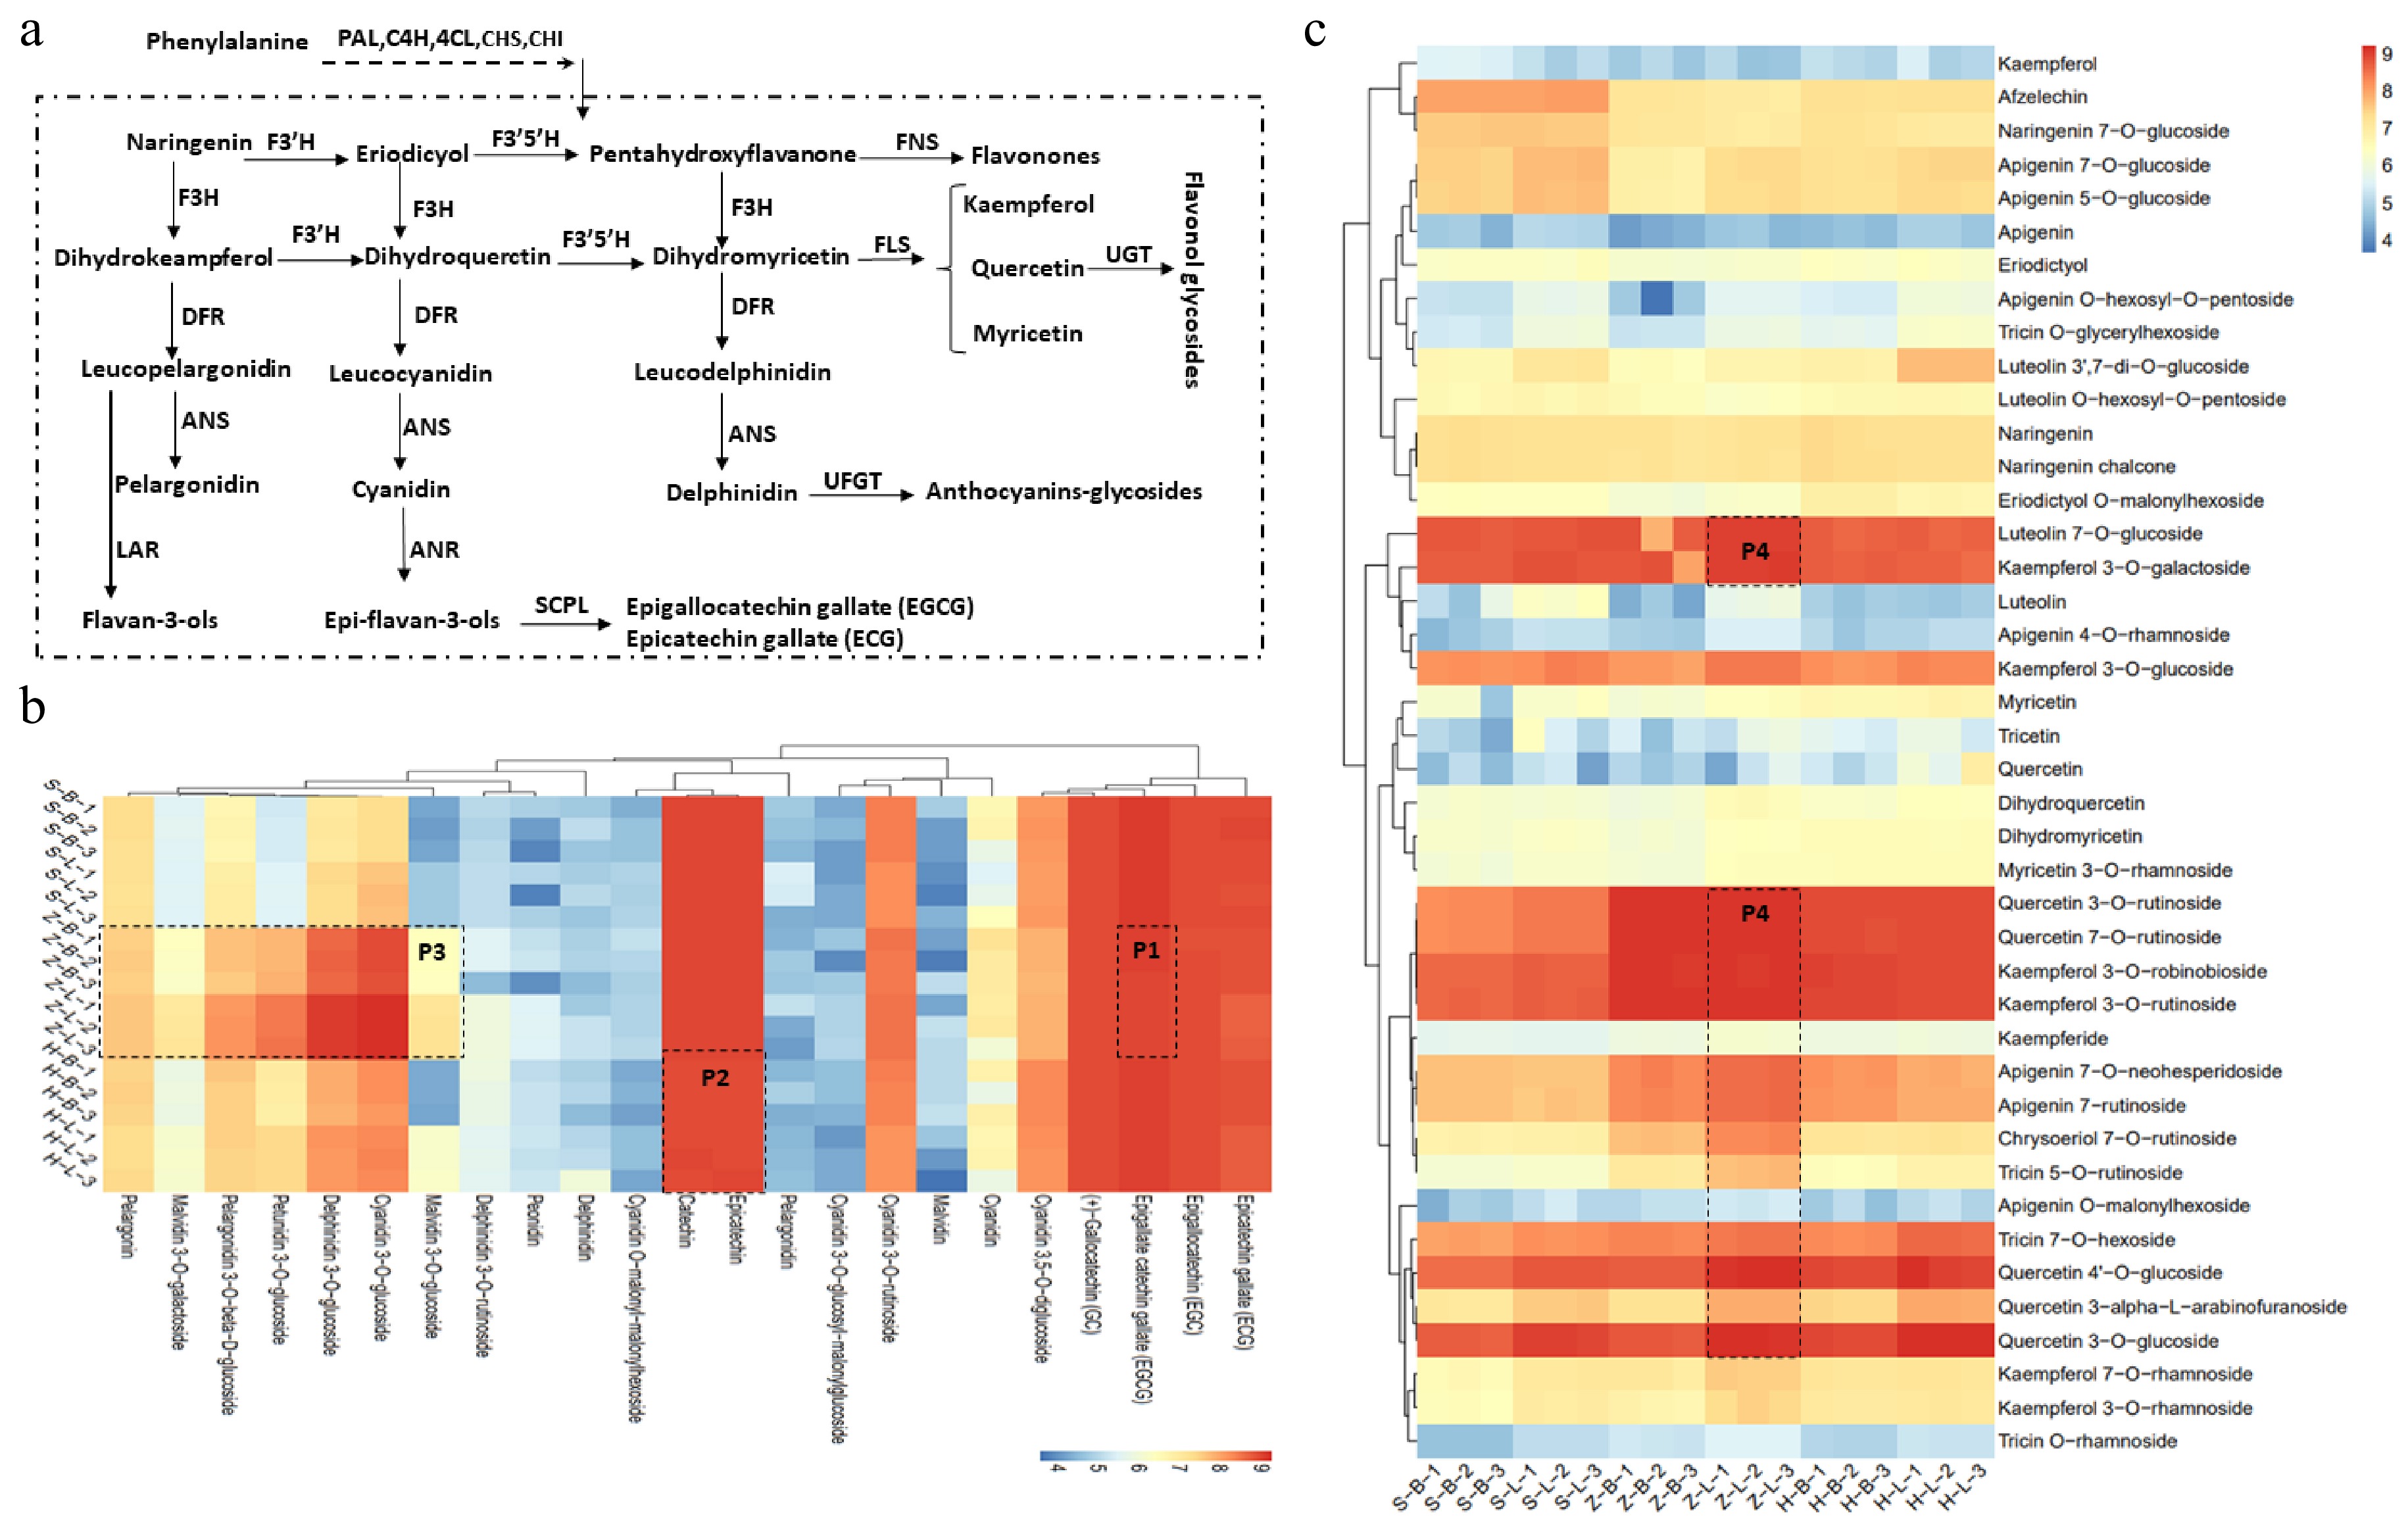
Figure 4.
Phenylpropanoid pathways toward the biosynthesis of flavonoids in tea plants. (a) Flavonoid biosynthesis pathways in tea plant. (b), (c) Catechins, flavonoids and anthocyanin relative content in different tissues of SCZ, HK and ZJ plants. CHS: Chalcone synthase; CHI: Chalcone isomerase; C4H: Cinnamate 4-hydroxylase; DFR: Dihydroflavonol reductase; EGC: Epigallocatechin; ECG: Epicatechin-3-gallate; F3H: flavonoid 3-hydroxylase; F3'H: Flavonoid 3'-hydroxylase; F3'5'H: Flavonoid 3'5'-hydroxylase; FNS: flavone synthase; FLS: Flavonol synthase; LAR: Leuacoanthocyanidin reductase; PAL: Phenylalanine ammonialyase; 4CL: 4-Coumarate:CoA ligase; HCT: Hydroxycinnamoyl-CoA: shikimate hydroxycinnamoyl transferase1; SCPL: Serine carboxypeptidase-like Clade 1A; UGT: UDP-Glucose flavonoid 3-O-glucosyl transferase; C: Catechin; EC: Epicatechin; EGCG: Epigallocatechin-3-gallate.
Metabolic analysis of free amino acids
-
Free amino acids are also the main compounds that affect the quality of tea, especially L-theanine. Amino acids are synthesized through branched pathways in tea plants (Fig. 5a). Glucose serves as the foundational element for all amino acid metabolism and is synthesized diversely to generate essential and non-essential amino acids in plants. Glycolysis produces 3-phosphoglycerate, which is the substrate of serin, glycine, and cysteine synthesis. Furthermore, a further reaction of glycerate 3-phosphate resulted in the generation of phosphoenolpyruvate, which is the initiator of shikimate. Pyruvate is the starting point for the synthesis of L-theanine and other free amino acids. Alanine, ethylamine, and L-glutamate are several important prerequisite amino acids for the synthesis of L-theanine, and those undergo different catalytic enzyme reactions to produce L-theanine, such as TS, and GGT (Fig. 5a). A cluster analysis of amino acids and derivatives reveals that L-theanine exhibits the highest content of free amino acids, as shown in the P5 section of Fig. 5b. It is worth noting that the content of most free amino acids in the apical buds of the three cultivars is higher than in the leaves, which is contrary to the synthesis pattern of flavonoids (Fig. 4c, 5b). Clustering analysis results indicate a marginally higher accumulation of several amino acids and derivatives in 'HK' compared to the other two cultivars, including L-glutamine, L-theanine, 2-aminoisobutyric acid, and L-glutamic acid (Fig. 5b). Consequently, based on the above results, it can be seen that 'HK' did not accumulate too many flavonoids but instead accumulated a large number of free amino acids, mainly in the apical buds.
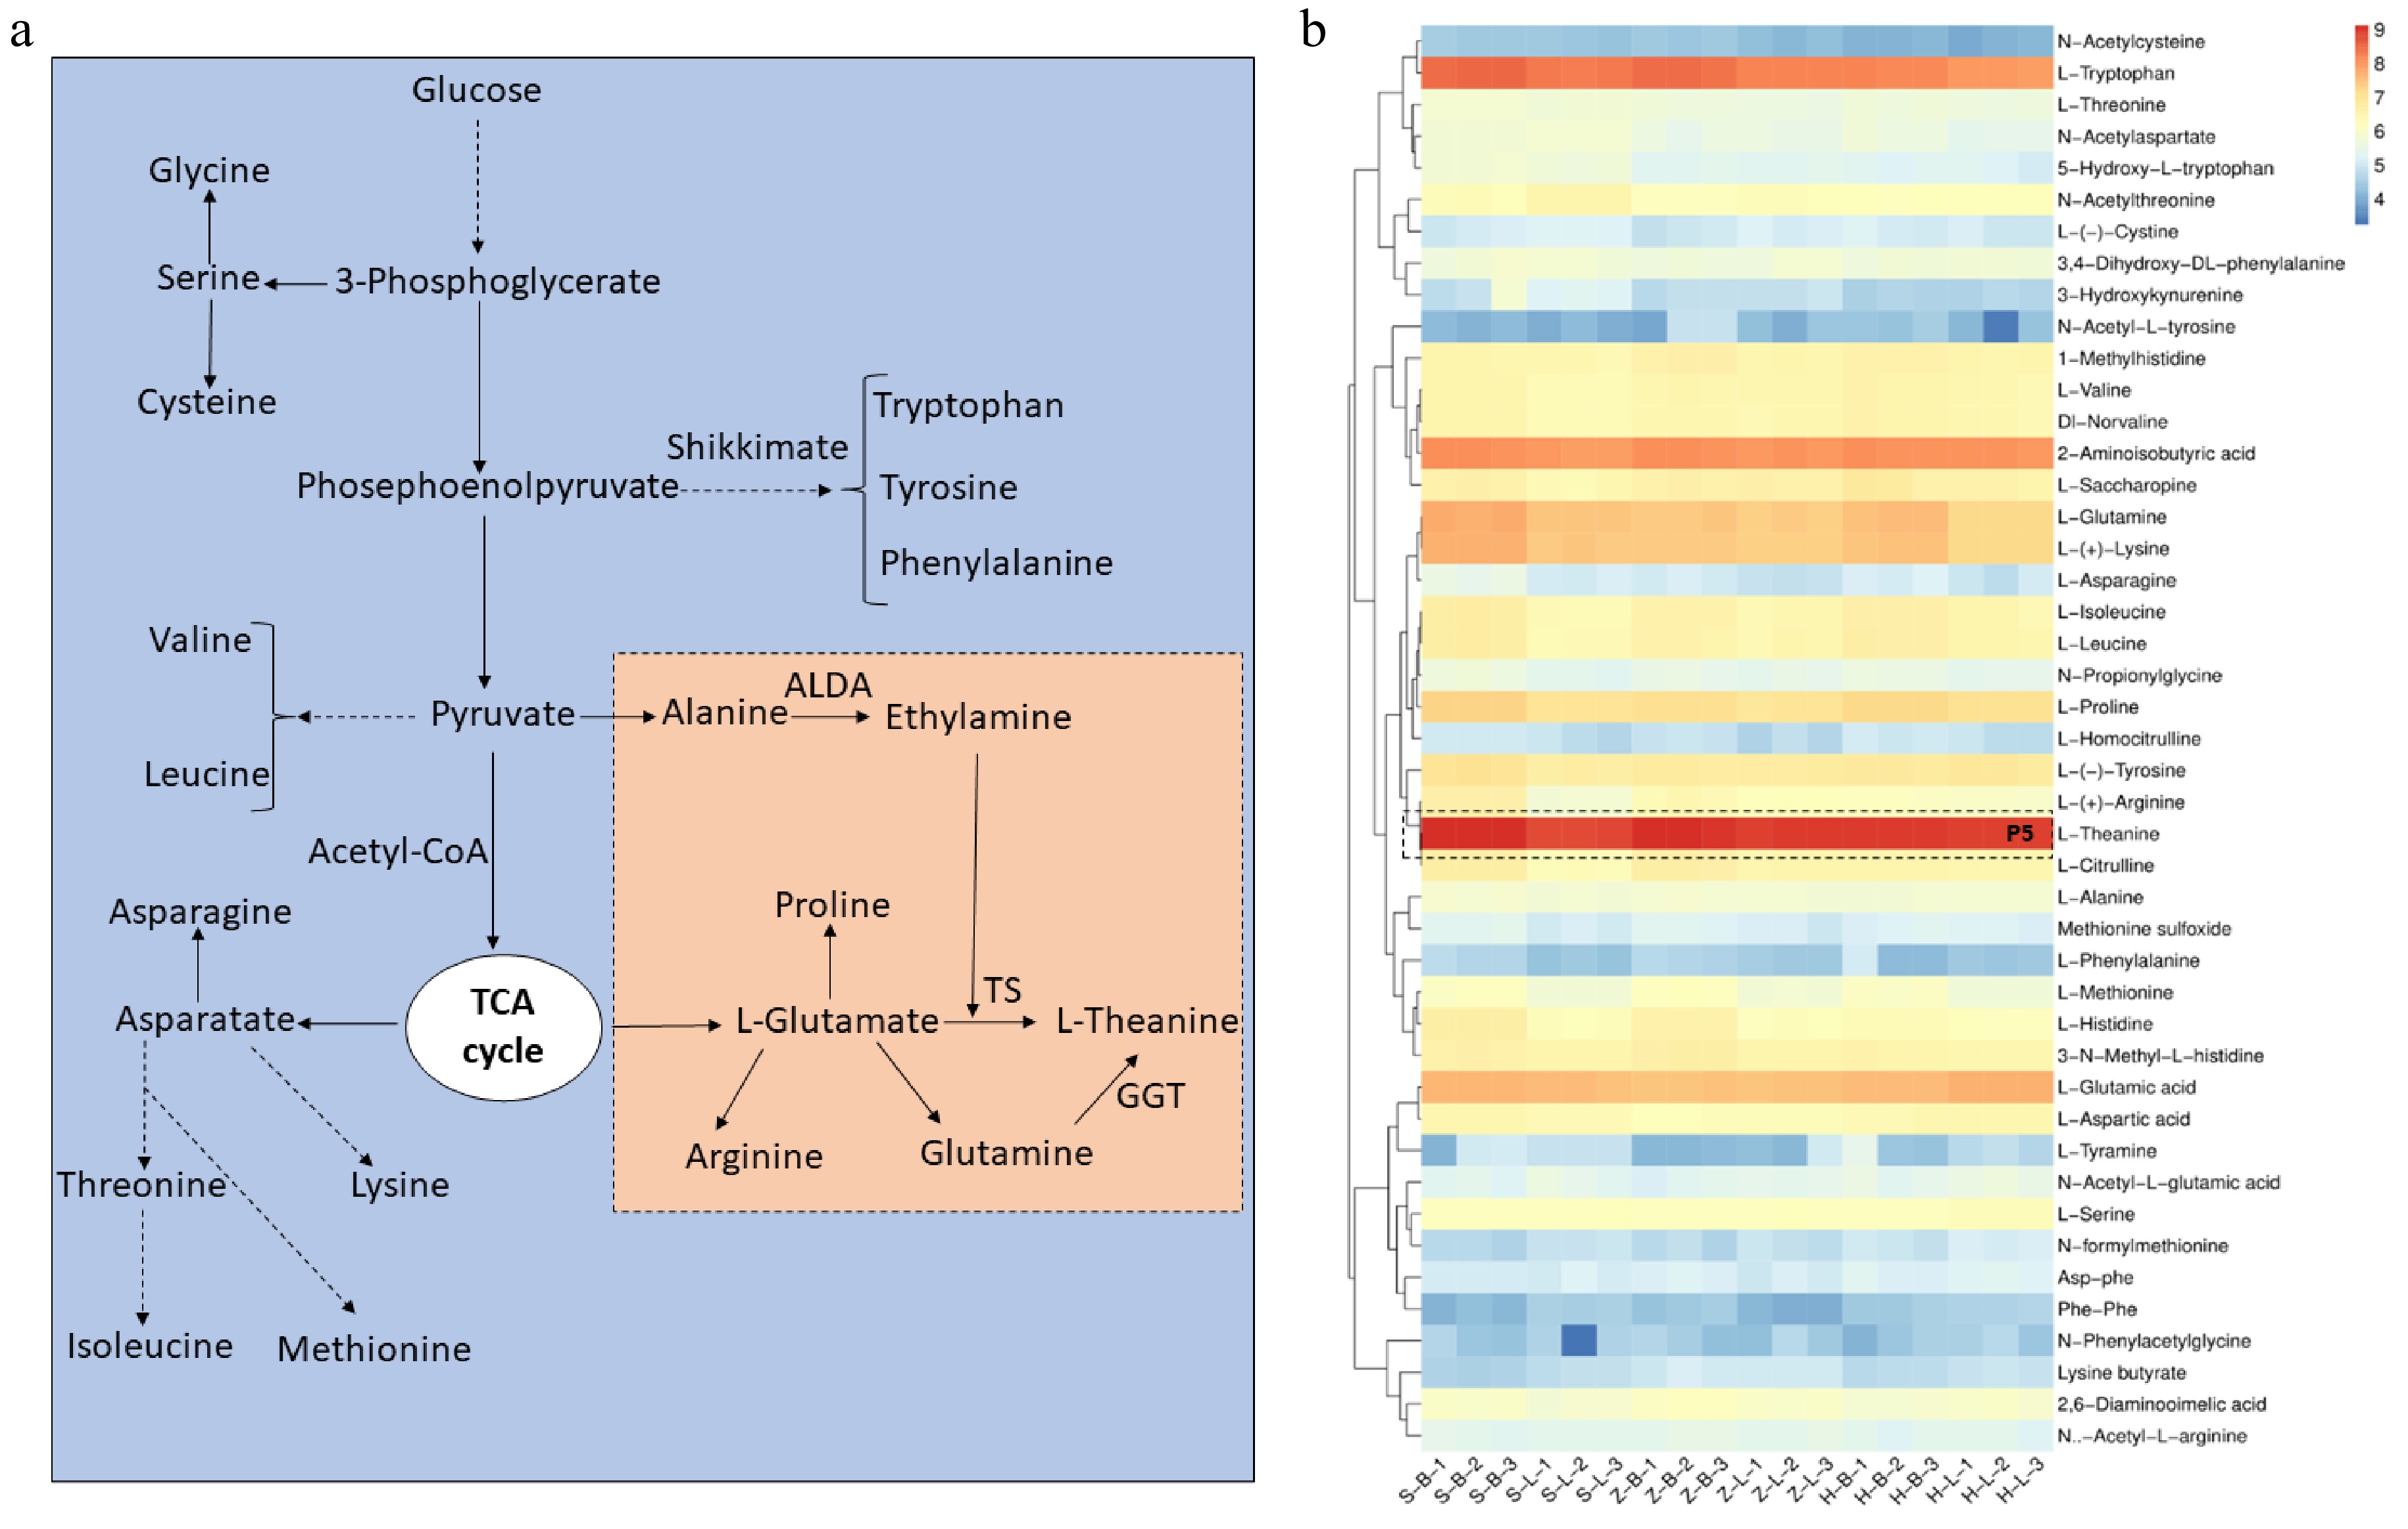
Figure 5.
L-theanine and other free amino acid metabolism pathways in tea plants. (a) L-theanine biosynthesis pathways in tea plant. (b) Other free amino acid and L-theanine relative content in different tissues of SCZ, HK and ZJ plants. OGAT: Glutamate synthase; ALDA: Alanine decarboxylase; GGT: γ-glutamyltranspeptidase; TS: Theanine synthetase.
Accumulation patterns of lipids in different tea cultivars
-
It was necessary to analyze lipids to compare the differences in metabolites of different tea qualities, as lipids are precursors of volatile aroma compounds. Targeted lipid metabolite detection was conducated on six samples from three different cultivars. Cluster analysis revealed that Octadeca-11E,13E,15Z-trienoic acid, LysoPC 18:3 (2n isomer), LysoPC 18:2 (2n isomer), MAG (18:3) isomer3, and α-linolenic acid show the highest content of all the detected lipids and derivatives in three tea cultivars (Fig. 6). Additionally, Lysopc, lysope, and MAG have a large number of isomers present (Fig. 6). Comparison between apical buds and leaves of the same cultivar unveiled that the majority of lipid metabolites accumulated in the apical buds, with similar patterns observed in all three cultivars (Fig. 6). It is worth noting that the accumulation pattern of lipids is similar to the accumulation pattern of free amino acids (Fig. 5b). Further examination of lipid accumulation patterns across three tea cultivars indicated that the 'ZJ' variety's apical buds accumulated relatively higher lipid content than the other two cultivars, as shown in Part P6 in Fig. 6. Conversely, there is not much difference in the accumulation amount in the leaves of Fig. 6. The observed accumulation patterns suggest distinctions in lipid accumulation among various tea cultivars, with a notable tendency for higher lipid accumulation in apical buds compared to leaves.
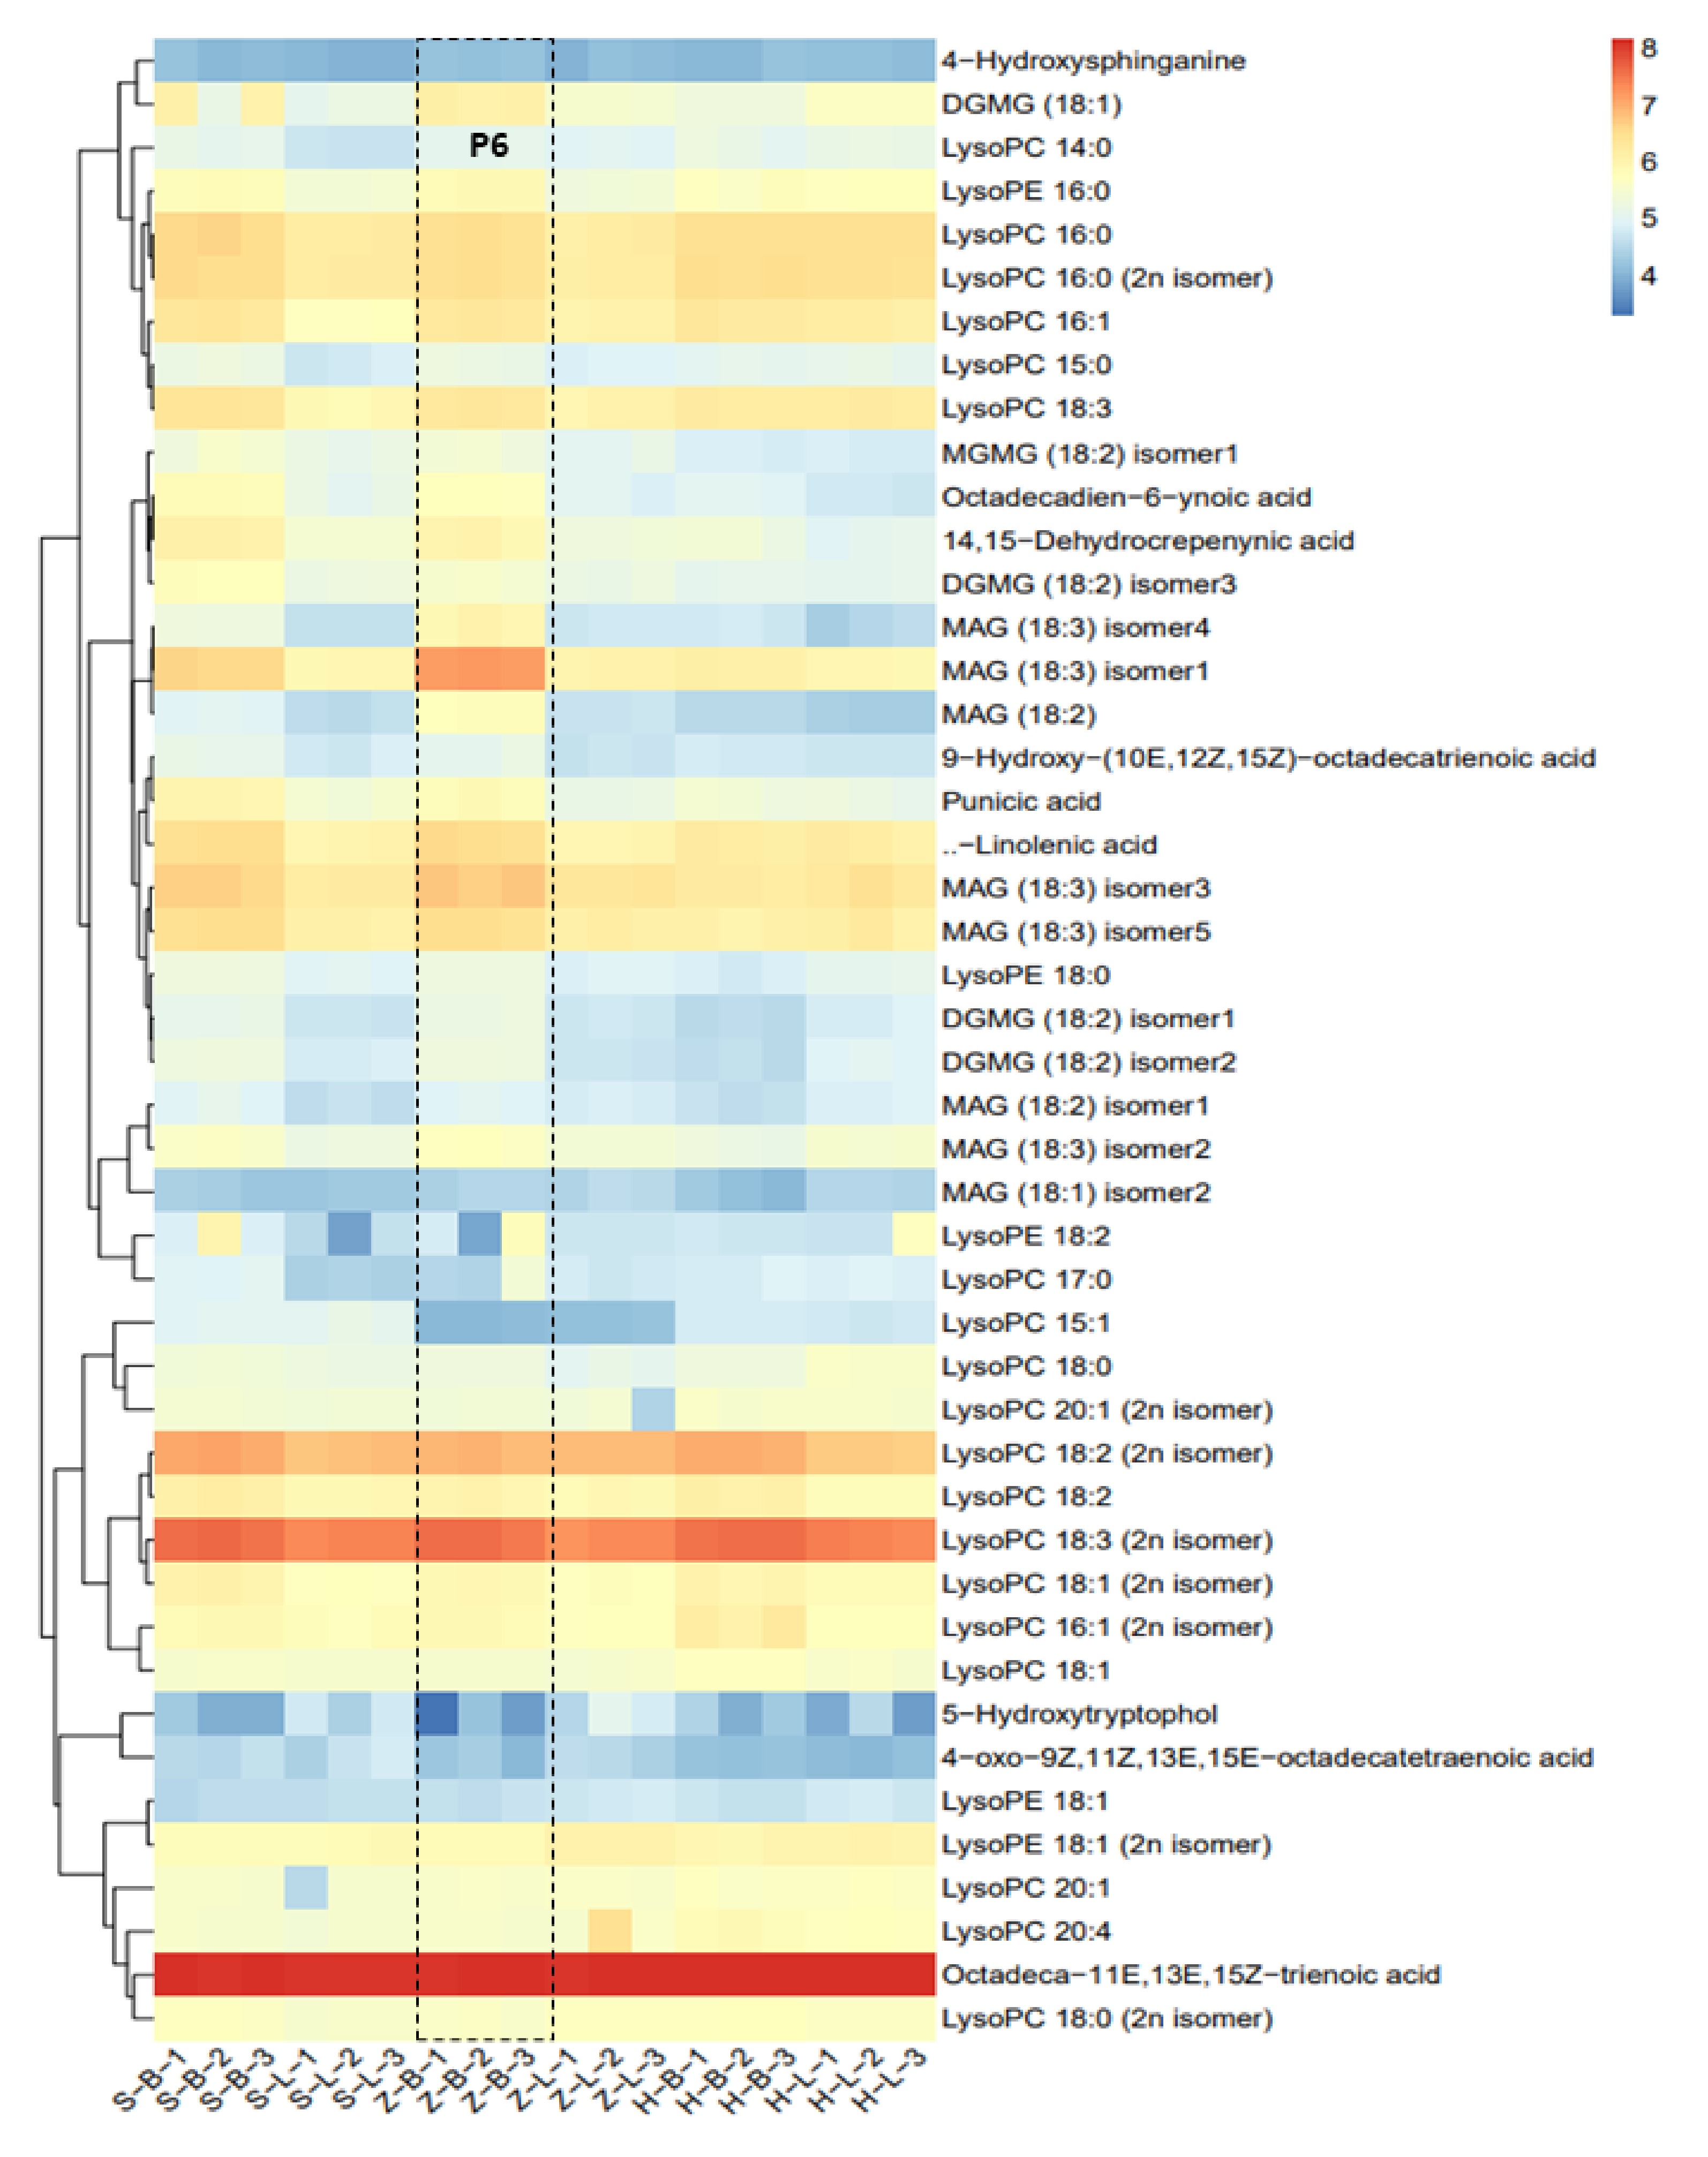
Figure 6.
Differential analysis of lipid metabolites. (MGDG - monogalactosyldiacylglycerol, GDG - digalactosyldiacylglycerol, C12:0 - lauric acid, C14:0 - myristic acid, C16:0 - palmitic acid, C16:1 - palmitoleic acid, C18:0 - stearic acid, C18:1 - oleic acid, C18:2 - linoleic acid, C18:3 - linolenic acid, C20:0 - arachidic acid, C20:1 - eicosenoic acid, C20:2 - eicosadienoic acid, C20:3 - eicosatrienoic acid, C20:4 - eicosatetraenoic acid, C22:0 - docosanoic acid, C24:0 - tetracosanoic acid, C24:1 - tetracosenoic acid, C26:0 - hexacosanoic acid, C28:0 - octacosanoic acid; DG - diacylglycerol, TG - triacylglycerol; PC - phosphatidylcholine; LPC - lysophosphatidylcholine, PE - phosphatidylethanolamine, PA - phosphatidic acid).
-
Tea is favored by consumers due to its abundance of various bioactive substances. Presently, there are about 3000 tea accessions in China[33]. Confronted with such a vast variety of tea cultivars, analyzing the quality metabolites of each tea cultivar remains a formidable challenge. Previous studies showed that flavonoids, amino acids, and lipids affect the quality of tea[1,12,28]. In 2020, Yu et al.[10] analyzed differential metabolites in 136 cultivars, the results showed that CSA tea accessions feature a high accumulation of diverse classes of flavonoid compounds, such as flavanols, flavonol mono-/di-glycosides, proanthocyanidin dimers, and phenolic acid.
In this study, We selected three tea cultivars with different color phenotypes (Fig. 1a), and analyzed the different metabolites through widely targeted metabolomics. Notably, flavonoids exert a significant influence on the bitterness and astringency of tea, and we can derive from analyzing the data that flavan-3-ols, flavones, flavonols, and glycosides mainly accumulate in green ('SCZ') and purple ('ZJ') cultivars Fig. 2. This result to some extent indicates that under the same processing technology, the bitterness and astringency of 'SCZ' and 'ZJ' cultivars exhibit a slightly greater intensity than that of 'HK'. In addition, 'ZJ' has accumulated a large number of anthocyanins, which is also the reason for the high bitterness and astringency of 'ZJ' (Fig. 4b). Free amino acids mainly provide the pleasant flavor of tea soup, especially L-theanine. By comparative analysis, the free amino acid content in the apical buds and 1st leaf of 'HK' is marginally higher than that of the two cultivars (Fig. 5), and this result indicates that 'HK' may have a more pleasant flavor, particularly in the apical buds. Lipids and their derivatives provide the aroma of tea, which directly affects the quality of tea. Fig. 6 showed that the accumulated lipids in 'ZJ' are slightly higher than those in 'SCZ' and 'HK', especially the apical buds. Drawing on the accumulation pattern of flavonoids and lipids, we infer that 'ZJ' not only exhibits pronounced bitterness and astringency but also boasts a heightened aromatic profile.
By comparative analysis of various metabolites of the three cultivars, we infer that there are significant differences in the accumulation of metabolites of different tea cultivars, and the main reason should be genetic differences[1,10]. Furthermore, under the same genetic background, there are also differences in metabolite accumulation in different tissues, leading to this result mainly due to differences in the transcription level of key genes involved in metabolite synthesis[42]. The above results provide insights into metabolite diversity and are useful for accelerated tea plant breeding.
-
The authors confirm contribution to the paper as follows: study conception and design: Chen L, Zhao X; analysis and interpretation of results: Zhao X, Chi N, Xu X, Lai J, Chen J; draft manuscript preparation and revision: Chen L, Zhao X. All authors reviewed the results and approved the final version of the manuscript.
-
All experimental data were from at least three independent experiments. The majority of data that support the findings of this study are available in the supplementary material of this article, others will be available upon request from the corresponding author, who will also be responsible for distribution of materials integral to the findings presented in this article in accordance with the policy described in the Instructions for Authors.
This work was supported by the Hainan Province postdoctoral surface funding project (RZ2300001314), the National Natural Science Foundation of China (U19A2030, 32072631), the China Agricultural Research System of MOF and MARA (CARS-019), and the Chinese Academy of Agricultural Sciences through the Agricultural Science and Technology Innovation Program (CAAS-ASTIP-2021-TRICAAS) to LC.
-
The authors declare that they have no conflict of interest. Liang Chen is the Editorial Board member of Beverage Plant Research who was blinded from reviewing or making decisions on the manuscript. The article was subject to the journal's standard procedures, with peer-review handled independently of this Editorial Board member and the research groups.
- Supplemental Table S1 Metabolite classification.
- Supplemental Table S2 Related parameters of Volcano plots.
- Supplemental Table S3 Differential metabolite analysis of Volcano plots.
- Copyright: © 2024 by the author(s). Published by Maximum Academic Press, Fayetteville, GA. This article is an open access article distributed under Creative Commons Attribution License (CC BY 4.0), visit https://creativecommons.org/licenses/by/4.0/.
-
About this article
Cite this article
Zhao X, Chi N, Xu X, Lai J, Chen J, et al. 2024. Metabolome profiling unveil the composition differences of quality of different tea cultivars. Beverage Plant Research 4: e023 doi: 10.48130/bpr-0024-0012 

Metabolome profiling unveil the composition differences of quality of different tea cultivars
- Received: 05 January 2024
- Revised: 01 February 2024
- Accepted: 22 February 2024
- Published online: 04 July 2024
Abstract: The tea plant is abundant in bioactive compounds, including flavonoids, amino acids, alkaloids, terpenoids, and lipids, which greatly affect tea quality and flavors. Despite there are many studies of metabolites about different tea cultivars, the composition differences of their biosynthesis and regulation still largely unknown. In this study, 505 metabolites were detected from the apical bud and 1st leaf of 'Shuchazao' (SCZ), 'Huangkui' (HK) and 'Zijuan' (ZJ) using widely-targeted metabolomics, including 192 flavonoids, 45 lipids, 59 amino acids and derivatives, and 28 phenolamides. Metabolite analysis showed that flavonols and anthocyanins are mainly distributed in the form of glycosides in three cultivars. Notably, anthocyanins and their glycosides are mainly accumulated in 'ZJ', indicating a correlation with the color attributes. EGCG emerged as the most abundant flavan-3-ols compound among the three cultivars. Simultaneously, L-theanine represented the predominant free amino acid, mainly concentrated in the apical bud compared to the 1st leaf. Similarly, lipids, akin to free amino acids, predominantly accumulated in the apical buds of all three cultivars. These findings offer valuable insights into the genetic and metabolite diversity, augmenting our understanding of the biosynthesis of specialized metabolites in tea plants.
-
Key words:
- Metabolomic /
- Flavonoids /
- Amino acid /
- Lipids /
- Tea plant