


-
Resin-based dental composites are one of the most extensively used restorative materials, because of their great aesthetics, conservative tooth preparations, and acceptable restoration lifespan[1]. In recent years, aesthetic considerations have particularly influenced the development of dental restorative materials. In modern dentistry, patients' requirements are equally accountable in terms of function and appearance[2]. The longevity of the restoration is determined by the kind of restorative material used and the effect of the degradation process on its mechanical parameters such as wear resistance, bond strength, tooth-to-restoration interface integrity, aesthetic quality, surface hardness, and roughness[3].
Color instability stands out as one of the primary factors leading to the failure of restorations. Extrinsic and intrinsic factors can induce discoloration of tooth-colored resin-based materials. The intrinsic factors involve the discoloration of the resin material itself which could be due to modification of the resin matrix and the interface between the matrix and fillers. External factors that affect the staining susceptibility include the type of staining agent, the duration of exposure, and its compatibility with the matrix of the restorative material[4].
The durability of dental materials in the oral cavity is greatly determined by their ability to resist dissolution or disintegration, making it one of the most crucial attributes. Surface deterioration of dental composites is caused by diffusion into the resin plasticizing the polymer matrix, lowering its mechanical characteristics[5]. Surface erosion increases the retention of microorganisms to the tooth structure and restorative materials owing to the rougher surface. This results in faster microbial colonization and biofilm maturation, increasing the risk of dental caries and periodontal disease as well as the restoration's sensitivity to discoloration[5].
To reduce chair time and technique sensitivity, clinicians prefer restorative materials and procedures that allow for the adoption of streamlined therapeutic protocols. Since color selection can be difficult and dependent on environmental and operator factors, a trend to simplify shade selection has resulted in the creation of universal dental composites[5,6]. These materials have a universal opacity and a limited number of Vita shades, making them ideal for application in a single shade increment to match a variety of tooth color shades. A single-shade universal dental composite, namely Omnichroma, was recently designed to reportedly match all 16 VITA Classical shades, ranging from A1 to D4, enabling a shade match for every tooth color[6].
This study aimed to investigate the impact of various alcoholic beverages on the color stability and surface roughness of a single-shade universal nano-hybrid dental composite material called Palfique Omnichroma (Tokuyama Dental Corporation, Tokyo, Japan). The objectives of the current in-vitro analysis are as follows:
(1) To assess the color changes in evaluated dental composite resin upon immersion in alcoholic media;
(2) To assess the surface roughness changes in evaluated dental composite resin upon immersion in alcoholic media;
The null hypothesis tested was that alcoholic solutions do not affect the colorimetric and surface profilometric properties of the single-shade universal dental composite material.
-
The study was conducted at Saveetha Dental College and Hospital, Chennai in January 2022. This in-vitro study is being reported following the CRIS (Checklist for Reporting In-vitro Studies) guidelines[7].
Sample preparation
-
The study's sample size was calculated using G*Power[8], based on a previous evaluation conducted by Da Silva et al.[3]. The calculation was performed using an effect size of 0.40, a significance level of 5%, and a power of 90%.
Eighty-four dental composite disc samples were prepared using a stainless-steel mold with a 10 mm diameter and a 2 mm thickness[8]. The resin-based dental composite was inserted into the mold and sandwiched between two thin glass slides after being covered with a translucent Mylar strip[8]. The samples were light cured using a Light-emitting diode (LED) unit (2300 mw/cm², Woodpecker O-Light 1 Second Curing light unit, DTE Woodpecker, Guangxi, China). The samples were then subjected to finishing and polishing using polishing discs of the Super-Snap polishing system (Shofu Inc, Kyoto, Japan) according to the manufacturer's instructions. After the preparation of samples was complete, they were stored in distilled water for 24 h[8].
The resin-based dental composite material samples were assigned into three groups of 28 samples, using a computerized randomization allocation sequence (
www.sealedenvelope.com/ ; seed number: 116408898880394).Group A: Beer (Kingfisher Strong beer, United Breweries Group, Bengaluru, India)
Group B: Whisky (Royal Challenge Premium Whisky, United Spirits Ltd., Bengaluru, India)
Group C: Artificial saliva (Wet Mouth, ICPA Health Products Ltd., Mumbai, India).
The composition of the evaluated resin and beverage solutions is described in Tables 1 and 2. Before immersion of the prepared specimens, the pH of the beverage solutions used during the investigation was determined using a pH meter (Auto Deluxe pH meter, model number: LT-10, Labtronics, Haryana, India). In accordance with ISO 4049:2009, every sample was submerged in 10 mL of their respective group solution[9]. After 24 h of storage in distilled water, the samples were blotted dry with tissue paper. Color (L*, a*, b*) and surface roughness (Ra) baseline values of each sample were taken for each group.
Table 1. Composition of the dental composite resin material used in the study.
Material Manufacturer details Type of material Matrix Filler components Filler load Omnichroma Tokuyama Dental,
Tokyo, JapanSupra-nano spherical
(average particle size of 200 nm)TEGDMA, UDMA Spherical shaped, uniformly sized supra-nano
spherical filler (260 nm spherical SiO2-ZrO2)79 wt%
(68 vol%)UDMA: Urethane dimethacrylate, TEGDMA: Triethylene glycol dimethacrylate. Table 2. Specifications and composition of the evaluated solutions.
Beverages Manufacturer details Composition* Alcohol by volume (ABV) pH Beer Kingfisher Strong Beer, United Breweries Group, Bengaluru, India Water, malted barley, rice/maize, sugar, ethyl alcohol, hops and yeast 4.8% 4.1 Whisky Royal Challenge Premium Whisky, United Spirits Ltd., Bengaluru, India Demineralized water, grain-neutral spirit, malt spirit, scotch 42.8% 3.76 Artificial saliva Wet Mouth, ICPA Health Products Ltd., Mumbai, India Water, glycerin, sorbitol, propylene glycol, PEG 40 HCO, poloxamer, sodium benzoate, sodium CMC, flavour, cetylpyridinum chloride, parabens, xylitol, xanthan gum, disodium hydrogen phosphate, sodium dihydrogen phosphate 0% 7.1 * Information provided by the manufacturers. Sample immersion protocol
-
The immersion protocol was maintained for 15 d. Each group's samples were immersed in their respective beverage for 15 min daily, with the beverage sample being replaced each time[8]. Each sample was individually stored in distilled water while not immersed in their respective beverage groups. The color change and surface roughness measurements were recorded after 15 d.
Color stability analysis
-
The colorimetric assessment was done according to the protocol suggested by Aydin et al.[10]. All specimens were subjected to colorimetric evaluation before and after the immersion protocol using a reflectance spectrophotometer (Spectrophotometer CM5, Konica Minolta, Tokyo, Japan), based on the CIEL*a*b* assessment system[11], as seen in Fig. 1. The L*, a*, b* were obtained for each specimen. The CIELAB color difference (ΔE) was calculated for each specimen by the following formula[12]:
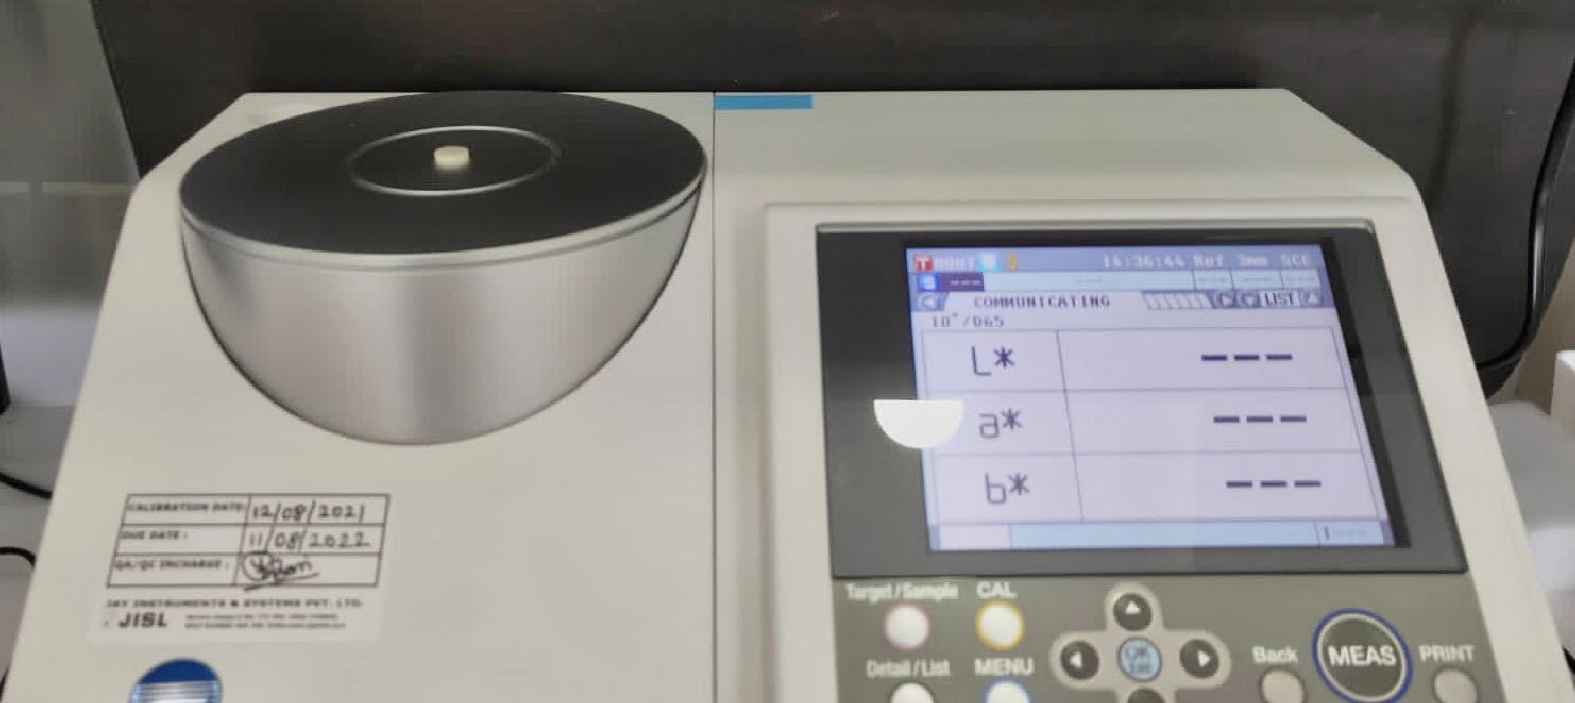
Figure 1.
Colorimetric assessment using Spectrophotometer (Spectrophotometer CM5, Konica Minolta, Tokyo, Japan).
$ \rm \Delta E = ([L^*f-L^*i]^2 + [a^*f-a^*i]^2 + [b^*f-b^*i]^2)^\frac{1}{2}$ where, ΔE is color change, L*f is final L*, L*i is initial L*, a*f is final a*, a*i is initial a*, b*f is final b*, and b*i is initial b* value.
Surface roughness evaluation
-
The assessment protocol was carried out based on the investigation performed by Meenakshi & Sirisha[13]. The surface roughness was measured with a contact stylus profilometer (Mitutoyo SJ-310, Tokyo, Japan), as seen in Fig. 2. The samples were stabilized at the time of measurement. At the extreme of the disk-shaped sample, the stylus tip of a 2.5 micrometer radius was positioned and was made to move in three different directions[13]. The average of those three values was recorded and the measurement of Ra (in micrometers) was obtained. The profilometer was calibrated before each measurement and the mean of the values was obtained. This profilometric assessment is performed before and after the immersion protocol.
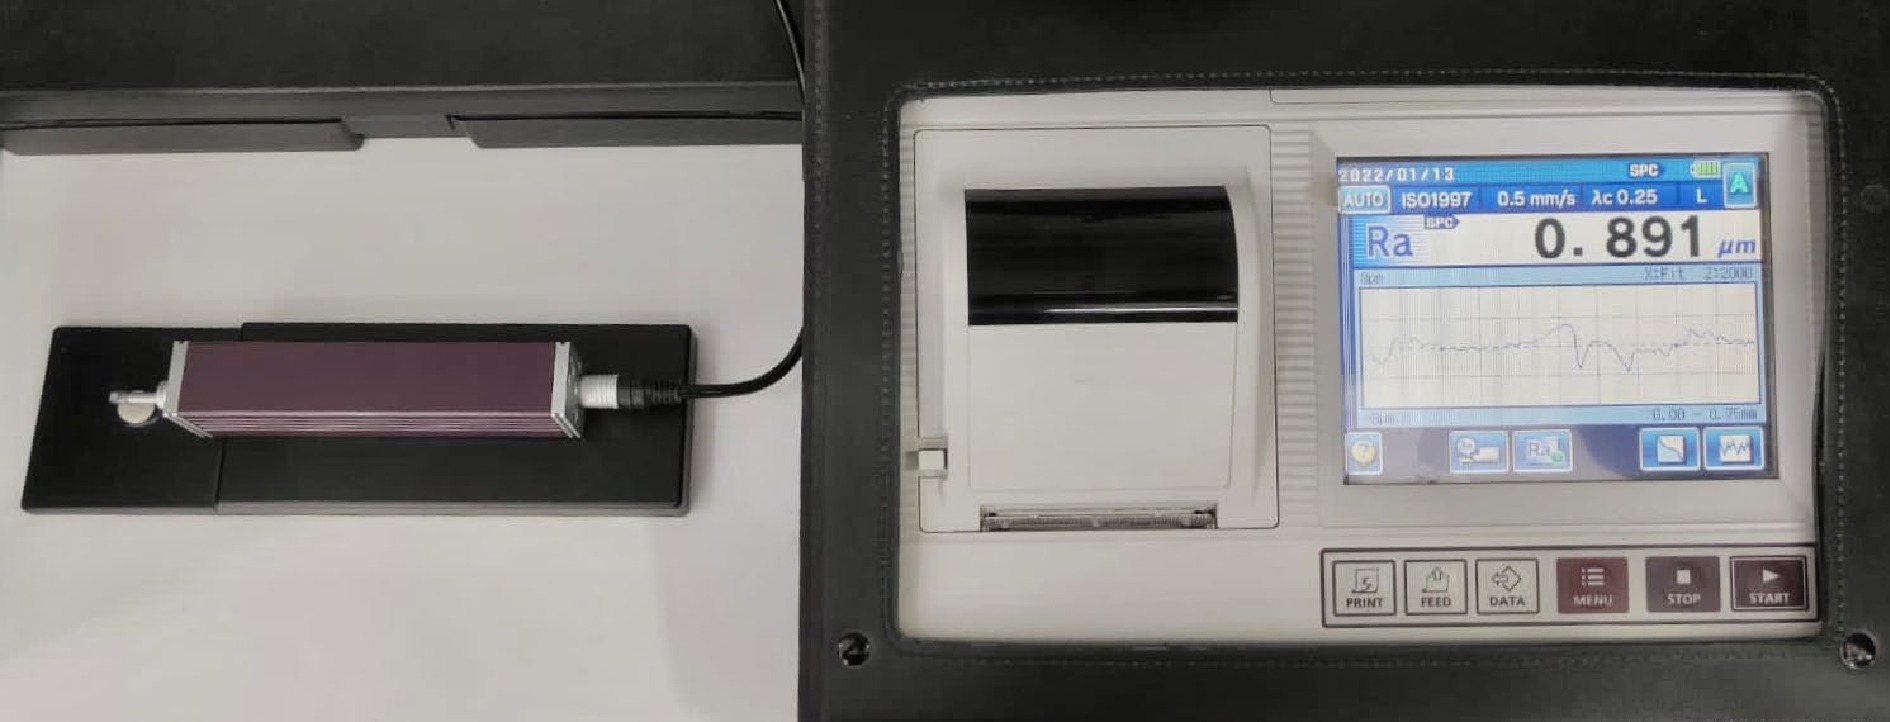
Figure 2.
Surface roughness assessment using surface profilometer (Mitutoyo SJ-310, Tokyo, Japan).
Statistical analysis
-
The statistical analysis was performed using the IBM SPSS Statistics version 23 (IBM Inc., Armonk, New York, USA) software. The Shapiro-Wilk test was used to determine the data distribution for color change and surface roughness assessment. Kruskal-Wallis test was used to determine the color change of the dental composite resin immersed in different solutions, followed by Tukey's post hoc test for intergroup comparisons. Surface roughness values were subjected to a one-way analysis of variance (ANOVA) test, followed by Tukey's post hoc test for intergroup comparisons. All the tests performed in the study were carried out with a statistical significance level of 5%.
-
A single shade dental composite, namely Omnichroma has been considered for the study to check the color stability and surface roughness changes on placement in three different immersion solutions.
Color stability analysis
-
The Kruskal-Wallis test demonstrates that there is a significant difference in color change of the dental composite between the three immersion solution groups (Table 3). The maximum discoloration took place in beer, followed by whisky and artificial saliva (Table 4, Fig. 3).
Table 3. Means ± standard deviation and p-value of color change (ΔE) values in the beverage group.
Beverage group Group A Group B Group C p-value Color change 1.07 ± 0.58 0.79 ± 0.43 0.75 ± 0.39 0.029* * p < 0.05 is statistically significant. Table 4. Inter-group comparison of evaluated beverages in terms of color stability using Tukey's post hoc test.
Beverages Beverages Mean difference Sig. Beer Whisky 0.28 0.074 Artificial saliva 0.32 0.033 Whisky Beer −0.28 0.074 Artificial saliva 0.04 0.940 Artificial saliva Beer −0.32 0.033 Whisky −0.04 0.940 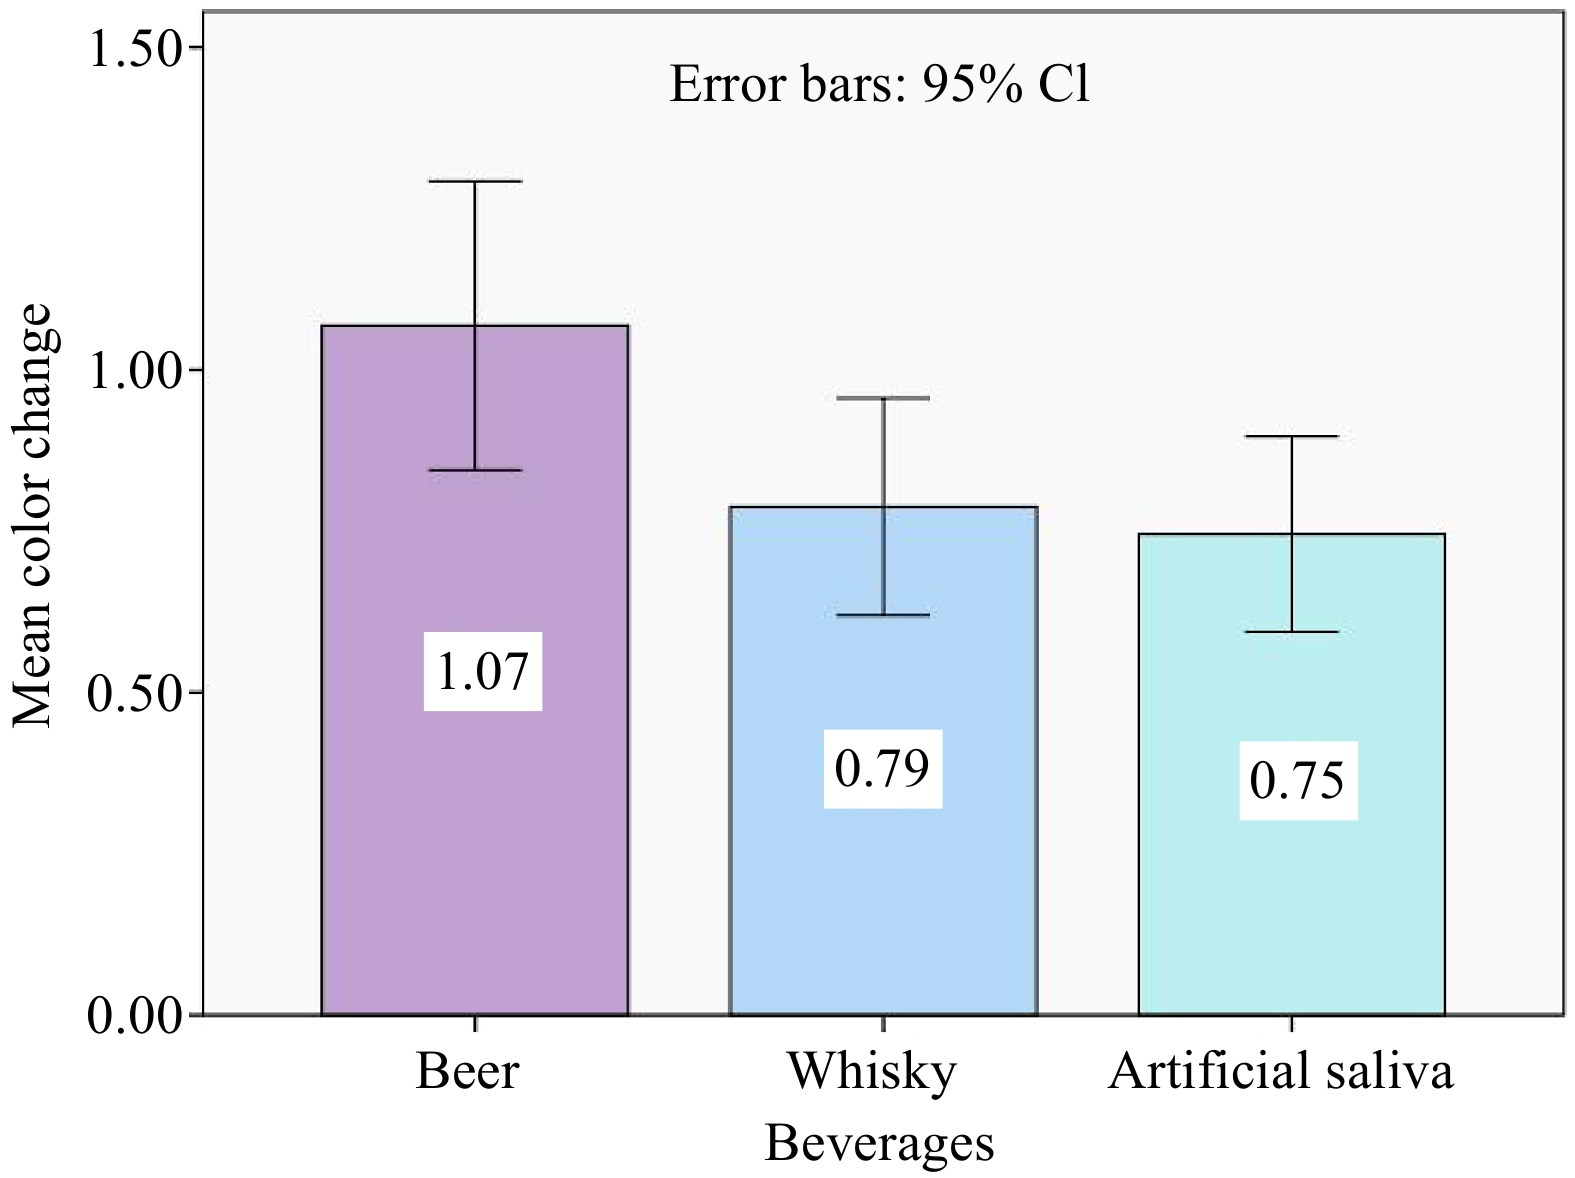
Figure 3.
Bar graph depicting the mean color change (ΔE) of evaluated resin after 15 days of immersion in different solutions. The standard error is represented by the error bars.
Surface roughness analysis
-
The mean values of surface roughness (Ra) are depicted in Table 5 and Fig. 4. In the initial and 15-d intervals, Table 6 demonstrates that there was no significant difference in surface roughness between the resin specimens before immersion in the solutions assessed. Post-immersion surface roughness evaluation shows a significant difference in surface roughness in comparison of beer with the other two evaluated solutions.
Table 5. Means ± standard deviation and p-value of surface roughness values at different immersion periods.
Beverage groups Group A Group B Group C p Pre-immersion
(baseline)0.40 ± 0.24 0.39 ± 0.20 0.39 ± 0.23 0.978 Post-immersion
(after 15 d)0.91 ± 0.30 0.70 ± 0.32 0.55 ± 0.29 0.000* * p < 0.05 is statistically significant. 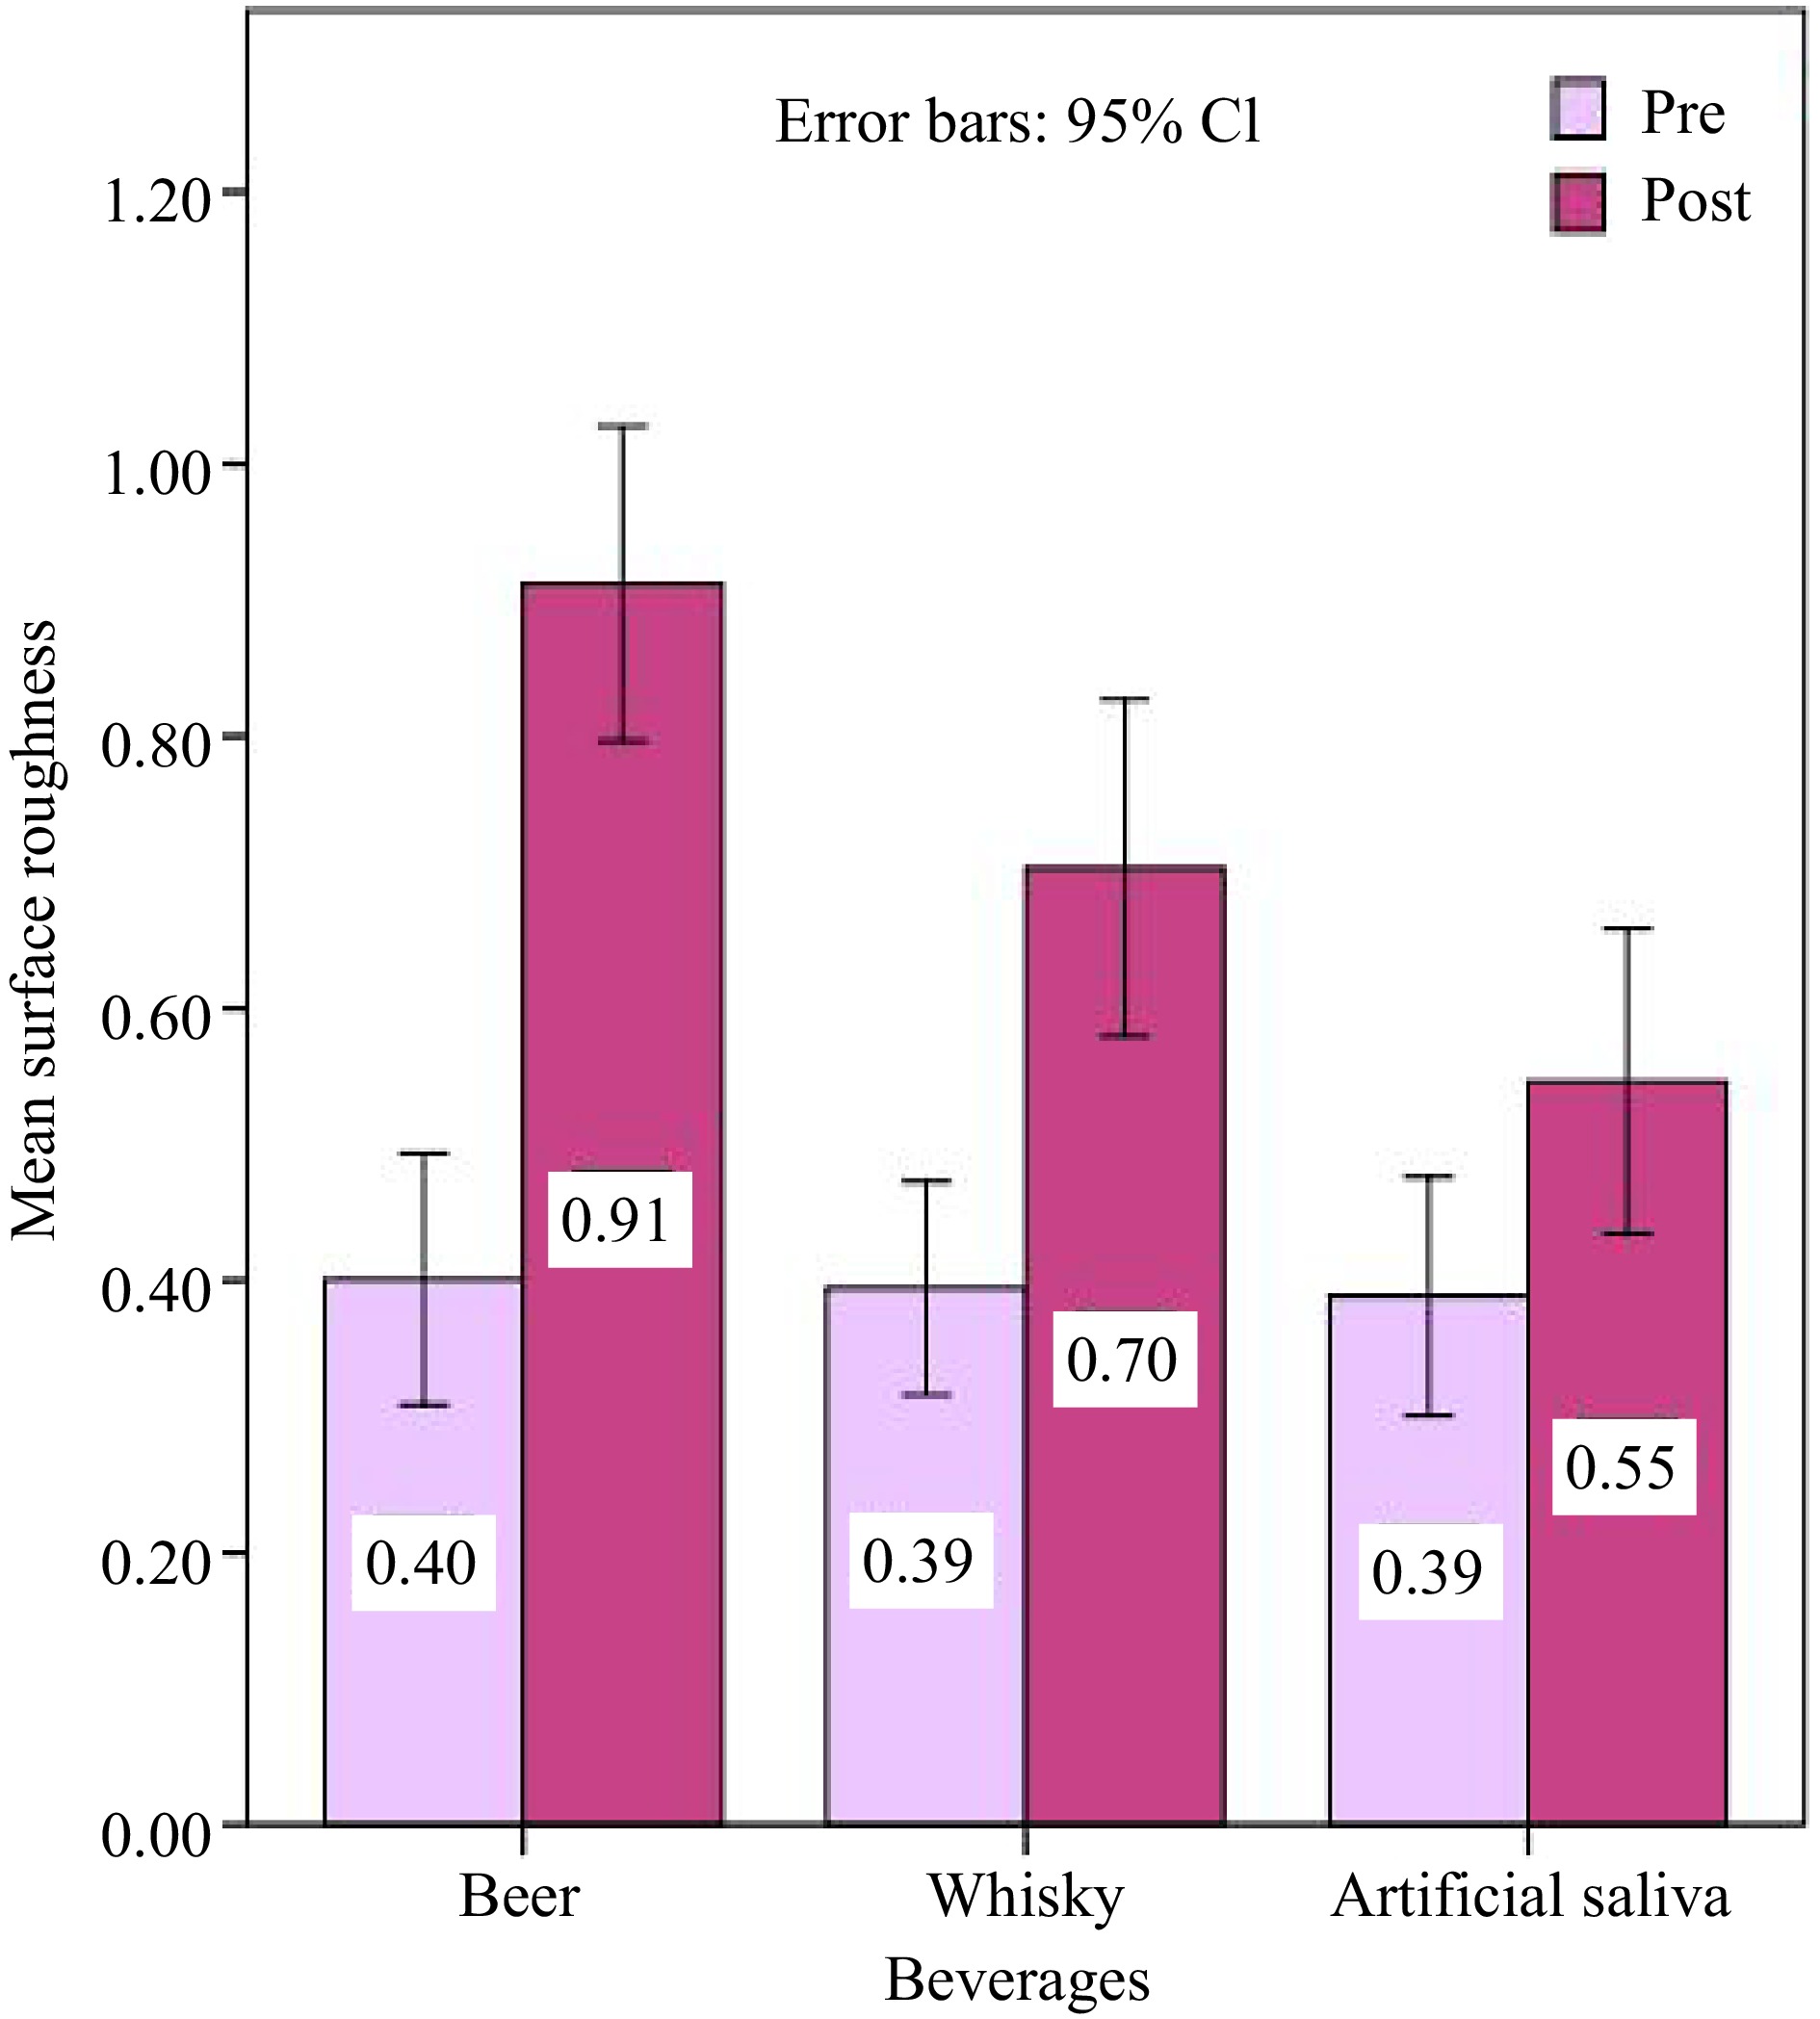
Figure 4.
Bar graph representing the average surface roughness (Ra) values of evaluated resin at baseline and after 15 days of immersion in different solutions. The standard error is represented by the error bars.
Table 6. Inter-group comparison of evaluated beverages in terms of surface roughness using Tukey's post hoc test.
Beverages Beverages Mean difference Sig. Pre immersion Beer Whisky 0.006 0.993 Artificial saliva 0.012 0.976 Whisky Beer −0.006 0.993 Artificial saliva 0.005 0.995 Artificial saliva Beer −0.012 0.976 Whisky −0.005 0.995 Post immersion Beer Whisky 0.209 0.031 Artificial saliva 0.366 0.000 Whisky Beer −0.209 0.031 Artificial saliva 0.157 0.133 Artificial saliva Beer −0.366 0.000 Whisky −0.157 0.133 -
An ideal restorative material would replicate the aesthetic attributes of natural teeth, be biocompatible, color stable, and gentle to opposing dentition while remaining resistant to abrasion. In the presence of oral fluids, the substance should exhibit low solubility. The color stability of dental composite resins is influenced by several factors, including the composition of the resin matrix, the size of filler particles, the concentration of initiators, activators, and inhibitors, as well as the degree of polymerization. These factors collectively play a significant role in determining the long-term color stability of dental composites[11].
Chemical factors influence the degradation process of these dental composite resin restorations resulting in wear and abrasion shortening their lifespan[14]. The current study was carried out to determine the effect of the consumption of alcoholic beverages on the color stability and surface characteristics of the dental composite resin.
In this in-vitro evaluation of color stability, the dental composite resin was subjected to immersion in various alcohol media, and significant differences in color change were observed. It is important to note that the tooth surfaces are briefly in contact with food or drink during ingestion before saliva washes it away. To achieve this, a 15-min daily immersion in each sample's appropriate beverage was chosen as the immersion regimen[11]. The samples were placed in their respective beverages for 15 min once a day for 15 d. The samples were stored in distilled water for the rest of the day. To accurately measure and record color differences, the CIELab* system was chosen due to its ability to detect even the smallest variations in color[15]. Maximum discoloration has been seen with the dental composite subjected to beer.
Tokuyama Dental America has introduced Smart Chromatic Technology in Omnichroma, a dental composite material that incorporates uniformly sized spherical filler particles. These filler particles can modify the transmission of light specifically within the red-to-yellow region of the color spectrum. This unique feature enables the material to effectively match the color of the patient's adjacent teeth, providing a more seamless and natural appearance[16]. Omnichroma contains 260 nm silica and zirconia fillers, as well as UDMA/TEGDMA monomers.
Previous studies have reported that the staining susceptibility of dental composite resins is influenced by their surface characteristics and composition[17]. The properties of dental composites are widely recognized to be influenced by multiple factors, such as the type and quantity of the polymeric matrix material, as well as the size and distribution of filler particles. The presence of stains, which occurs when beverages come into contact with the resin, is attributed to the adsorption or absorption of colorants by the resins. The resin's susceptibility to extrinsic stains is regulated by its capacity to absorb water at a certain rate[18,19]. Indeed, if the resin matrix can absorb water, it is also likely to absorb other liquids, resulting in discoloration over time. The primary cause of water sorption is direct absorption within the resin matrix. While glass filler particles themselves cannot absorb water, they can assist in water adsorption at the material's surface. The extent of water sorption is influenced by factors such as the material's resin content and the resin-filler interface's durability. Extreme water sorption leads to resin expansion and plasticization, which reduces the overall lifespan of the dental composite resin. Additionally, it triggers hydrolysis of the saline, resulting in the formation of microcracks. As a consequence, stain penetration and discoloration occur primarily through microcracks or interfacial pores at the interface between the filler and matrix[4]. Large filler particles are more susceptible to water aging discoloration than small filler particles, which is consistent with the hydrolytic breakdown of the matrix filler interfaces[5]. As a result, dental composites with larger filler particles have greater color permeability than compared to those with smaller filler particles.
Values of ΔE* higher than or equal to 3.3 are visually noticeable and are considered clinically unacceptable to 50% of the trained observers[20]. In the current study, the evaluated dental composite resin demonstrated ΔE* values lower than 3.3 when immersed in all solutions. After 15 days, the color change values reached 2.7 for the Beer group and approximately 2.2 for the Whisky group.
The beverages used in the study were predominantly acidic with a pH of around 4 for beer and whisky. Previous studies reported that dental composite materials' wear resistance was significantly impacted by lower pH[21]. The surface integrity of dental composite resins may be degraded by low pH and alcohol. The surface of dental composite resins may become softer as a result of the resin matrix absorbing alcohol molecules from beverages. This explains how the roughness of the surface of the dental composites that were submerged in alcoholic beverages changed[22]. The study results revealed that immersion of the samples led to significant discoloration and increased surface roughness of the dental composite resin. This can be attributed to the ability of acidic media to soften resin-based restorative materials. Among the beverages tested, the maximum change in both color and surface roughness was observed in the dental composite samples immersed in beer, compared to whisky and artificial saliva.
The findings of this investigation showed that the hybrid material evaluated was prone to discoloration in a variety of liquids over a prolonged length of time[23]. Although the staining process may be influenced by a variety of circumstances, it may also be influenced by incomplete polymerization and surface reactivity[24]. In fact, other variables can have a significant influence on the long-term durability of dental composite frameworks, such as depth of cure[25], curing type[26], and interface contamination[27]. Therefore, future studies are needed involving also these important factors.
According to the Food Safety and Standards (Alcoholic Beverages) Regulations, 2018, 'alcoholic beverage' refers to a beverage or liquor or brew containing more than 0.5 percent abv (alcohol by volume; percent of ethyl alcohol in total volume)[28]. The current study assesses the effect of alcoholic beverages with 4.8% and 42.8% abv on the dental composite resin. As discussed above, the surface integrity of the dental composite may be degraded due to the diffusion of alcohol into the resin plasticizing the polymer matrix. Furthermore, changes in the surface characteristics of dental composite resin may result in color instability. However, with a change in the percentage of abv in the beverages, the extent of degradation of surface characteristics of dental composite may vary. Thus, more studies are required to determine the surface characteristics of the evaluated dental composite when exposed to different alcohol content beverages.
All in-vitro investigations have obvious methodological constraints. The limitations of the study include that the resin samples evaluated had smooth, even surfaces, whereas resin restorations in the oral environment have irregular surfaces. In addition, unlike in the oral cavity, where solutions are in a dynamic state, the samples in this investigation were dipped in static staining solutions. Additionally, the study did not mimic aspects like heat changes or abrasion, thereby incapable of simulating the oral environment. Therefore, it is essential to recognize the need for subsequent clinical trials to validate and extrapolate the findings of these in-vitro investigations to real-world clinical scenarios, enabling a more comprehensive understanding of the performance and durability of resin restorations in the dynamic and multifaceted oral environment. However, clinical trials may have limitations such as small sample size, selection bias, incomplete data, placebo effect, ethical considerations, cost, and time, which must be considered when interpreting the results.
It is important to note that the results of this investigation may not directly translate to in vivo conditions. Nevertheless, the findings of this study offer valuable insights into the potential behavior of the single-shade dental composite resin when exposed to different beverages. These insights can potentially impact the clinician's choice of materials and the patient's ability to modify their dietary habits.
-
Within the limitations of the study, the current in-vitro colorimetric and surface profilometric assessment lead to the following conclusions:
(1) All the solutions had an impact on the change in color and surface roughness of the dental composite;
(2) Immersion of this single-shade dental composite in beer for 15 d had an aggressive effect in terms of color change when compared to other solutions evaluated;
(3) Maximum change in surface roughness upon immersion of the evaluated dental composite resin for 15 d was observed in group A (Beer) samples followed by group B (Whisky) and group C (Artificial saliva).
-
The authors confirm contribution to the paper as follows: study conception and design: Vejendla I, Adimulapu HS; data collection: Vejendla I; analysis and interpretation of results: Vejendla I, Solete P; draft manuscript preparation: Vejendla I, Adimulapu HS, Malli Sureshbabu N. All authors reviewed the results and approved the final version of the manuscript.
-
All data generated or analyzed during this study are included in this published article.
This research did not receive any specific grant from funding agencies in the public, commercial, or not-for-profit sectors.
-
The authors declare that they have no conflict of interest.
- Copyright: © 2024 by the author(s). Published by Maximum Academic Press, Fayetteville, GA. This article is an open access article distributed under Creative Commons Attribution License (CC BY 4.0), visit https://creativecommons.org/licenses/by/4.0/.
-
About this article
Cite this article
Vejendla I, Adimulapu HS, Malli Sureshbabu N, Solete P. 2024. Effect of alcoholic beverages on optical and surface profilometric properties of a universal single shade dental composite: an in-vitro study. Beverage Plant Research 4: e031 doi: 10.48130/bpr-0024-0018 

Effect of alcoholic beverages on optical and surface profilometric properties of a universal single shade dental composite: an in-vitro study
- Received: 20 January 2024
- Revised: 19 March 2024
- Accepted: 01 April 2024
- Published online: 03 September 2024
Abstract: This in-vitro study aimed to evaluate the changes in color stability and surface roughness of a universal single-shade dental composite, Omnichroma on immersion in different alcoholic beverages. Eighty-four Palfique Omnichroma (Tokuyama Dental Corporation, Japan) dental composite discs were fabricated and categorized into three groups according to their immersion medium: Group A - Beer, Group B - Whisky (test groups) and Group C - Artificial saliva (control group). The samples were immersed in each beverage for 15 min daily for 15 d. The color change assessment was done using a reflectance spectrophotometer. The surface roughness measurements were analyzed with a contact stylus profilometer. The Kruskal-Wallis test and one-way analysis of variance (ANOVA) were applied for statistical analysis. Beer produced the most discoloration and change in surface roughness, followed by whisky, whereas artificial saliva exhibited the least color change and change in surface roughness after immersion for 15 d in the evaluated dental composite resin. The evaluated alcoholic solutions and immersion time have an impact on the color stability and surface roughness of the dental composite resin. The ingestion of colored beverages could potentially influence both the aesthetic and physical attributes of dental composite materials. The results of this study can provide valuable insights to clinicians in selecting appropriate restorative materials and advising patients on the potential impact of their dietary habits on the longevity of dental restorations. Hence, this study is significant as it addresses an important clinical concern that can have a significant impact on the success of restorative treatments.
-
Key words:
- Dental composite resin /
- Alcoholic beverages /
- Surface roughness /
- Discoloration /
- Color stability /
- Dentistry