


-
Bighead carp (Aristichthys nobilis) is a primary freshwater fish in the aquaculture industry with a low price, large catch quantity, and short growth cycle[1]. According to the 2022 Fishery Statistical Yearbook of China, the total output of bighead carp reached 3.177 million tons in 2021, ranking third among freshwater aquaculture species. The head of bighead carp accounts for approximately one-third or even one-half of the body length, and the delicacies made from it, such as chopped pepper fish head and blanched silver carp, are popular among consumers. However, due to the inherent high protein and moisture content of fish, post-mortem microbial growth occurs rapidly, resulting in accelerated deterioration[1]. Shi et al. developed an EEM-BPNN model to predict the TAC, TBARS, TVB-N, and K value of bighead carp heads in the storage periodiod[2]. Recently, the Chinese government has been increasingly focused on the protection of food in the cold chain, which is beneficial for not only reducing the losses of producers but also strengthening consumer confidence in food safety[3]. Temperature fluctuations are however almost inevitable during processing, transport services, and retailing, which is not conducive to the total quality and freshness of bighead carp heads. Therefore, the fish industry must assess how different temperatures throughout the food chain influence the freshness of fish.
Nondestructive spectroscopy including infrared spectroscopy, hyperspectral imaging spectroscopy, Raman spectroscopy, and fluorescence spectroscopy has been successfully used to determine the freshness of fish with the advantages of high specificity, convenience, rapidity, non-destruction, and non-invasion. Compared with near-infrared spectroscopy, Raman spectroscopy, and hyperspectral imaging, the intensity of the fluorophores in fluorescence spectroscopy represents the amount of fluorescent substances, so it can accurately quantify the given fluorescent substances. Excitation-emission matrix (EEM) spectroscopy, a novel fluorescence spectroscopy technique has been gradually used in the field of food because of its ability to detect trace substances and enable the dialectical differentiation of various fluorescent substances[4]. The features of EEM spectra, including the average position of the fluorescence maximum and the span of emission and excitation wavelengths of fluorescent substances have been successfully applied to evaluate the freshness of aquatic products[5]. Studies have demonstrated the potential of EEM to characterize fluorophores in aquatic products[6], including the determination of niacinamide adenine dinucleotide (NAD and NADH)[7], amino acid, and uric acid content[8], which can be used to track the changes in fish freshness after death. These results indicated that EEM has attracted attention in the field of aquatic products and has an increasing number of applications for indication, characterization, and prediction.
An artificial neural network, such as the backpropagation neural network (BP-NN), radial basis function neural network (RBF-NN), and LSTM network are nonlinear mathematical models consisting of a considerable amount of interconnected neurons that can match the intricate connections between input layer and output layer data through its learning ability[9]. BP-NN is the most commonly used artificial neural network, but due to its fixed learning rate, it often has unfavorable self-learning and multi-output capabilities[10]. The RBF-NN is an architecture based on a feed-forward network with one hidden layer that is much better in terms of learning speed and stability than BP-NN but more prone to underfitting phenomenon[11]. The LSTM network has a unique recurrent network structure associated using a suitable gradient-based optimization algorithm and can be used to solve complex algorithms and artificial tasks with extended time delays that previous cyclic network algorithms have not addressed. Therefore, the LSTM network results in more successful running and faster learning than real-time cyclic learning, time backpropagation, Elman networks, and neural sequence chunking[12], and has been used to forecast short-term metro ridership[13], coal stock[14], the remaining useful life of lithium-ion batteries[15], and the stock market[16]. However, the application of the LSTM network in aquatic product freshness prediction has rarely been reported. Furthermore, the prediction of food freshness presents significant challenges due to the influence of intrinsic and environmental factors, whereas the LSTM network has certain advantages in exploring the correlations among these variables.
Therefore, the current study aims to not only probe the correlation between fluorescence components and fish quality during storage of bighead carp heads but also establish the LSTM network combined with fluorescent substances obtained from EEM data through parallel factor algorithm to simultaneously and precisely predict TVB-N, TBARS, K, and TVC values in simulated cold chains, which is beneficial for further developing portable fluorescent devices.
-
Live bighead carp were obtained from the Beijing Wholesale Market of Aquatic Products (Beijing, China) and transported directly to the laboratory in oxygenated water. They were humanely slaughtered after being rendered unconscious by a blow to the head with wooden sticks. The heads were separated from the fresh bighead carp by cutting vertically with the dorsal fin as the cutting point, and the scales, gills, and internal organs were removed. After being washed under running water and drained, bighead carp heads were placed into polyethylene valve bags (35 cm × 45 cm). The entire bighead carp treatment process followed the Regulations released by the State Council of China in 1988 and the Guidelines for the Treatment of Experimental Animals published by the Ministry of Science and Technology of China in 2006.
This project was divided into two parts: the isothermal experiment and the nonisothermal experiment for the measurement of K values, TVB-N, TVC, and TBARS along with the scanning of the excitation-emission matrix fluorescence spectrum of fish fillets, respectively. In the isothermal experiment, the heads of bighead carp were placed in low-temperature incubators set at 16 ± 0.5 °C, 12 ± 0.5 °C, 8 ± 0.5 °C, 4 ± 0.5 °C, and 0 ± 0.5 °C respectively. Regarding the analysis, the sampling procedure was as follows: eight samples were randomly chosen every 3 days for those stored at 0 ± 0.5 °C, every 2 days for those at 4 ± 0.5 °C, and every 1 day for those stored at 16 ± 0.5 °C, 12 ± 0.5 °C, and 8 ± 0.5 °C respectively. For the nonisothermal experiment, two simulated cold chains were considered namely the supermarket direct sales (SDS) cold chain and the long-distance transport (LDT) cold chain. The bighead carp heads were stored in refrigerators for the SDS cold chain using the temperature schedule outlined below: the first stage for simulating the storage process: 0 ± 0.5 °C for 3 d, the second phase for simulating the transport process: 4 ± 0.5 °C for 1 d, the third phase for simulating the transport process: 12 ± 0.5 °C for 1 d, and the fourth phase for simulating the sale process: 4 ± 0.5 °C for 1 d. The LDT cold chain was mainly simulated with alternating storage and transport processes using the temperature schedule outlined below: the first stage for simulating the storage process 0 ± 0.5 °C for 3 d, the second phase for simulating the transport process: 12 ± 0.5 °C for 1 d, the third phase for simulating the storage process: 4 ± 0.5 °C for 1 d, the fourth phase for simulating the transport process: 16 ± 0.5 °C for 1 d, and the fifth phase for simulating the sale process: 4 ± 0.5 °C for 1 d. Eight samples were picked at random for evaluation at the specified time intervals.
Chemical analysis
Total volatile base nitrogen (TVB-N)
-
The TVB-N was determined through semi-micro steam distillation using some adjustments[2]. Three grams of minced fish was appended to 30 mL distilled water, stirred, and shaken in a constant-temperature oscillator for 30 min. After centrifugation, 5 mL supernatant and 5 mL MgO suspension (10 g·L−1) were distilled in a Kjeldahl apparatus (KDY-9820, Beijing, China). The distillate was gathered in a conical bottle with boric acid and mixed indicator (g·L−1: methyl red solution 2; methylene blue solution 1) and titrated with 0.01 M hydrochloric acid.
Thiobarbituric acid (TBARS)
-
The TBARS value was measured as described by Boutheina et al.[17] with certain adjustments. The minced samples (2 g) were added to 16 mL, trichloroacetic acid solution (5% weight/volume) along with 100 μL of butylated hydroxytoluene (2 g·L−1), and homogenized for 1 min. After centrifugation, 5 mL supernatant was blended with 1 mL thiobarbituric acid solution (0.01 M) and incubated in a boiling water bath for 40 min. The mixture was brought down to room temperature, and its absorbance was measured at 532 nm with an ultraviolet spectrophotometer (UV2600A, Shanghai, China). The TBARS value was computed by multiplying the optical density measurements by multiplying by 10.2 obtained from a standard curve established with 1, 1, 3, and 3-tetraethoxy-propane.
K value
-
The K value is characterized as the proportion of non-phosphorylated ATP metabolites to the overall products resulting from ATP breakdown[6]. The K value was measured according to the manufacturers instructions for Freshness Assessment Device (QS-3201, Sendai, Japan). A total of 0.2 g of minced fish was extracted with reagent A and then centrifuged. To adjust the pH to neutral, 200 μL of supernatant was added to reagents B and C followed by centrifugation. Three microliters of supernatant droplets were absorbed on the soaked filter paper and examined through electrophoresis at 800 v for 5 min. After drying in a drying oven and imaging under an ultraviolet lamp, The Spot Analyzer application (QS-Solution, Tokyo, Japan) was utilized for automatic image analysis and the K value was calculated.
Total viable counts (TVC)
-
The TVC value was measured following the Chinese National Standard Method GB 4789.2-2022 with some alterations. Fish tissues (5 g) were blended with 45 mL sterile sodium chloride solution (0.9%). After a tenfold serial dilution of the homogenized solution was carried out, 1 mL diluted liquid was added to a 3M™ Petrifilm™ Aerobic Count Plate (3M Company, USA) and incubated in a biochemical incubator maintained at 30 °C for 72 ± 2 h. Between 30 and 300 colonies were calculated on the tablets, expressed as log CFU/g.
Excitation-emission matrix fluorescence spectroscopy
-
Fluorescence fingerprints of each fish fillet, with a fillet size of approximately 4 cm × 3 cm × 1 cm (length × width × thickness), were obtained using a fluorescence spectrometer (FS5, Edinburgh, UK). Each fish fillet was placed on a bracket in the SC-10 solid sample bin for scanning. The relevant instrument parameters were adjusted as described by Shi et al.[2] with some modifications. The EEM spectra were gathered the range of excitation wavelengths between 250 and 580 nm (a span of 5 nm) and the range of emission wavelengths between 260 and 600 nm (a span of 5 nm), and with a rate of scanning of 100 nm·s−1, an excitation and emission bandwidth of 3 nm, a dwell time of 3 ms, and a xenon Lamp source without ozone. To avoid interference from the external environment, the black case housing the instrument was not opened during sample scanning. Each EEM consisted of 67 excitation (columns) and 69 emission (rows) wavelength data, with dimensions of 67 × 69. The excitation-emission matrices were displayed as contour maps, of which the vertical axis represented the excitation wavelength, the horizontal axis represented the emission wavelength, and the contour line represented the fluorescent signal strength.
Parallel factor analysis
-
After scattering the original EEM data, the characteristic fluorescent components of the fish could be extracted by PARAFAC analysis. The PARAFAC model was decomposed into three matrices (A, B, and C), which was an improvement upon the Tucker3 model[18], as shown in Eqn (1). xijk is the fluorescence signal of the k-th sample corresponding to the i-th excitation wavelength along with the j-th emission wavelength. Ain, Bjn, ckn are the elements related to the matrices A, B, and C, respectively. eijjk is an element of the residual matrix. The minimum factor N of the trilinear decomposition refers to the most suitable number of components in the sample.
$ {x}_{ijk}=\textstyle\sum\nolimits _{n=1}^{N}{a}_{in}{b}_{jn}{c}_{kn}+{e}_{ijjk} \;\;i=1,2,...,I; j=1,2,..,J; k=1,2,..,K $ (1) When PARAPAC was used to solve the excitation-emission matrix data, the minimum factor N of a trilinear decomposition was required. Three methods, including residual analysis, core reliability diagnostic, and half-split assessment, were used to determine N. Residual analysis is an effective method for comparing different component models and uses the sum of squared error, obtained by the alternating least squares regression method, to evaluate the most authentic three-dimensional fluorescence spectra[19,20]. The core consistency diagnostic (CORCONDIA) originated from the single-component model to assess the degree of superdiagonality[21]. Half-split assessment is employed to confirm the reliability of the PARAFAC model by creating and comparing various models after dividing data sets in two different ways[22].
LSTM network algorithm
-
In this study, the LSTM network algorithm was employed to create predictive models that connect (i) the fluorescent component derived from bighead carp head fillets under different storage conditions, and (ii) the measurements of TVB-N, TBARS, K value, and TVC. The construction of the freshness prediction model and the determination of related parameters were as follows.
The LSTM network could update the current state according to the past state combined with the input data and identify the relationship between the front and back dimensions with too many input sequences[23]. The unit consisted of a cell, an input gate, an output gate, and a forget mechanism. The forget gate played an important role in the LSTM network model by allowing the deletion and forgetting of unnecessary information to avoid the influence of outdated information on the input of current data and improve the computing power of the model.[24]
The LTSM network presents a novel internal state (
$ {c}_{t}\in {R}^{D} $ $ {h}_{t}\in {R}^{D} $ $ {c}_{t}={f}_{t}\odot{c}_{t-1}+{i}_{t}\odot\tilde{{c}_{t}} $ (2) $ {h}_{t}={o}_{t}\odot\mathrm{t}\mathrm{a}\mathrm{n}\mathrm{h}\left({c}_{t}\right) $ (3) The three gates,
$ {f}_{t}\in {\left[\mathrm{0,1}\right]}^{D} $ $ {i}_{t}\in {\left[\mathrm{0,1}\right]}^{D} $ $ {o}_{t}\in {\left[\mathrm{0,1}\right]}^{D} $ $\odot $ $ \tilde{{c}_{t}}\in {R}^{D} $ $ \tilde{{c}_{t}}=\mathrm{t}\mathrm{a}\mathrm{n}\mathrm{h}({W}_{c}{x}_{t}+{U}_{c}{h}_{t-1}+{b}_{c}) $ (4) where, ct-1 represents the current memory unit, W*, U*, b* represents the learning network parameters (
$ \mathrm{*}\in \left\{i,f,o,\right.\left.c\right\} $ At each instance t, ct logs the past information until the present time. The forget gate ft determines ct−1 at the previous time and thus how much data should be forgotten. The input gate it determines ct, and thus how much data should be saved. The output gate ot controls the amount of information ct should transmit to the external state ht at the current time[25]. The computation formulas for the three gates are listed below:
$ {i}_{t}=\mathrm{\sigma }({W}_{i}{x}_{t}+{U}_{i}{h}_{t-1}+{b}_{i}) $ (5) $ {f}_{t}=\mathrm{\sigma }({W}_{f}{x}_{t}+{U}_{i}{h}_{t-1}+{b}_{f}) $ (6) $ {i}_{o}=\mathrm{\sigma }({W}_{o}{x}_{t}+{U}_{o}{h}_{t-1}+{b}_{o}) $ (7) where, σ is a logistic function, and its output interval is (0,1).
The LSTM cycle unit can be succinctly described as follows:
$ \left[\begin{array}{c}\tilde{c_t} \\ o_t \\ i_t \\ f_t\end{array}\right]=\left[\begin{array}{c}\mathrm{tanh} \\ \sigma \\ \sigma \\ \sigma\end{array}\right]\left(W\left[\begin{array}{c}x_t \\ h_{t-1}\end{array}\right]+b\right) $ (8) $ {c}_{t}={f}_{t}\odot{c}_{t-1}+{i}_{t}\odot\tilde{{c}_{t}} $ (9) $ {h}_{t}={o}_{t}\odot\mathrm{t}\mathrm{a}\mathrm{n}\mathrm{h}\left({c}_{t}\right) $ (10) The root squared error (RMSE), average absolute deviation (MAE), average absolute percentage deviation (MAPE), relative error (RE), and mean relative error (MRE) are usually used to evaluate the modeling performance. The calculation formulas are as follows:
$ \mathrm{R}\mathrm{M}\mathrm{S}\mathrm{E}=\sqrt{\dfrac{1}{n}\textstyle\sum\nolimits _{i=1}^{n}{({C}_{mea}-{C}_{pre})}^{2}} $ (11) $ \mathrm{M}\mathrm{A}\mathrm{E}=\dfrac{\textstyle\sum\nolimits _{i=1}^{n}\left|{C}_{mea}-{C}_{pre}\right|}{n} $ (12) $ \mathrm{M}\mathrm{A}\mathrm{P}\mathrm{E}=\dfrac{1}{n}\textstyle\sum\nolimits _{i=1}^{n}\left|\dfrac{{C}_{pre}-{C}_{mea}}{{C}_{pre}}\right| $ (13) $ \mathrm{R}\mathrm{E}\;\left(\text{%}\right)=\left|\dfrac{{C}_{pre}-{C}_{mea}}{{C}_{pre}}\right|\times 100\text{%} $ (14) $ \mathrm{M}\mathrm{R}\mathrm{E}\;\left(\text{%}\right)=\dfrac{1}{n}\textstyle\sum\nolimits _{i=1}^{n}\left|\dfrac{{y}_{pre}-{y}_{mea}}{{y}_{mea}}\right|\times 100\text{%} $ (15) Data analysis
-
The excitation-emission matrix data were acquired by using the fluorescence spectrometer (FS5, Edinburgh, UK). Excel 2010 by Microsoft Corporation (Redmond, WA, USA) was employed for calculating and analyzing freshness indicators data statistics. The PARAFAC and LSTM algorithms were utilized for data handling by MATLAB 2020b (MathWorks, Natick, Massachusetts, USA), and mapping was performed by OriginLab 2018 (OriginLab, Northampton, MA, USA).
-
The TVB-N figure indicates the degradation of proteins and other N-containing substances due to microorganisms and other factors[26]. The TVB-N figure of fish samples preserved at 0, 4, 8, 12, and 16 °C rose with extended storage duration, and the increasing rate of this value of samples stored at 16 °C surpassed the levels observed at other temperatures (Fig. 1a). The TVB-N value of bighead carp heads kept at 0 °C on the 18th day, 4 °C on the 12th day, 8 °C on the 6th day, 12 °C on the 5th day, and 16 °C on the 3rd day, exceeded 20 mg/100 g, which was considered to indicate fish spoilage[2] . In the SDS and LTD cold chains, the TVB-N value rose with the prolongation of storage days. The TVB-N value improved from 10.73 to 11.67 mg/100 g in the third stage of the SDS cold chain and then increased to 12.83 mg/100 g at the end of the SDS cold chain, which did not indicate fish spoilage. The TVB-N value improved from 14.35 to 16.10 mg/100 g, higher than that stored at 4 °C on the 6th day, in the fourth stage (16 °C) of the LDT cold chain. The TVB-N value was up to 20.18 mg/100 g in the 5th phase of the LDT cold chain, which was considered to indicate fish spoilage. The accumulating rate of the TVB-N value may be affected by the range and number of temperature fluctuations[27].
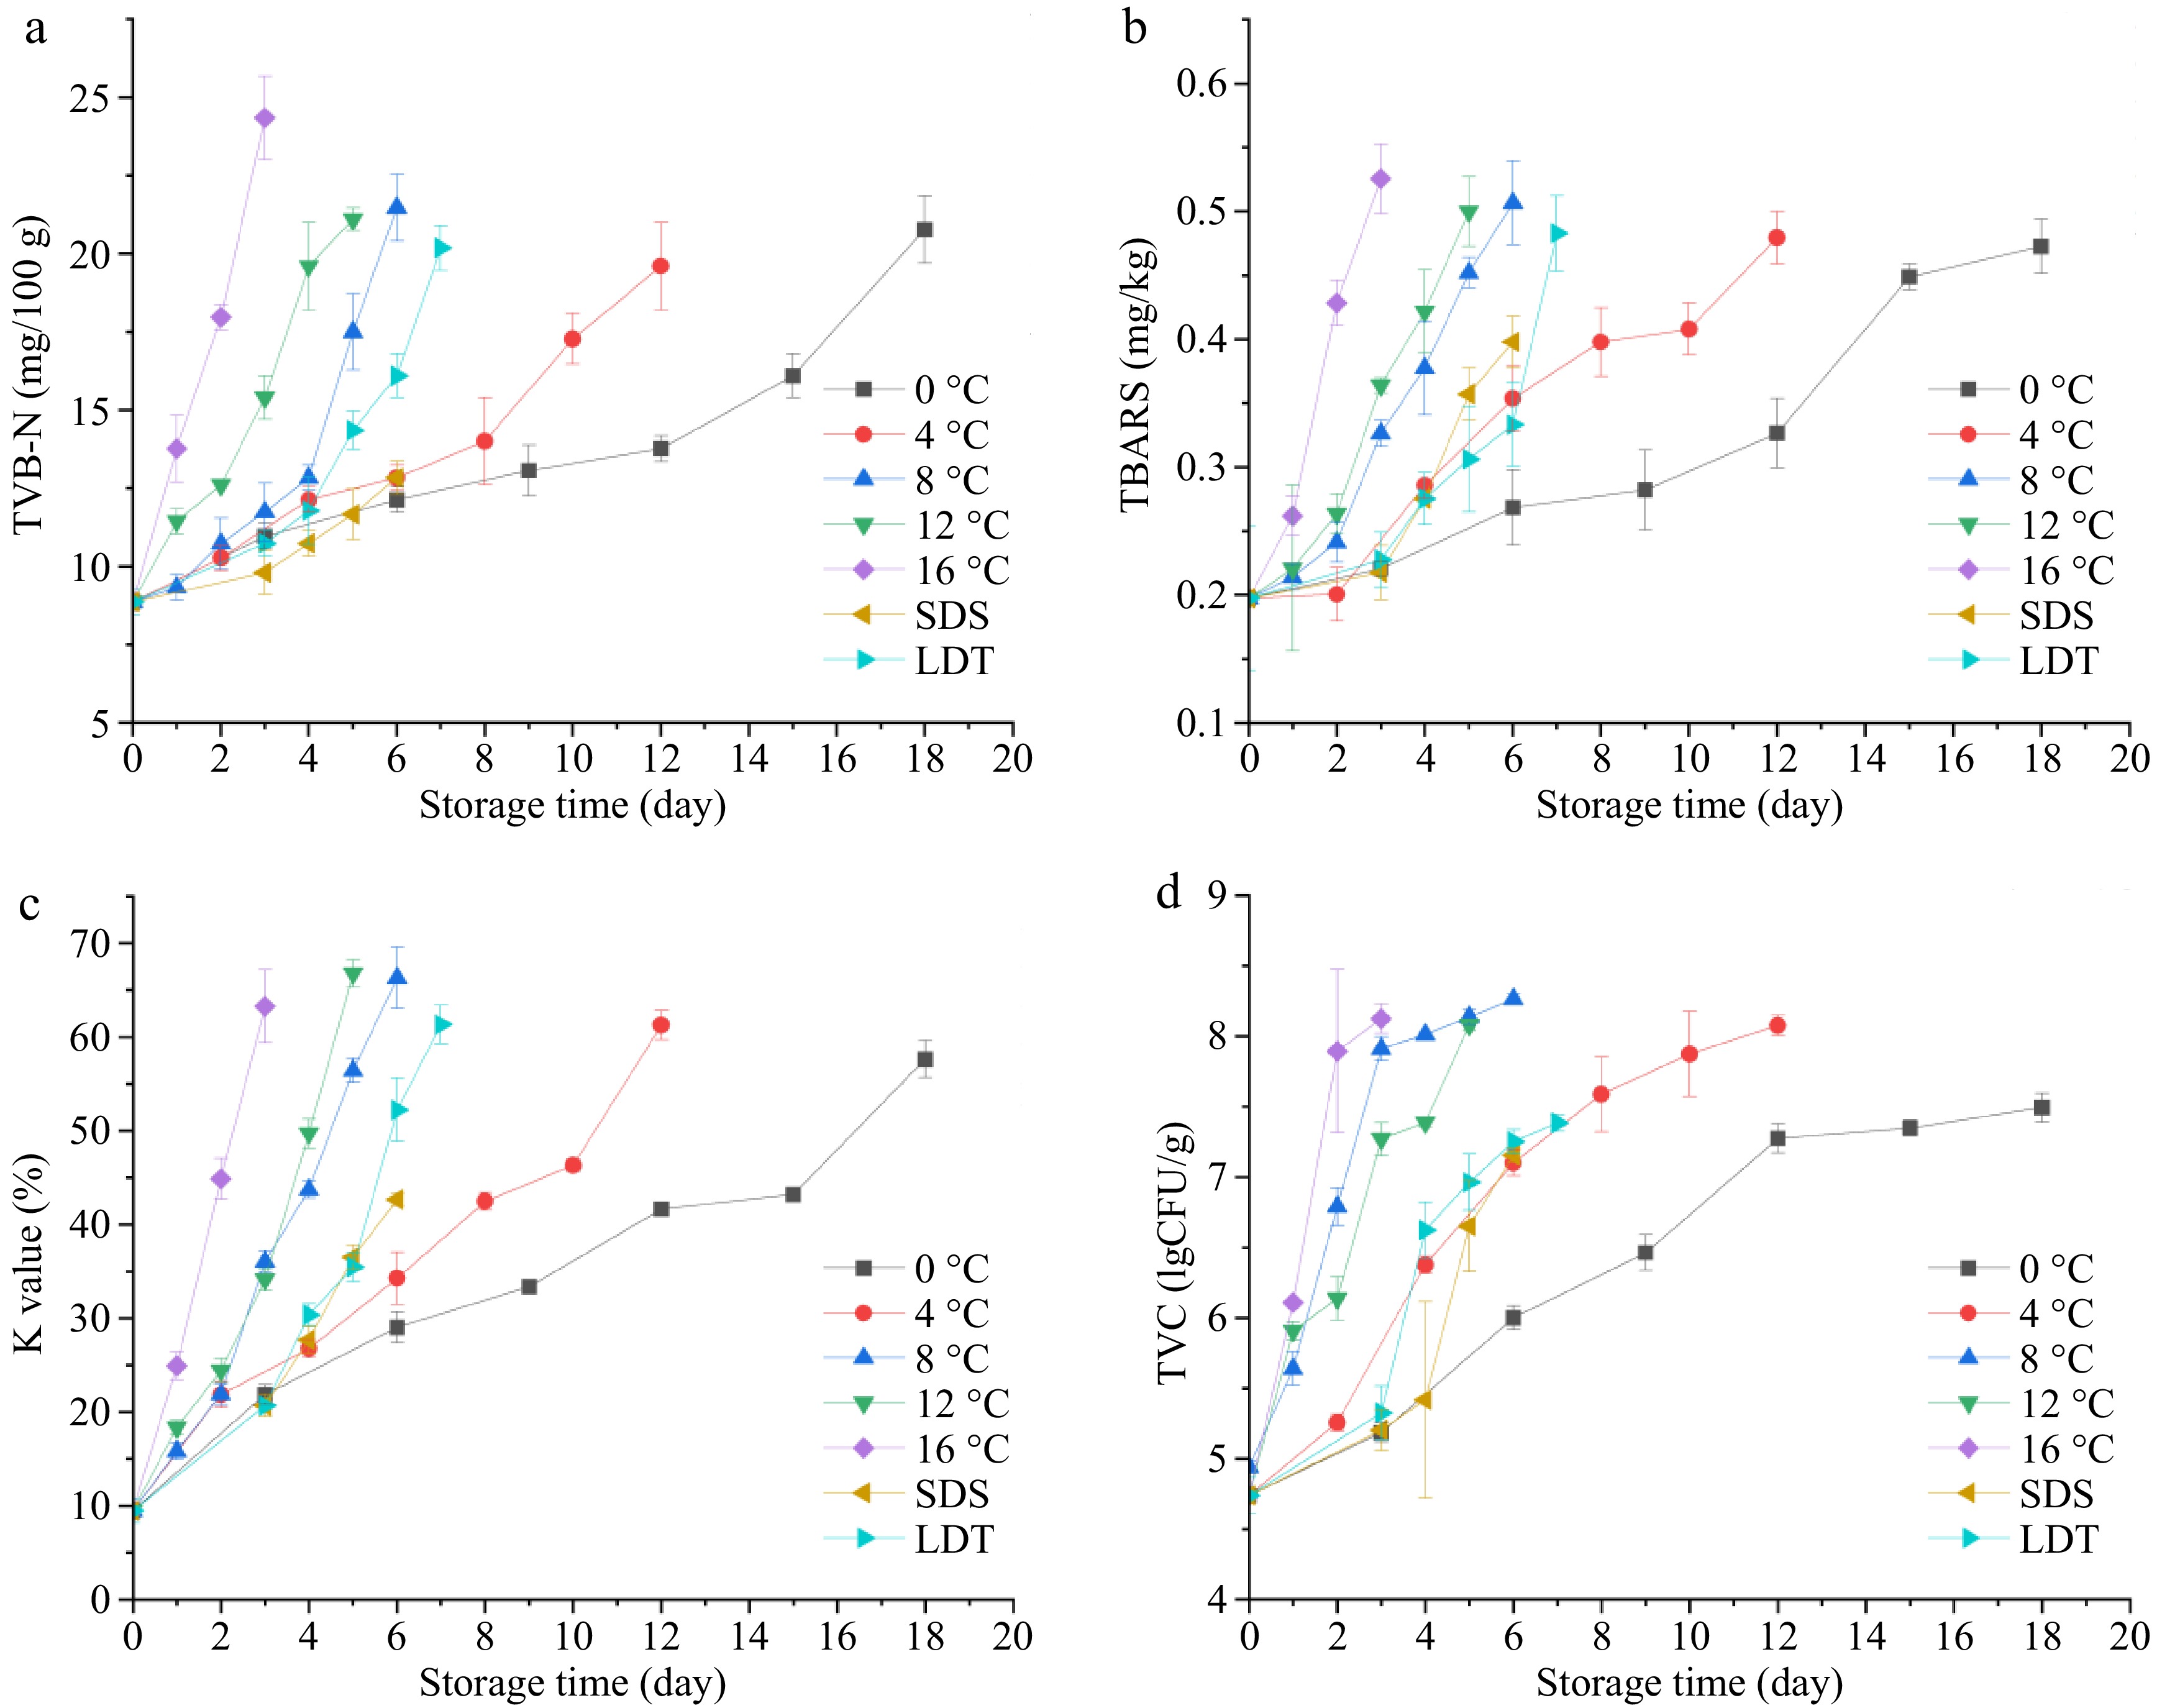
Figure 1.
Changes of (a) TVB-N, (b) TBARS, (c) K value, and (d) TVC of bighead carp under isothermal conditions (0, 4, 8, 12, and 16 °C) and the simulated cold chains (SDS and LDT cold chains). Note: SDS represents the supermarket direct sales cold chain; LDT represents the long distance transport cold chain.
The TBARS value is frequently utilized as an indicator of fat oxidation levels. The initial TBARS measurement was 0.19 mg·kg−1 and the TBARS values for all samples remained below 0.60 mg·kg−1 (Fig. 1b). The TBARS values of samples stored at 0, 4, 8, 12, and 16 °C rose with extended storage time. The increasing rate of the TBARS value of samples preserved at higher temperatures was substantially less than that of samples stored at lower temperatures. The TBARS value improved from 0.28 to 0.36 mg·kg−1 in the third stage of the SDS cold chain, and the increasing rate of TBARS value in this stage was significantly greater than that in the other stages. The improving rate of the TBARS value significantly improved in the second and fifth stages of the LDT cold chain. The pace of lipid oxidation accelerated as the range of temperature fluctuations increased, which was similar to the research of Gayer et al.[28].
The K value is used to determine the freshness index of fish regarding the decomposition products of adenosine triphosphate. The freshness of fish could be divided into three levels: a K value of < 20% represents extreme freshness, a K value of 20%−60% represents sub-class freshness, and a K value of > 60% represents initial decomposition. The initial K value was 9.46%, which was akin to the initial K value documented by Shi et al.[2]. The K value stored at 16, 12, 8, 4, and 0 °C increased and the rate of increase for the K value samples stored at 16 °C was the highest (Fig. 1c). The K value reached 42.7% in the fourth stage of the SDS cold chain. The K value rapidly increased from 35.5% to 52.3% in the fourth stage of the LDT cold chain, and the increasing rate of K value was similar to that of the samples stored at 16 °C. Then the K value reached 61.3%, which was considered to indicate fish spoilage in the fifth stage of the LDT cold chain. The decomposition ability of enzymes was accelerated with increasing temperature fluctuation, leading to the increase of K values.
Fish is a nutrient-rich substrate, providing a good living environment for the growth and reproduction of microorganisms. The TVC value of bighead carp heads during storage exceeded 7.00 log10 CFU/g, which was considered an unacceptable level for fish[13]. The TVC value kept at 0, 4, 8, 12, and 16 °C increased during storage(Fig. 1d). The increasing rate of the TVC value decreased during the post-storage period, mainly due to the limited nutrients and living space for microorganisms. The TVC value significantly increased from 5.42 log10 CFU/g to 6.65 log10 CFU/g in the third stage of the SDS cold chain. The TVC value rapidly increased from 5.32 log10 CFU/g to 6.62 log10 CFU/g in the second stage of the LDT cold chain, at which point the increasing rate was higher than that in the second stage of the SDS cold chain. The increasing rate of the TVC value was accelerated with increasing fluctuating temperature, which agreed with the results of Wang et al.[29].
EEM analysis of bighead carp heads
-
After the preprocessing of the original excitation-emission matrix data to remove Raman scattering and Rayleigh scattering, the optimum number of components in fish fillets was determined. The fluorescence components were then extracted through the PARAFAC method using the tool.
In this study, PARAFAC analysis in conjunction with residual analysis, core consistency diagnostic, and half-split analysis methods were used to comprehensively estimate the optimal quantity of components. By contrasting the 2−4 component models (Fig. 2a), the sum of squared error changed obviously from the 2- to 3-component model, whereas the sum of squared error showed little change from the 3- to 4-component model, indicating that 3 components were sufficient for these data[30]. When the component was 3, the core consistency value was 99.11%, When the component was 4, the core consistency value dropped to −8.18% (Fig. 2b). A core consensus of more than 90% can be interpreted as 'very trilinear', while a core consensus value of less than 50% indicates a problem with the model. When the optimum number of components is exceeded, the core consistency value decreases sharply[19], indicating that three components were sufficient for these data. Half-split analysis was used to further verify the reliability of the 3-component model, the results of which nearly perfectly corresponded between the excitation and emission loadings of the three parts in two split-half data sets of fish fillets (Fig. 2c). Therefore, the 3-component model had the best-fitting effect.
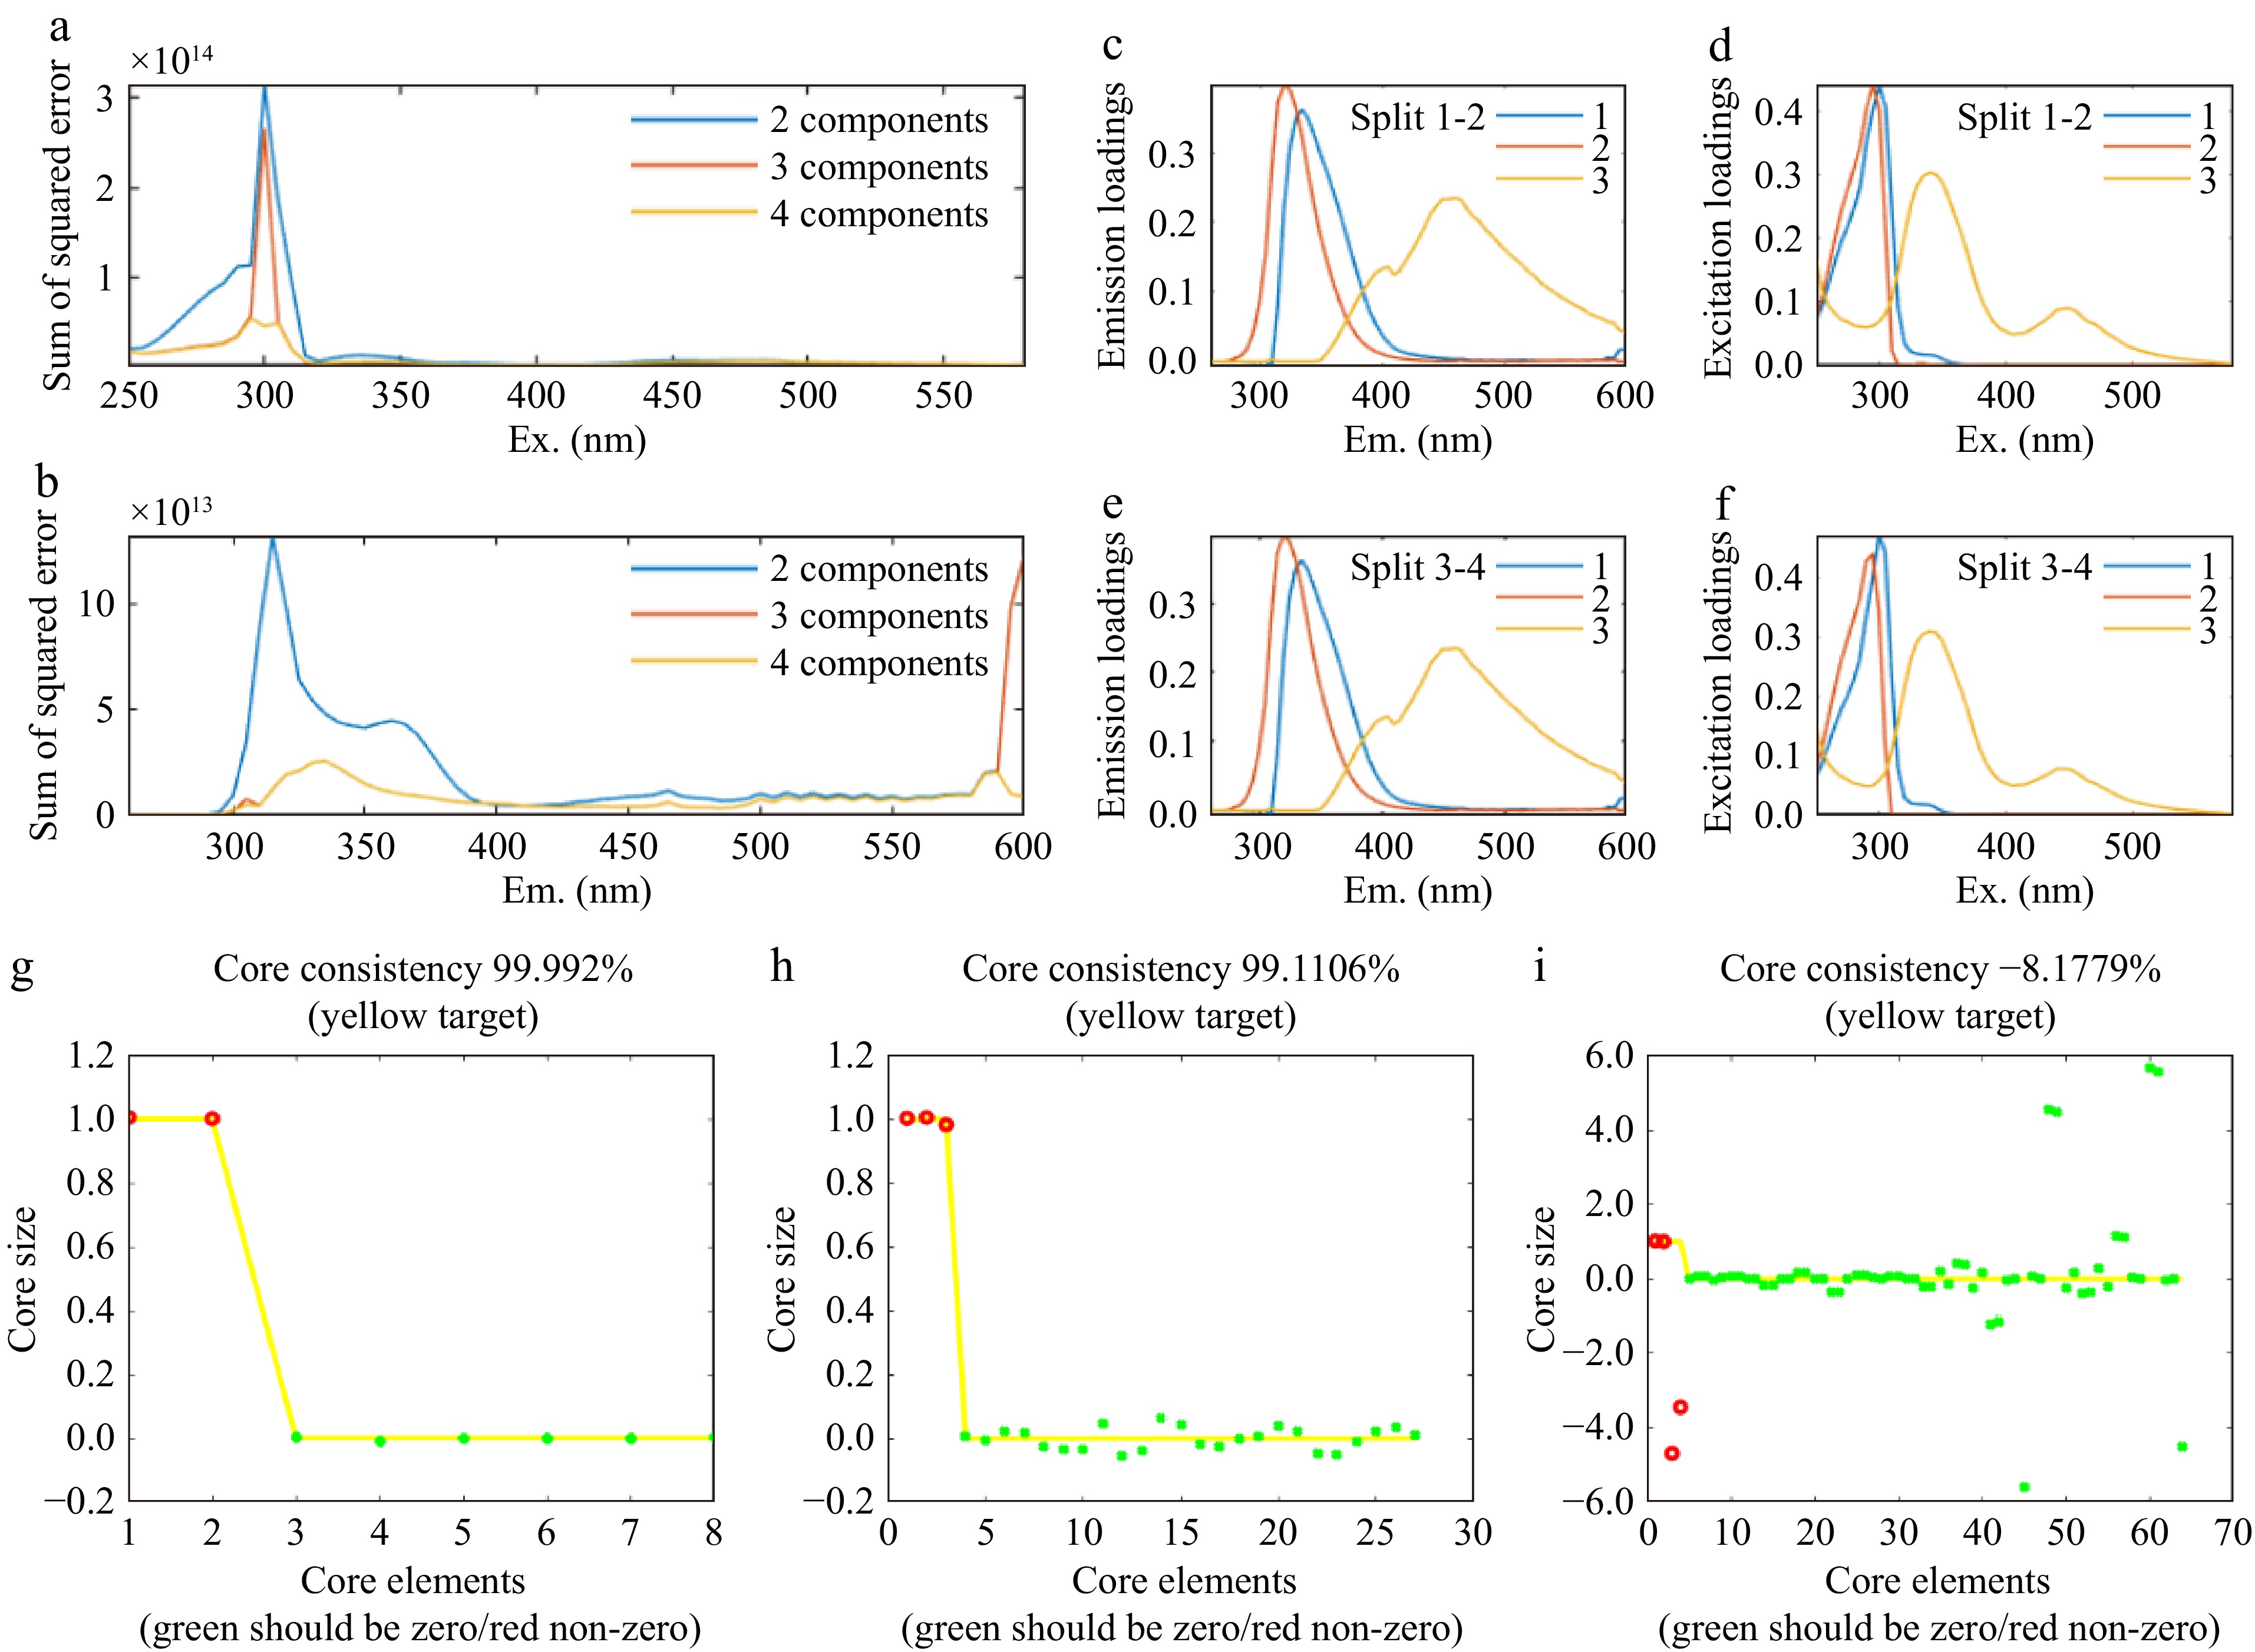
Figure 2.
PARAFAC analysis of fish fillets. The sum of squared error of (a) emission, (b) excitation, and wavelengths corresponding to the 2−4 component model in fish fillets. (c)−(f) Split half analysis for model validation of 3-component in fish fillets. (g) Core consistency diagnostic results of 2 components, (h) 3 components, and (i) 4 components in fish fillets. Note: (c)−(f) comparison of the excitation and emission loading changes of two split-half sets of fish fillets excitation emission matrices respectively. (g)−(i) the red dot represents the number of components, while the position of the green dot represents the degree of deviation from the yellow line parallel to the X-axis.
According to the results of PARAFAC analysis, three fluorescent components of fish fillets were extracted, corresponding to Peak A (λEx/λEm: 300 nm/335 nm), Peak B (λEx/λEm: 290 nm/320 nm), and Peak C (λEx/λEm: 340 nm/460 nm), as shown in Fig. 3. Karoui et al.[31] found that the maximum fluorescent signal intensity (λEx/λEm: 290 nm/326 nm) of fresh cod fillets and the maximum fluorescent signal intensity (λEx/λEm: 290 nm/330 nm) of frozen-thawed cod fillets could be attributed to tryptophan. Peak A and Peak B could also be attributed to tryptophan according to the maximum fluorescence intensity and the excitation and emission wavelength range. The fluorescence peak movement between Peak A and Peak B was assigned to a displacement of the tryptophan of the samples to a more hydrophilic environment and the difference in fluorescence properties of the samples may also be related to the denaturation of proteins during the preservation of bighead carp heads[31]. Peak C could be attributed to NADH, which was consistent with the results reported by Wu et al.[32].
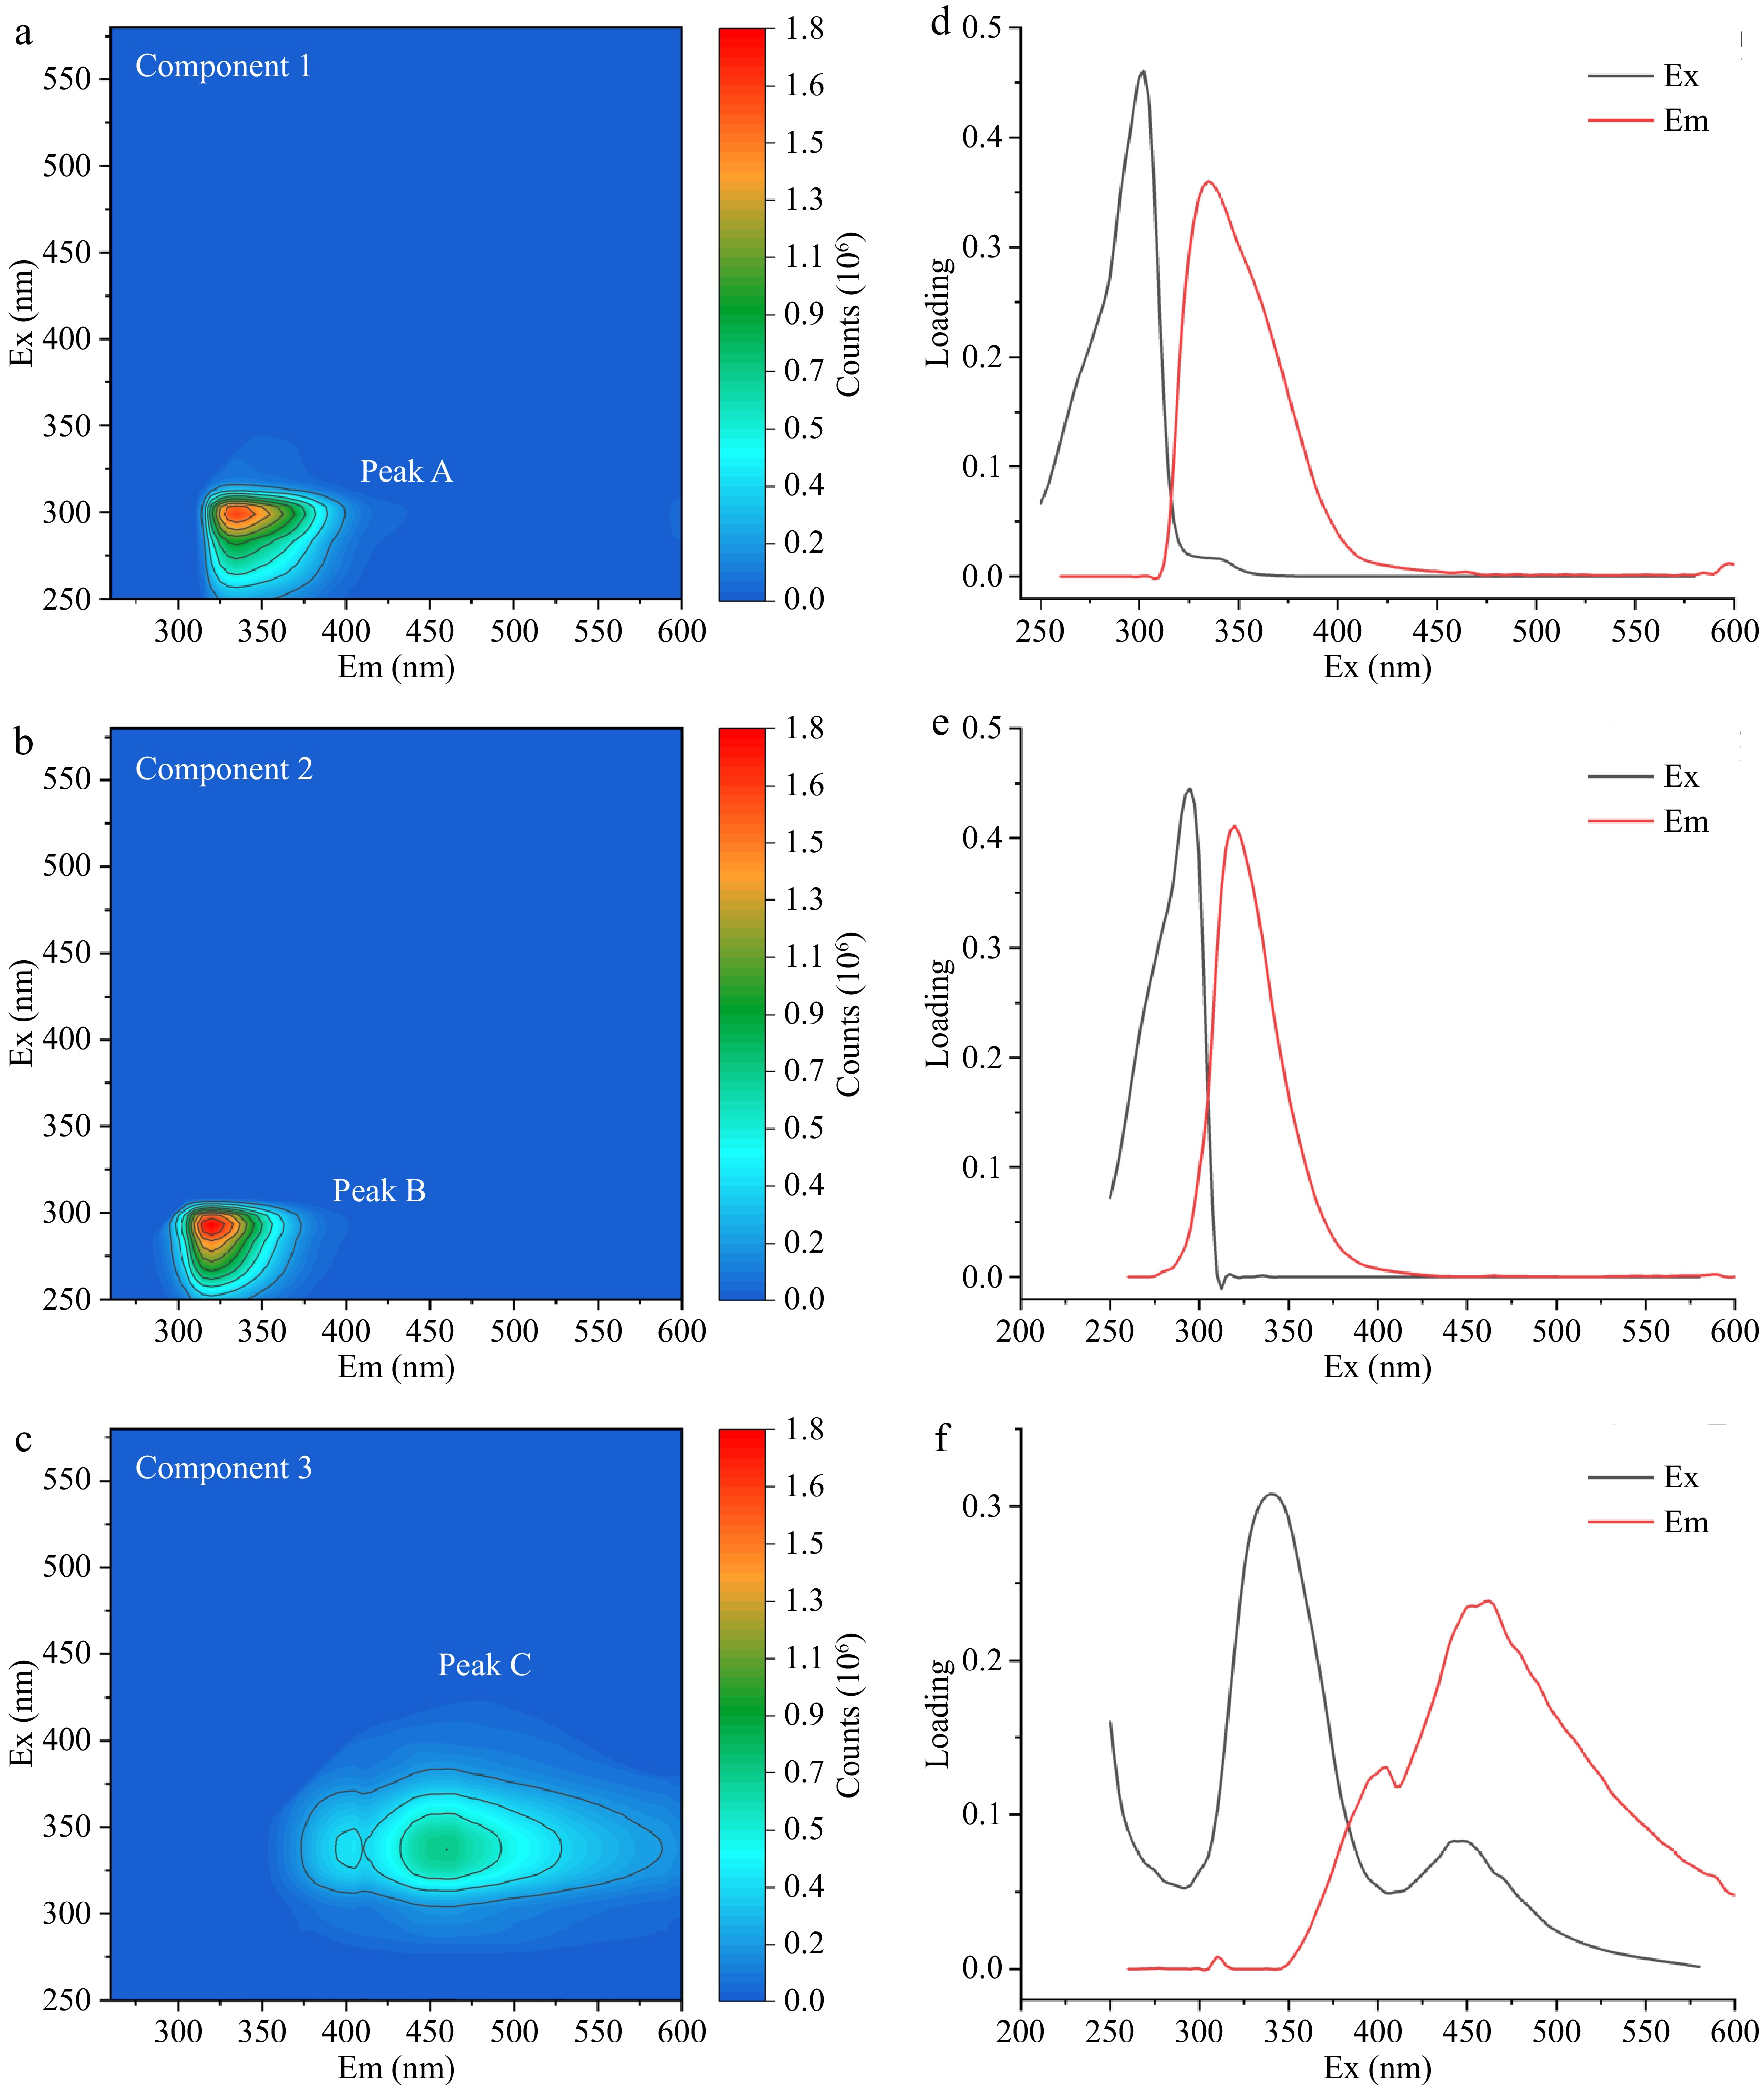
Figure 3.
Three fluorescence components peaks (a) A, (c) B, and (e) C in fish fillets and their corresponding excitation-emission wavelength loading diagram peaks (b) A, (d) B, and (f) C.
Changes in the fluorescent components of bighead carp heads
-
Based on the span of wavelengths of the fluorescence peaks and the position of the maximum fluorescence intensity, Peak A and Peak B could be attributed to tryptophan. Therefore, Peak AB was used to represent Peak A and Peak B. In Fig. 4, two fluorescence peaks (Peak AB and Peak C) were presented in the contour maps of fish fillets stored at different times and temperatures. The fluorescence intensity of Peak AB was significantly higher than that of Peak C of bighead carp heads throughout the preservation period (except for keeping at 16 °C on the first day). The fluorescence intensity of Peak AB gradually rose with prolonged storage time under isothermal conditions and the simulated cold chains, which followed the conclusions drawn by Shi et al.[2]. The fluorescence intensity of tryptophan was enhanced with the increasing pH of bighead carp heads in the final phase of storage due to the increase in electron density and the deprotonation of the amino group in the benzene ring[33,34]. Fluorescent signal intensity of Peak C gradually improved with increasing storage time, which is consistent with the results of Hassoun & Karoui[35]. The high NADH content resulted in the reduction of NAD to NADH during storage of bighead carp heads due to the reduction in the enzyme activity of NADH after fish death[30]. The fluorescence intensity of Peak C decreased at 16 °C on the 3rd day (Fig. 4p), which could be attributed to the phenomenon of fluorescence quenching induced by elevated temperature[36].
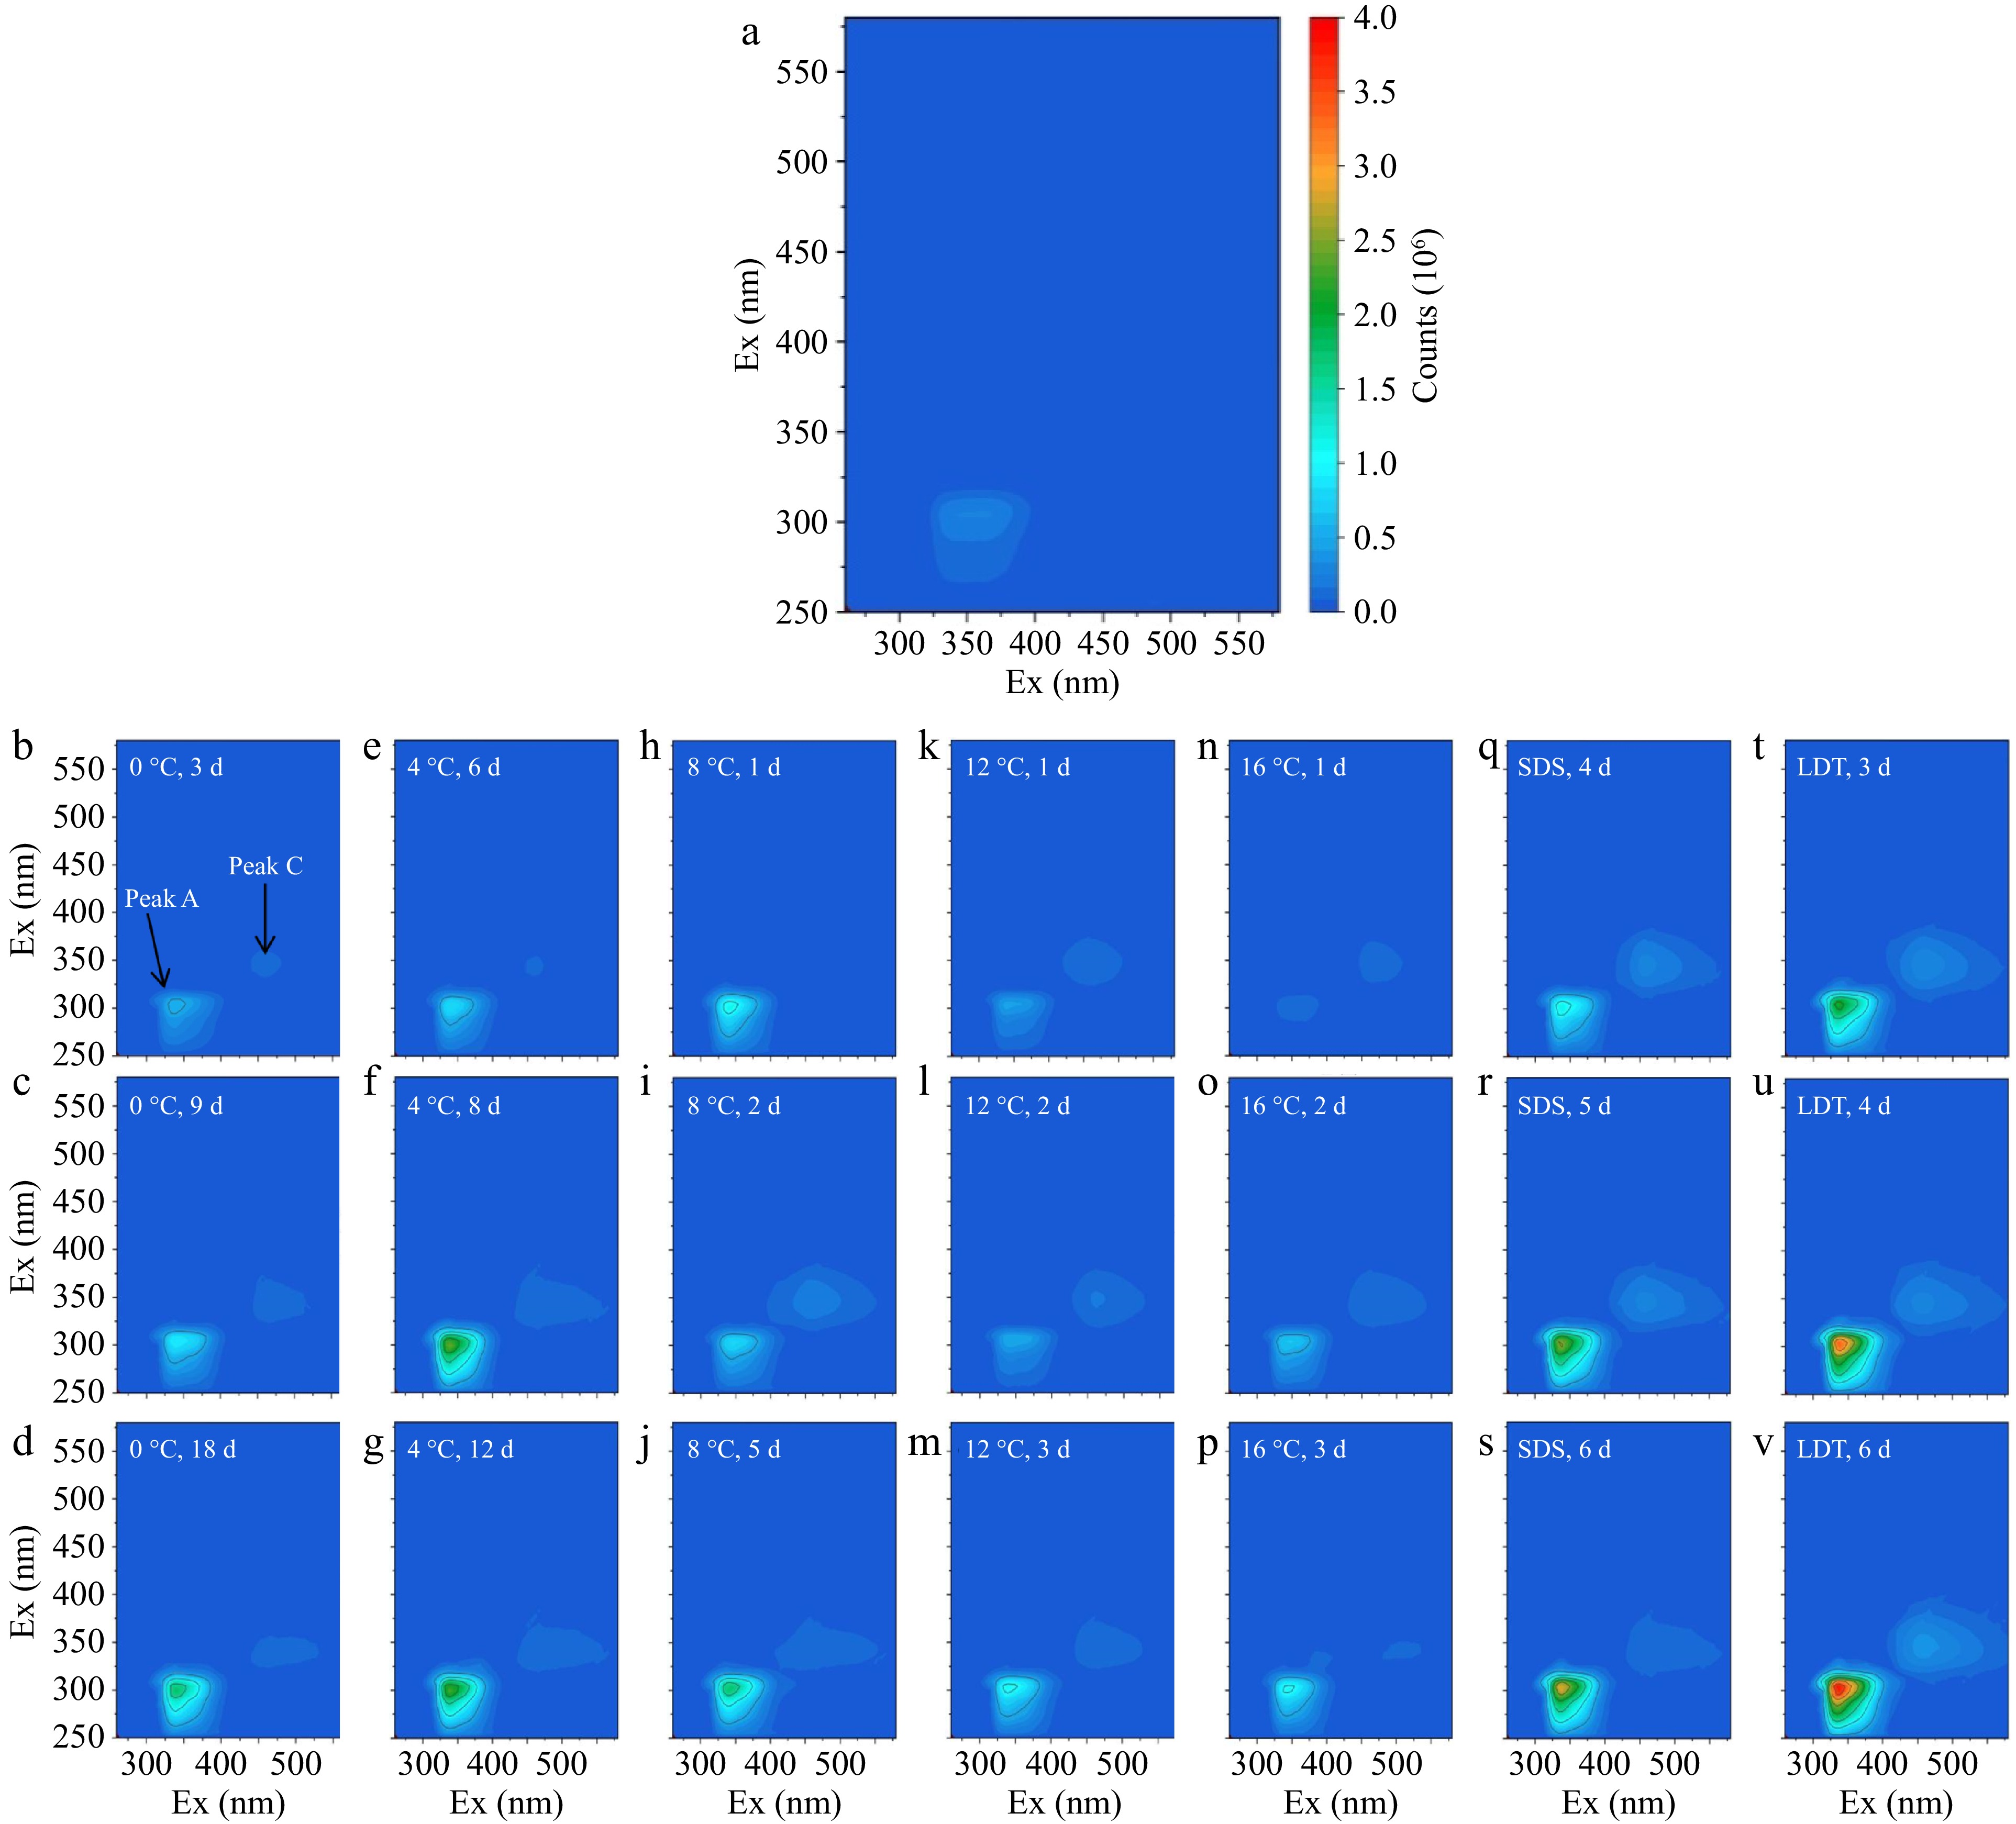
Figure 4.
Changes of fluorescent components in fish fillets under (a)−(p) different storage conditions (0, 4, 8, 12, and 16 °C), storage conditions in the (q)−(s) SDS, and (t)−(v) LDT cold chain.
The increase in temperature accelerated the deterioration of the quality of bighead carp heads and affected the change in the fluorescence intensity of the fluorescence peaks under various storage conditions, which was analogous to the changing trend pertaining to the freshness indicators of the bighead carp heads under various storage conditions. Therefore, fluorescence peaks have great potential in tracing the freshness changes of aquatic products, and fluorescence matrix of excitation and emission spectroscopy technology may be used as a monitoring tool for the rapid assessment of fish freshness.
Freshness indicator prediction of bighead carp heads in simulated cold chains based on LSTM network and EEM spectroscopy
-
According to the results of the PARAFAC analysis, three types of fluorescent components could be extracted and determined for the construction of freshness prediction of the LSTM network model. The model that emerged was organized into three distinct layers: an input layer, a concealed layer, and an output layer. The input layer was composed of storage time (day), storage temperature (°C), and trait fluorescent parts of EEMs extracted through PARAFAC analysis. The output layer consisted of TVB-N, TBARS, K, and TVC values. To verify the suitability of this simulation of the actual cold chain, experimental data collected at 0, 4, 8, 12, and 16 °C were utilized as the coaching subset, and gathered experimental data in the SDS and LDT cold chains were utilized as the validation subsets. RMSE and losses continued to decrease rapidly after 200 iterations within 7 s and were stable after the 140th cycle during the training progress, which demonstrated that the EEM-LSTM network model could well predict the freshness of bighead carp heads after multiple training cycles.
The R2, RMSE, MAE, and MAPE values for the effectiveness evaluation of the EEM-LSTM model are given in Table 1. For predicting changes in the TVB-N, TBARS, K, and TVC values, the EEM-LSTM model had RMSE values of 0.8887, 0.0214, 2.1773, and 0.2740, respectively, R2 values of 0.8840, 0.9581, 0.9801, and 0.9224, MRE values of 4.25%, 6.60%, 7.50%, and 3.72%. The MAE values were all below 1.9282, and the MAPE values were all below 0.750. The EEM-LSTM freshness prediction model had high R2 values and low RMSE and MAE values, which indicated that the EEM-LSTM network model had good predictive performance. The prediction of the K value resulted in an R2 value of 0.9801, which was higher than that of the other indicators, while the prediction of the K value resulted in the highest RMSE, MAE, and MAPE values, probably because the number of K value was much larger. The study showed that the MAE, MSE, RMSE, and MAPE values indicate the quality of the regression only relative to other types of regression performance and not in an absolute manner, in contrast to the R2 value[37]. Therefore, the EEM-LSTM model showed the best performance fitting effectiveness for the K value. When integrating LSTM with optimized EEM, it is possible to predict the freshness of bighead carp under non-isothermal storage parameters. As a non-damaging detection technique, fluorescence spectroscopy combined using deep learning models can monitor the freshness of bighead carp in real-time but there is still a lot of research space. Future research can investigate the use of this method for predicting the freshness of other fish. In addition, It would be valuable to investigate whether extreme environmental conditions (such as high or freezing temperatures) impact the accuracy of the model's predictions for bighead carp freshness.
Table 1. Performance evaluation of four freshness indexes of bighead carp head predicted based on EEM-LSTM freshness prediction model of fish flesh in the SDS and LDT cold chains.
Indicators R2 RMSE MAE MAPE MRE (%) TVB-N 0.8840 0.8887 0.6241 0.0425 4.25 TBARS 0.9581 0.0214 0.0188 0.0660 6.60 K value 0.9801 2.1773 1.9282 0.0750 7.50 TVC 0.9224 0.2740 0.2233 0.0372 3.72 R2, coefficient of determination; RMSE, root mean square error; MAE, mean absolute error; MAPE, mean absolute percentage error; MRE, mean relative error. For the SDS cold chain, the proportional errors in the TBARS, TVB-N, K, and TVC values were below 8%, 9%, 10%, and 9%, respectively. For the LDT cold chain, the proportional errors in TVB-N value, TBARS value, K value, and TVC value were below 11%, 12%, 17%, and 12%, respectively (Fig. 5). The relative errors of the LDT cold chain were higher than those of the SDS cold chain, which could be related to the frequency of temperature fluctuations and the range of temperature fluctuations. Overall, the findings indicate a high level of agreement between the measured values and the predicted values of the EEM-LSTM model. The EEM-LSTM network model reported in this study could simultaneously predict four indicators, in contrast with the network models reported in other studies[9], indicating that the EEM-LSTM network model can effectively predict the change rules of indicators in simulated cold chains.
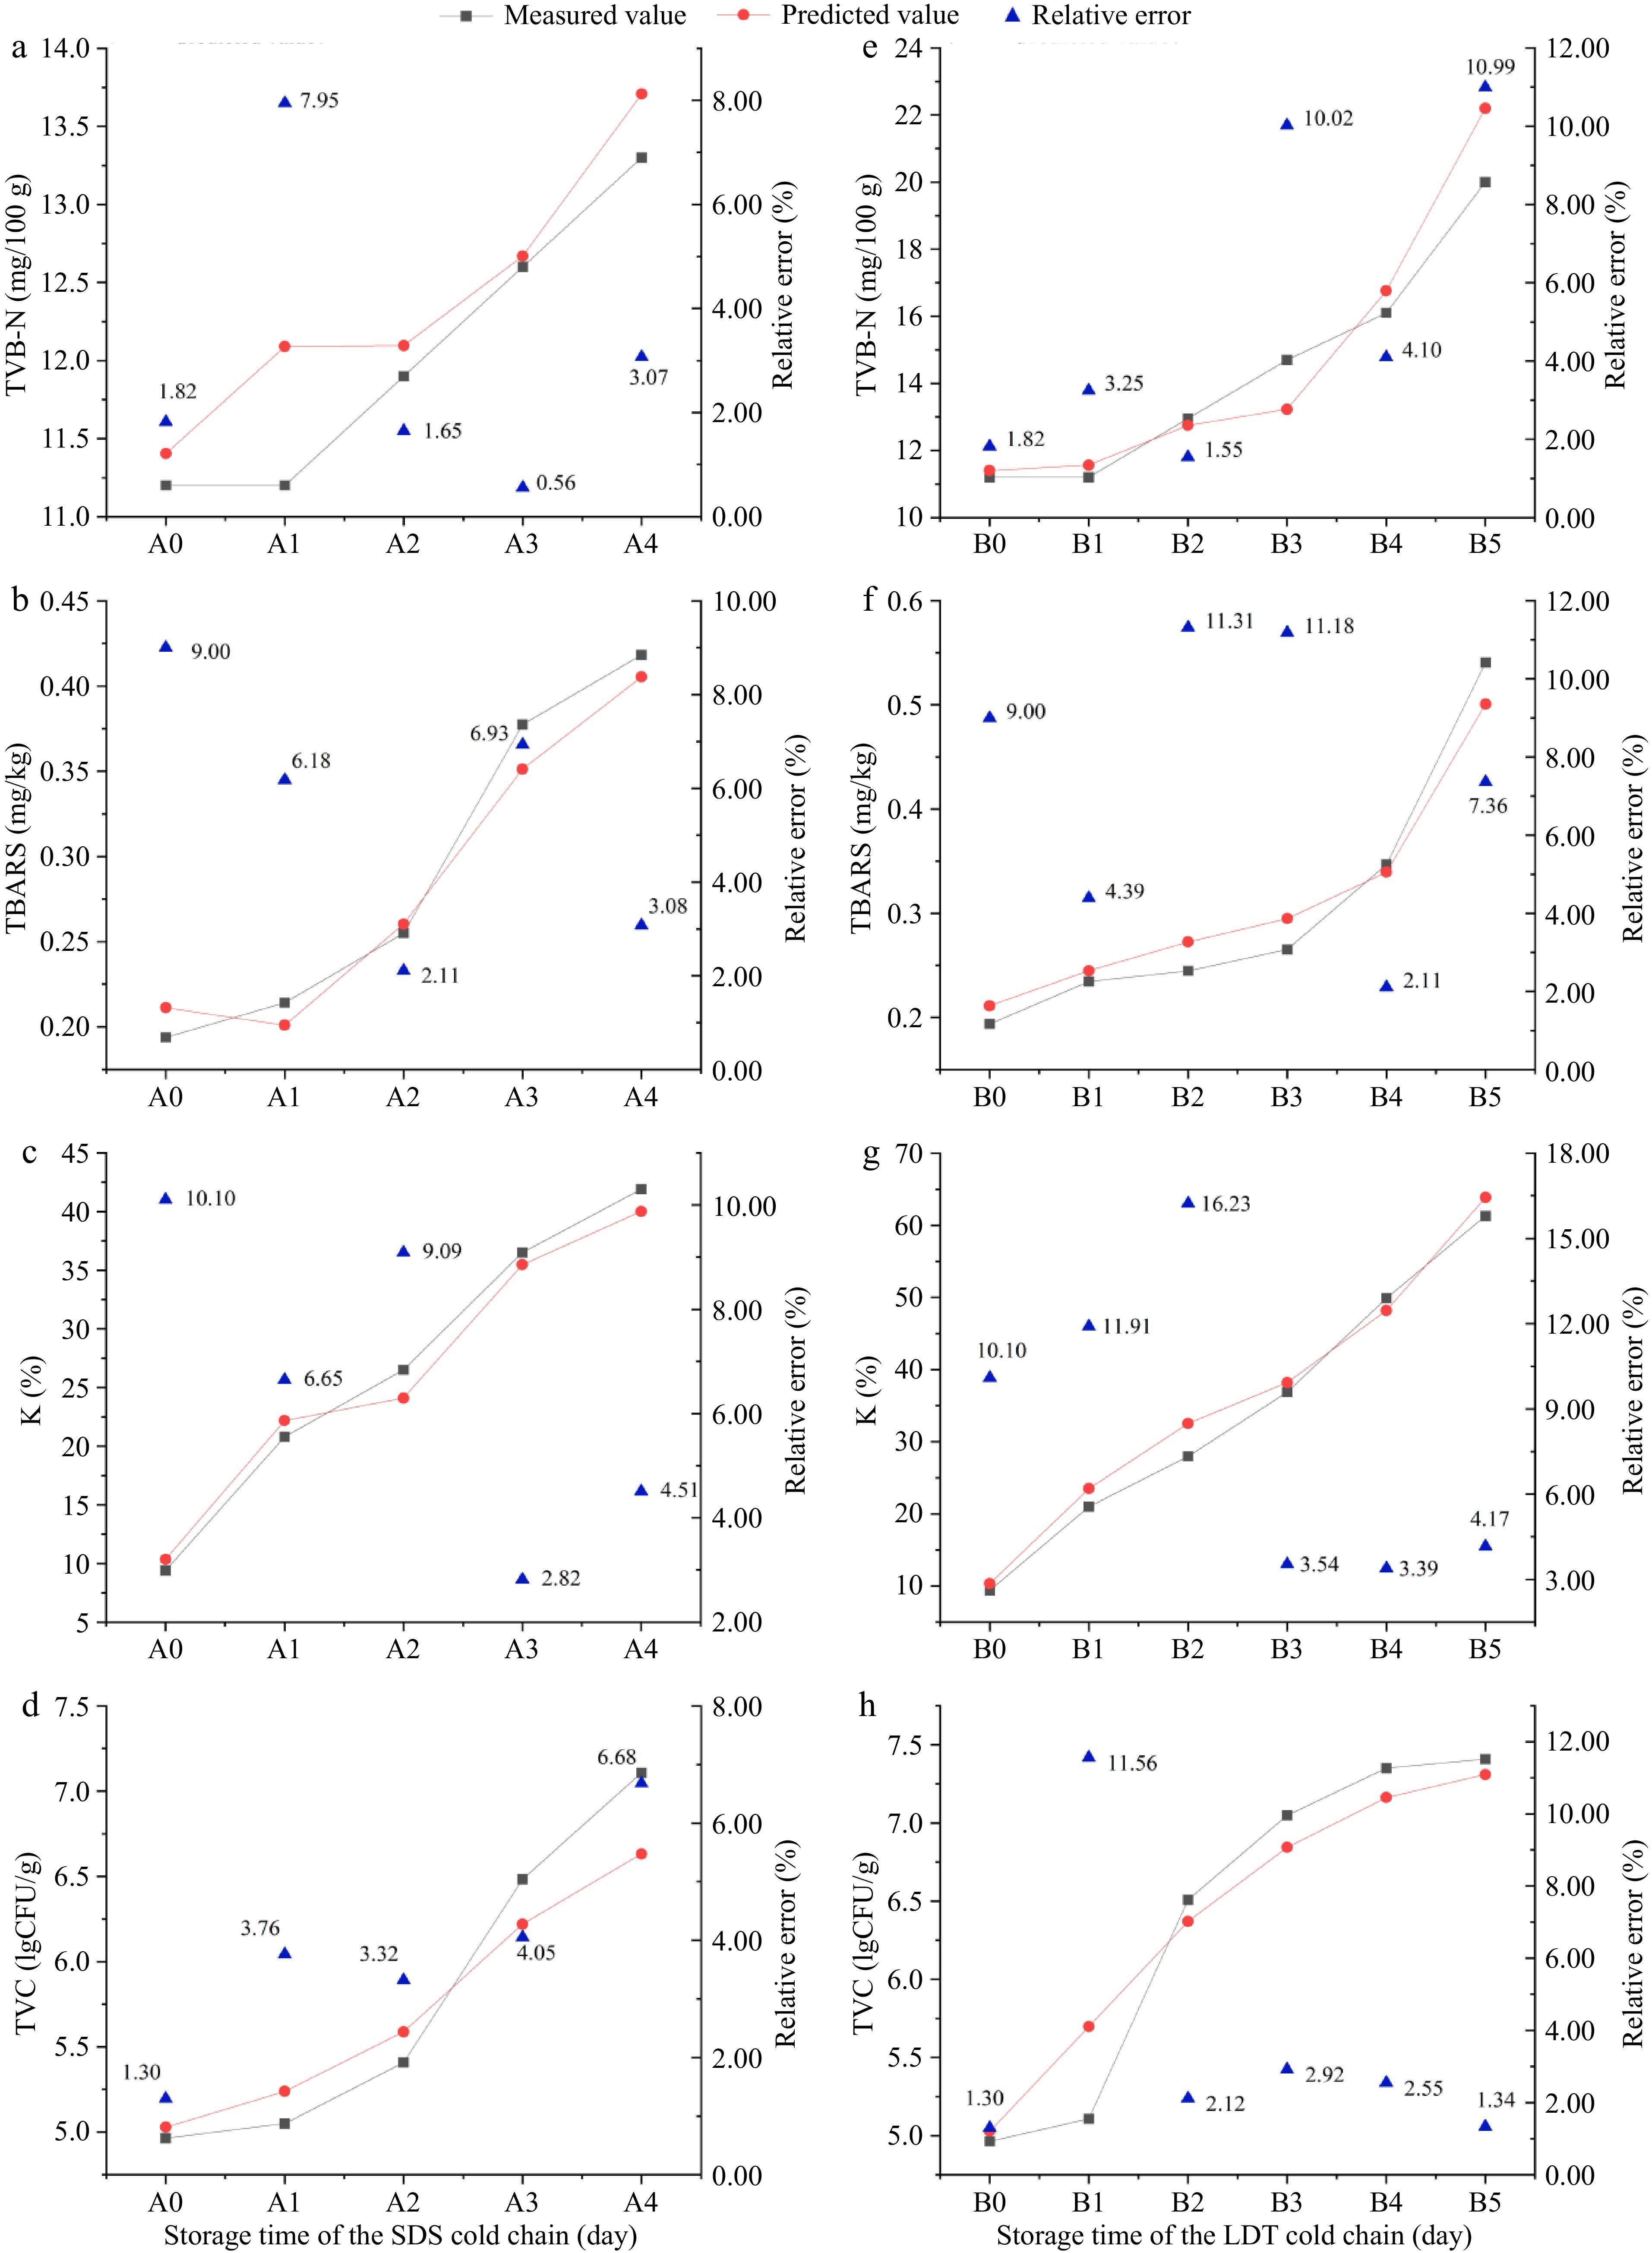
Figure 5.
Prediction of TVB-N, TBARS, K, and TVC values by the EM-LSTM model based on fish fillets in the (a)−(d) SDS, and (e)−(h) LDT cold chains. Note: A0, A1, A2, A3, and A4 in the figure correspond to five storage time points in the SDS cold chain respectively; B0, B1, B2, B3, B4, and B5 correspond to six storage time points in the LDT cold chain respectively.
-
In this study, excitation-emission matrix fluorescence spectra of fish fillets under isothermal and simulated cold chains were analyzed to study the relationship between fluorescent components and fish freshness. An EEM-LSTM network model was then established to concurrently predict the TBARS, TVB-N, K, and TVC values. By employing residual analysis, core consistency diagnostic, and half-split analysis of the PARAFAC algorithm, three crucial fluorescent components were successfully extracted. The fluorescence intensity of the fluorescent components of samples kept at different temperatures increased and consistently linked to the time-temperature history, which could be used to indicate the freshness of the heads of bighead carp. The EEM-LSTM freshness prediction model effectively forecasted the condition of bighead carp heads, showing high predictive accuracy with a high R2 value and low MSRE value, and closely aligned with the increasing trends of all four freshness indicators, which were influenced by temperature fluctuations in simulated cold chains, including both the range and frequency of fluctuations. The relative errors of the four freshness indexes predicted by the EEM-LSTM model were less than 10% and 17% in the SDS and LDT cold chains, respectively, and the total average relative error was less than 7.50%. The EEM-LSTM network model could predict the freshness of bighead carp heads more intelligibly and quickly, and it was demonstrated that excitation-emission matrix fluorescence spectroscopy had a certain potential in the freshness detection of bighead carp heads, which provided a theoretical foundation for the freshness prediction of aquatic products in actual cold chain scenarios.
This study was supported by the Beijing Academy of Agriculture and Forestry Sciences Outstanding young scientist training program, the Fund of Young Beijing Scholar, Jiangsu Science and Technology Plan (Key Research and Development Plan Modern Agriculture) Project (BE2023315), and the Ministry of Finance and Ministry of Agriculture and Rural Affairs: National System of Modern Agricultural Industry Technology (CARS-45-28).
-
The authors confirm contribution to the paper as follows: study conception and design: Shi C; draft manuscript preparation: You J; conceptualization, visualization and supervision: Sun Z; methodology: Li X, Fan H; writing - revision & editing: Fan H; statistical and mathematical methods to data analysis: Ying X. All authors reviewed the results and approved the final version of the manuscript.
-
The datasets generated during and/or analyzed during the current study are available from the corresponding author on reasonable request.
-
The authors declare that they have no conflict of interest.
- Copyright: © 2024 by the author(s). Published by Maximum Academic Press on behalf of China Agricultural University, Zhejiang University and Shenyang Agricultural University. This article is an open access article distributed under Creative Commons Attribution License (CC BY 4.0), visit https://creativecommons.org/licenses/by/4.0/.
-
About this article
Cite this article
You J, Sun Z, Li X, Ying X, Shi C, et al. 2024. Noninvasive freshness evaluation of bighead carp heads based on fluorescence spectroscopy coupled with long short-term memory network: simulation of cold chains. Food Innovation and Advances 3(4): 405−415 doi: 10.48130/fia-0024-0037 

Noninvasive freshness evaluation of bighead carp heads based on fluorescence spectroscopy coupled with long short-term memory network: simulation of cold chains
- Received: 10 August 2024
- Revised: 25 November 2024
- Accepted: 25 November 2024
- Published online: 13 December 2024
Abstract: To swiftly and noninvasively assess the freshness of bighead carp heads within simulated cold chain environments, an excitation-emission matrix fluorescence spectroscopy coupled with a long short-term memory network (EEM-LSTM) model was developed. Through the parallel factor algorithm based on analysis of residuals, diagnosis of core consistency, and split-half evaluation, three key fluorescent components from fish fillets were extracted, with the most significant components linked to tryptophan and NADH, both indicative of fish freshness. The EEM-LSTM model exhibited coherent trends in freshness indicators and demonstrated exceptional predictive capabilities for four freshness indicators simultaneously, achieving R2 values exceeding 0.8840 in simulated cold chain situations. Relative errors in the supermarket direct sales cold chain were less than 10%, surpassing those of the long-distance transport cold chain. Hence, the EEM-LSTM model stands validated for predicting fish freshness in simulated cold chains, holding promise for real-world aquatic product freshness forecasting within cold chain scenarios.