


-
The tea plant is a perennial and economic crop with a productive lifespan. Its fresh shoots are processed into tea, including green, black, Oolong, white, yellow and dark tea[1]. Numerous metabolites in fresh tea shoots are precursors which experience a series of variations during the tea manufacturing process and contribute significantly to tea quality and flavor[2]. Additionally, these metabolites play important roles in resistance for tea itself and functional effects on human health. Flavonoids, theanine, caffeine and theobromine are the dominant metabolites in section Thea (L.) Dyer[1].
Tea is basically produced from three kinds of tea plants: Camellia sinensis (L.) O. Kuntze var. sinensis, C. sinensis var. assamica (Masters) Kitamura and C. sinensis var. pubilimba Chang. As well as these, wild tea plants, involving C. tachangensis F. C. Zhang, C. taliensis (W. W. Smith) Melchior, C. crassicolumna Chang, C. gymnogyna Chang also belong to sect. Thea (L.) Dyer. The sect. Thea is divided into the above mentioned species and varieties depending on the ovary chamber number, the style splitting number and the presence or absence of ovary pubescence, combined with the corolla size and the morphology of tree, branch and leaves[3]. C. tachangensis was first identified in Yunnan, China in the 1980's[2]. C. taliensis is usually distributed in the evergreen broad-leaved forests from 1,300 to 2,400 m above sea level, mainly growing in southwestern Yunnan in China and its adjacent regions[2]. There are significant differences among C. tachangensis, C. taliensis, C. gymnogyna and C. sinensis based on the chloroplast genome[2]. A number of papers have presented the metabolites in leaves from C. sinensis with the rapid development of metabolomics technology. They reveal the effects of temperature, light, water, fertilizer, climate, altitude and other factors on metabolites of the tea plant.
Some studies have researched the metabolic characteristic of wild tea plants. C. crassicolumna which has an abundance of phenols and no caffeine or theophylline in the leaves[2]. Zhang et al.[2] found that C. tachangensis had significanbtly higher contents of epicatechin and epigallocatechin compared to C. sinensis. In contrast, Yu[4] believed that C. tachangensis had low accumulation of polyphenols, especially low content of catechins. Gujing tea (C. gymnogyna) in Guizhou province has high content of proanthocyanidins and galloylquinic acid[5], and this species in Guangxi province contains three different purine alkaloids, among which theobromine content was the highest[6]. However, there were less than three wild tea plants in each study, some conclusions are contradictory, and it is difficult to reflect their comprehensive metabolic profiles, let alone the comparison of metabolites among tea and its wild relatives. Therefore, we gathered fresh shoots from 336 accessions cultivated tea and its wild species and varieties in spring and detected their metabolic components and content. We compare their distinction of metabolites and aim to explore their characteristic metabolites. The current study elucidates the common and unique character of different tea plant species and varieties, especially flavonoids, amino acids and alkaloids.
-
The correlation between every two QC samples was calculated according to Pearson correlation coefficient. Supplemental Fig. S1 shows correlation ranges from 0.92 to 1.00, suggesting that the instrument is stable. Three methods were performed to identify compounds: (1) Retention time, primary and secondary fragments of compounds were aligned to standards; (2) Primary and secondary fragments of compounds were aligned to the literature; (3) The remaining compounds were annotated through information from online databases. A total of 4,836 metabolites were detected, 374 of which were identified (Supplemental Table S1). Concretely, 117 and 18 of them were identified through standards and literature, respectively. The remaining 239 were identified via online databases.
The identified metabolites were divided into 27 categories as presented in Fig. 1, including alcohols, alkaloids, amides, amino acids and their derivatives, benzoic acid derivatives, carbohydrates, coumarins, anthocyanins, flavam-3-ols, flavanol glycosides, flavanones, flavanone glycosides, flavones, flavonols, flavonol glycosides, isoflavone glycosides, other glycosides, furan derivatives, hydroxycinnamoyl derivatives, nucleotides and their derivatives, organic acids, quinic acids and their derivatives, terpenes, vitamins and others.
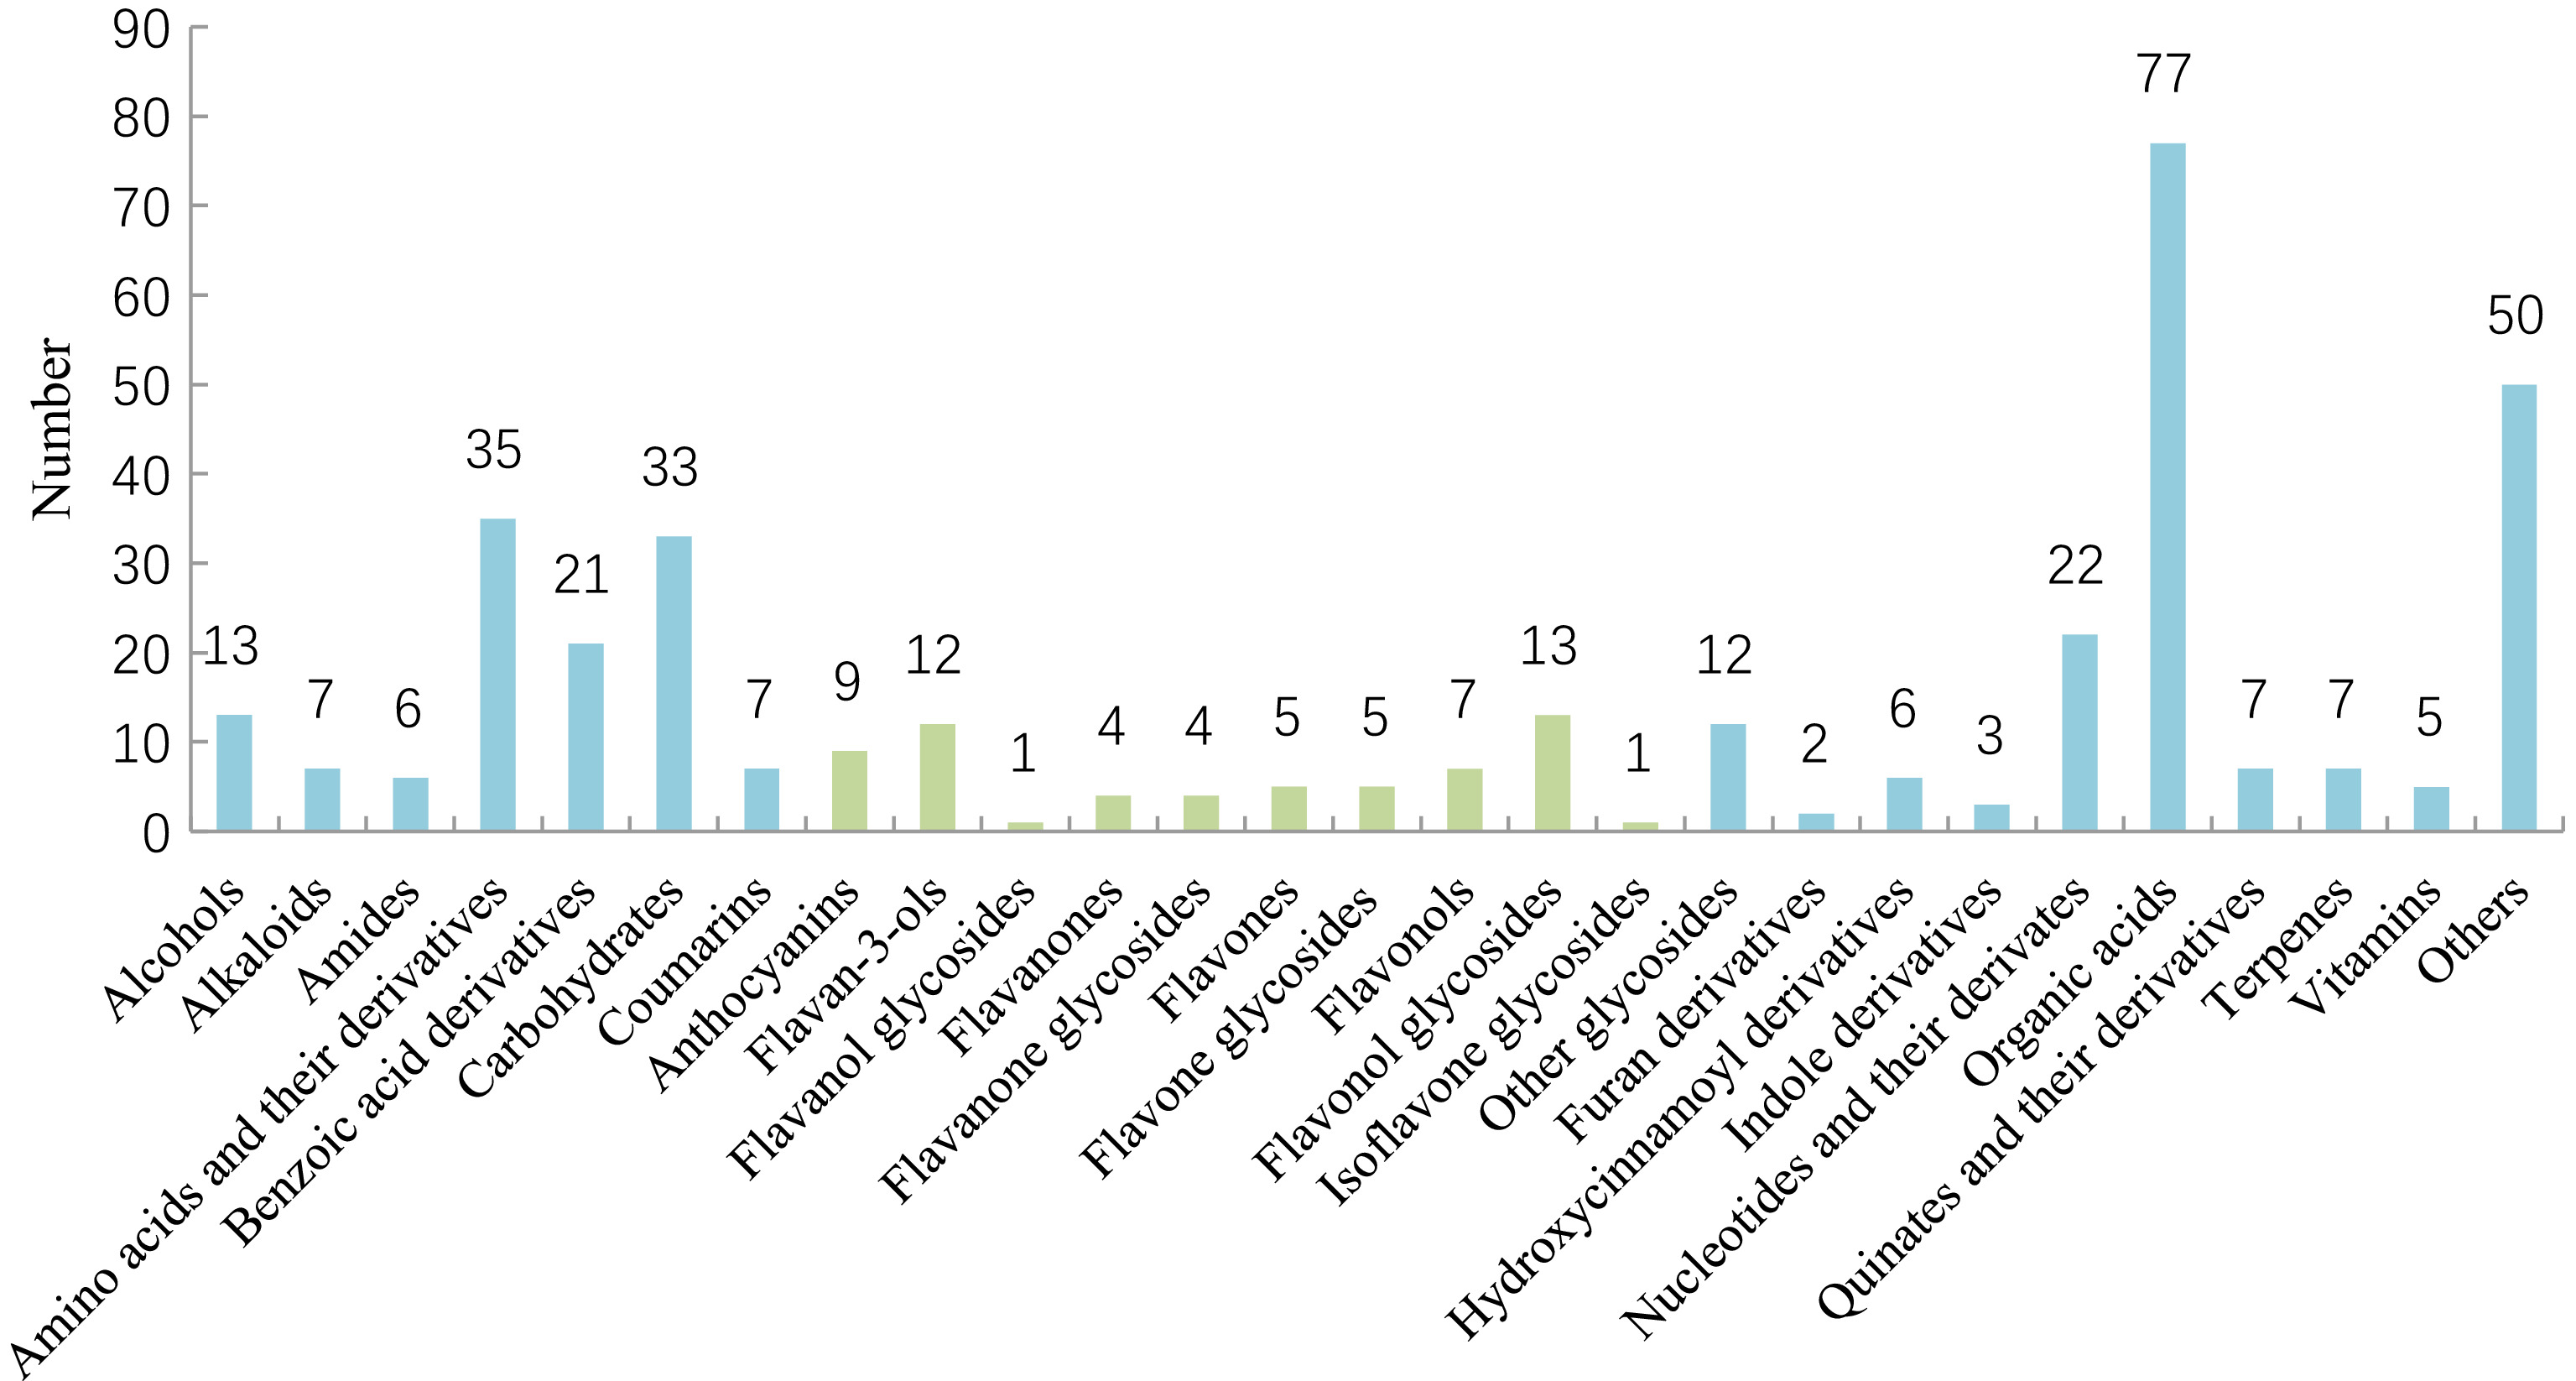
Figure 1.
Classification of metabolites for tea plant and its related species and varieties.
Cluster analysis relying on the composition and content of metabolites
-
The tea accessions could be classified as CSS [C. sinensis (L.) O. Kuntze var. sinensis], CSA [C. sinensis var. assamica (Masters) Kitamura], CSP [C. sinensis var. pubilimba Chang], CTF (C. tachangensis F. C. Zhang), CTM [C. taliensis (W.W. Smith) Melchior], CCC (C. crassicolumna Chang) in Sect. Thea (L.) Dyer, and CRL (C. reticulata Lindl.), CCT (C. crapnelliana Tutch.), CMC (C. muricatula Chang) and COC (C. oleifera Abel.) are non-tea Camellia species. K value (Calinski criterion) was 2 based on composition and content of metabolites (Fig. 2). Therefore, tea samples were divided into two groups. Group 1 contained 301 tea accessions (Supplemental Fig. S2), including CSS, CSA, CSP, CTF, CTM and CPC. Group 2 contained 22 tea plants, including CSS, CSA, CSP, CRL, CCT and COC.
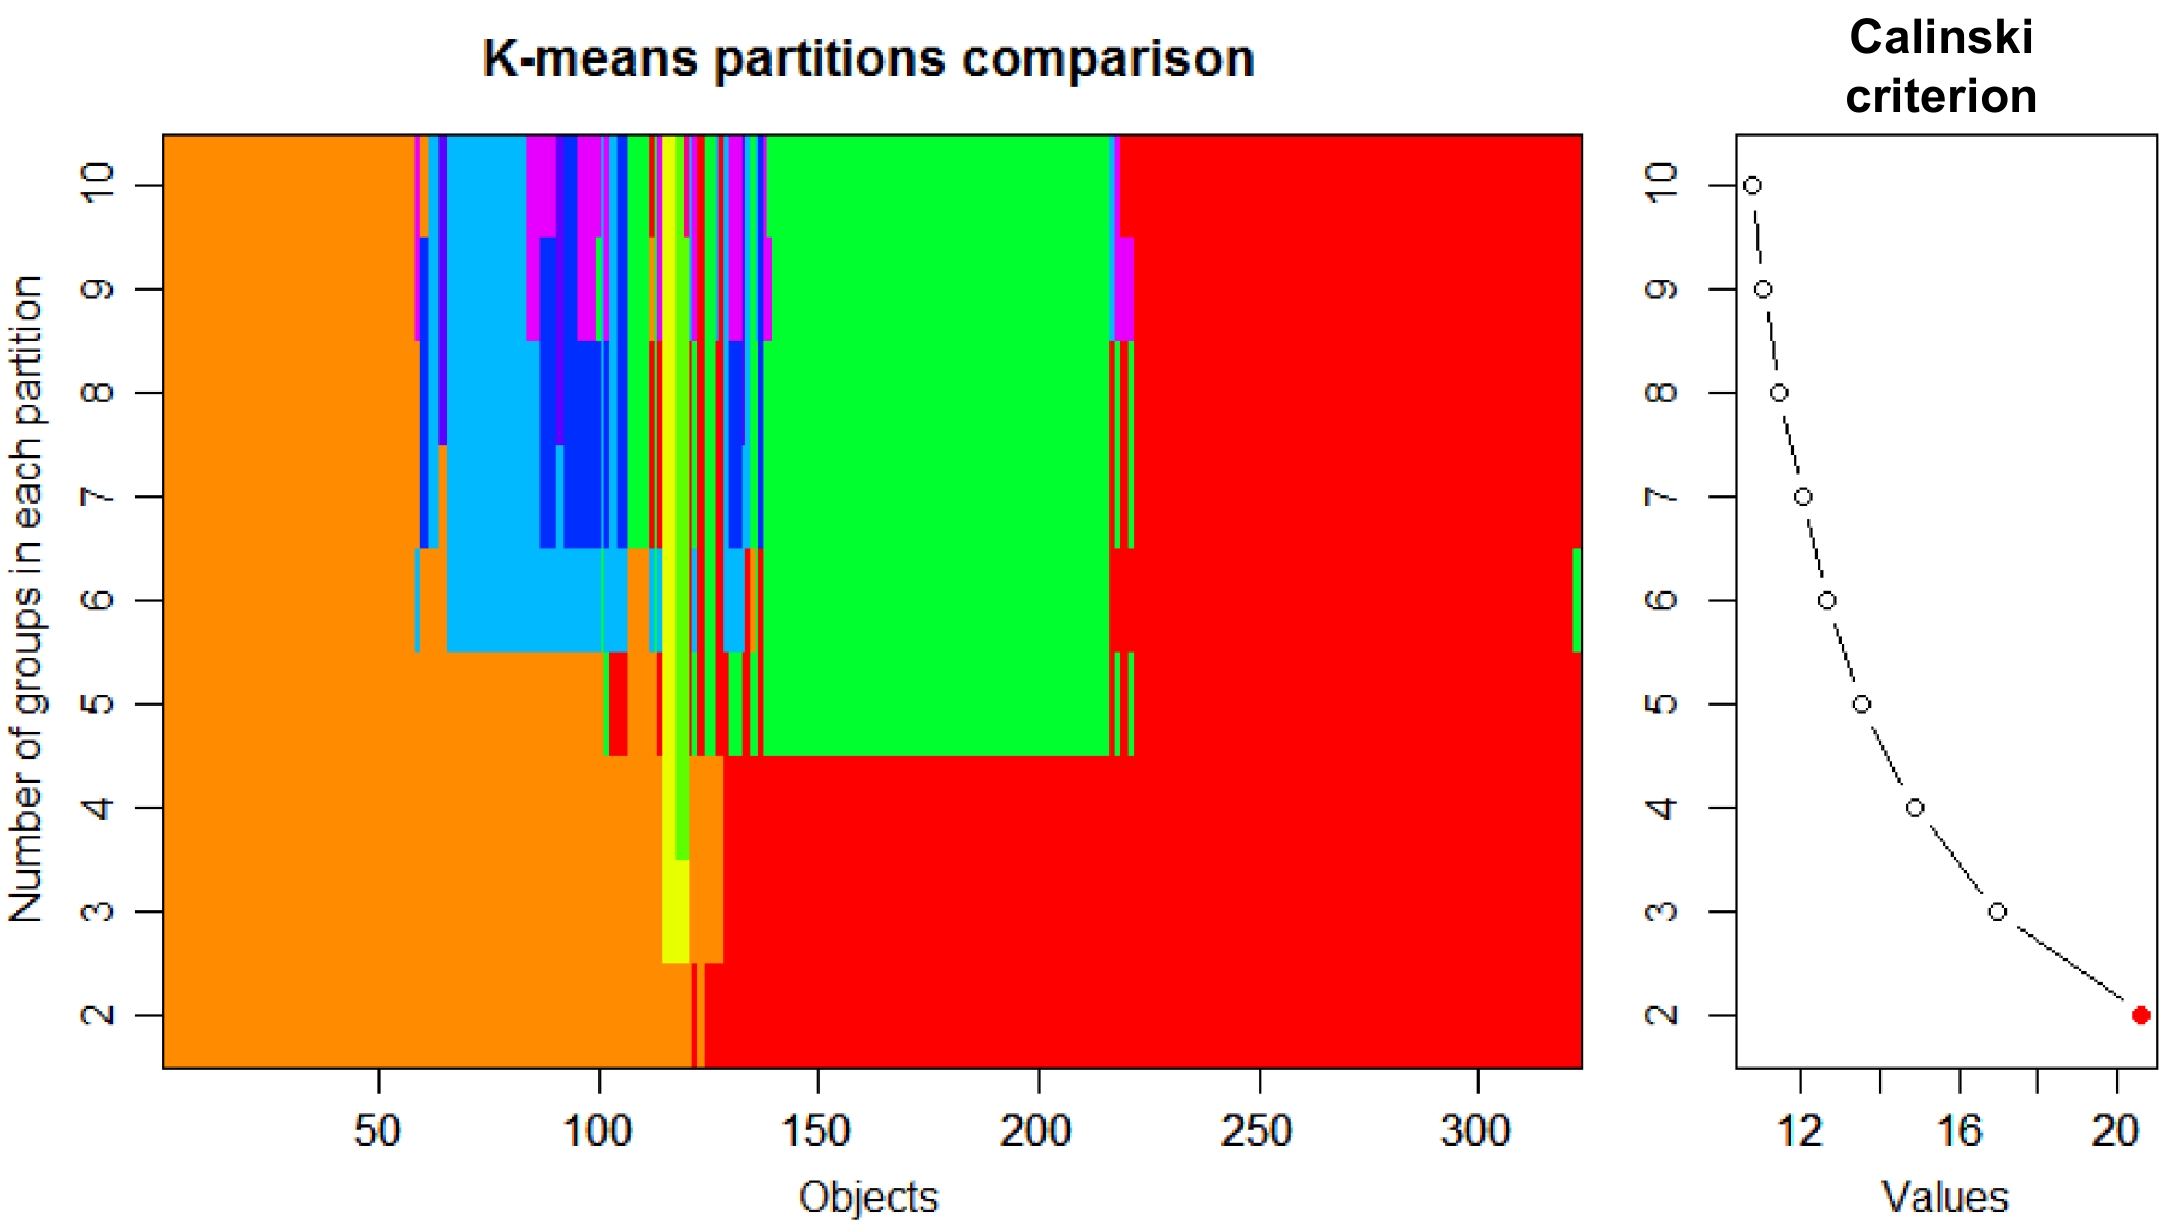
Figure 2.
Group number of tea plants determined based on Calinski criterion.
Different accumulated metabolites (DAMs) were determined after t test, whose fold change > 2, FDR < 0.05. The volcano plots of DAMs (Fig. 3a) reveal that the content of caffeine, astilbin, theacrine, 7-ethoxycoumarin, (2Z)-3-[4,5-dihydroxy-2-(2-hydroxy-2-propanyl)-2,3-dihydro-1-benzofuran-7-yl]acrylic acid, olsalazine, triga-glucose, 3-[(1-carboxyvinyl)oxy] benzoic acid, 1,6-bis-O-galloyl-β-D-glucose, matricin, malonylglycitin, GC-diGA, N-acetyl-DL-tryptophan, vitexin-2″-O-rhamnoside, glucosyl-galactosyl hydroxylysine, 3-hydroxy-10-(4-hydroxy-3-methoxyphenyl)-8-(3,5,7-trihydroxy-4-oxo-3,4-dihydro-2h-chromen-2-yl)-4-oxatricyclo[4.3.1.0~3,7~] decan-2-one, propentofylline and luteolin 7-O-(6-O-malonyl-β-D-glucoside) was significanbtly higher in Group 1 than those in Group 2. While the content of procyanidin B1, 3,4-dihydroxybenzaldehyde, catechin, 4-hydroxybenzaldehyde, 1,4-anhydro-6-O-dodecanoyl-2,3-bis-O-(2-hydroxyethyl)-glucitol, sinapinaldehyde, procyanidin B4, 1-naphthyl glucuronide, gly-lys, 1,5-anhydro-2-O-(6-O-benzoyl-α-l-galactopyranosyl)-D-glucitol, theobromine, (2R,3R)-5,7-dihydroxy-2-(4-hydroxyphenyl)-3,4-dihydro-2h-chromen-3-yl, 3,4,5-trihydroxybenzoate, 2-hydroxycinnamic acid, 1-O-vanilloyl-β-D-glucose, 3,22-dihydroxy-28-oxo-olean-12-en-16-yl acetate, gallotanin 1,2,6-tri-O-galloyl-β-D-glucopyranose, 1,2,3,6-tetra-O-galloyl-β-D-glucose, 1,2-di-O-galloyl-HHDP-glucose, GC-GCG, agmatine, iso-quercitrin 6"-acetate, 2,3-dihydro-1,4-benzodioxine-5-carboxylic acid, zizybeoside I and 5-(2-carboxyethyl)-2-hydroxyphenyl β-D-glucopyranosiduronic acid was significantly lower in Group 1 than those in Group 2.
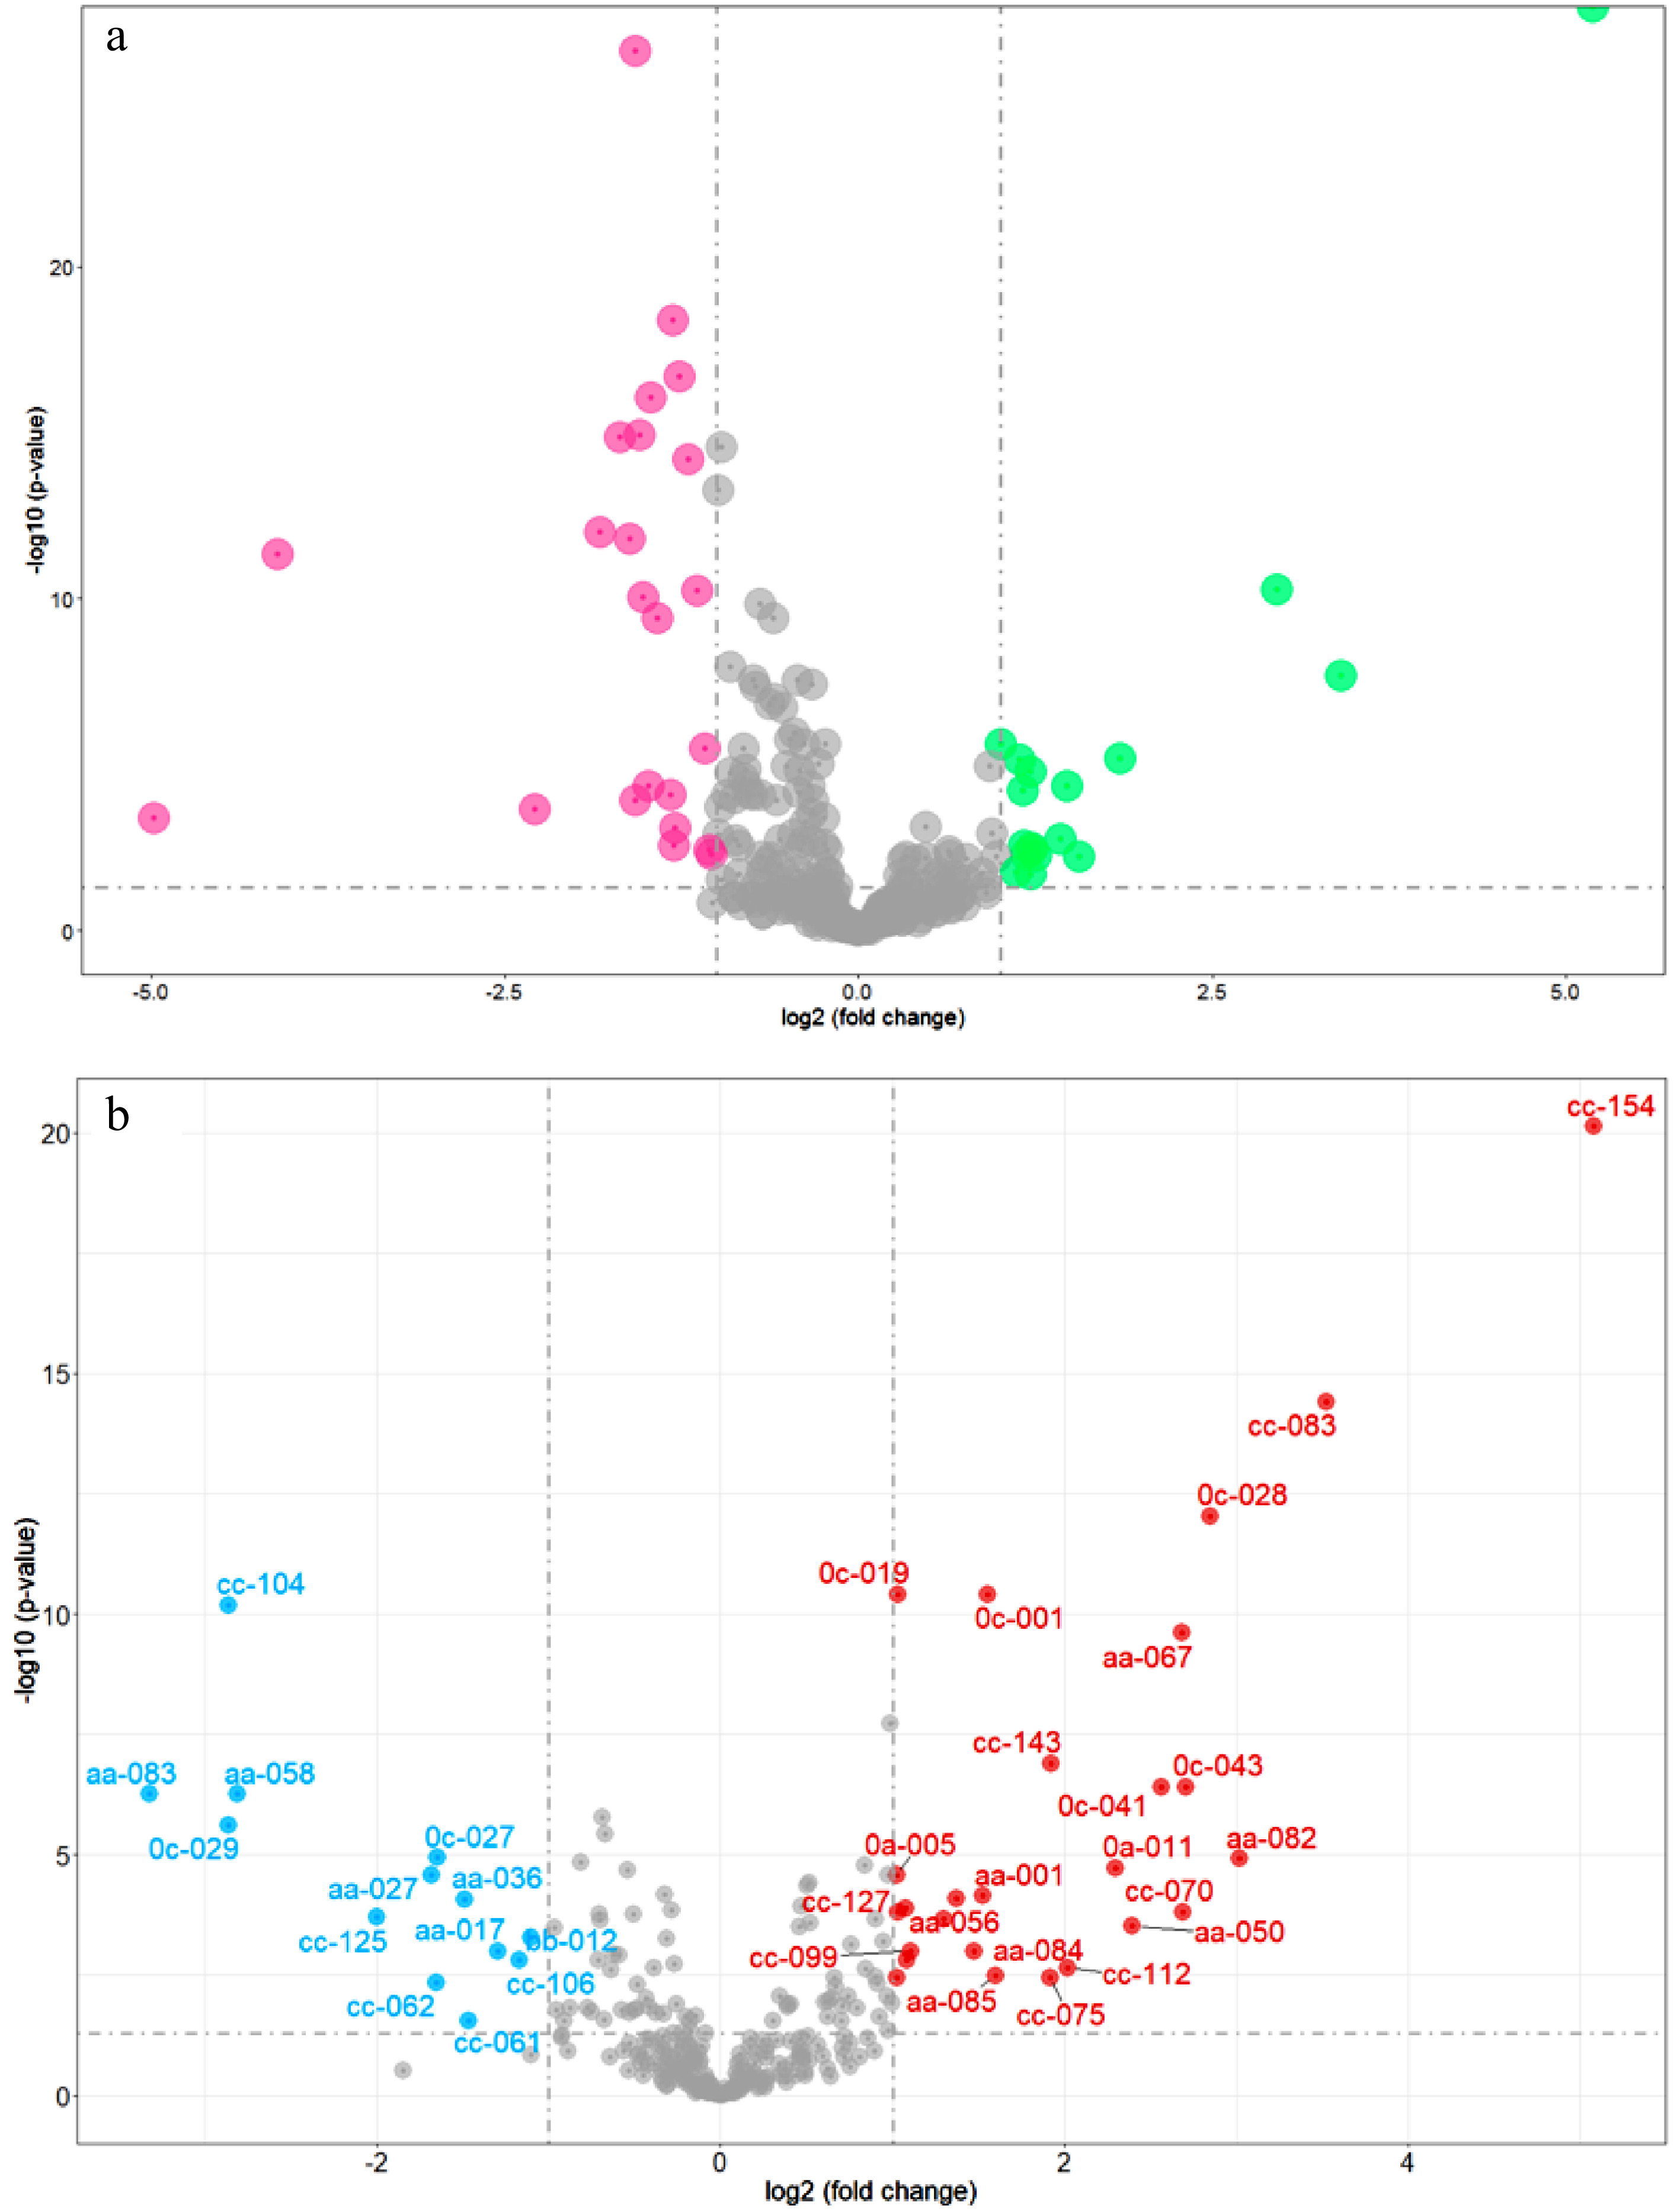
Figure 3.
Volcano plots of DAMs. (a) DAMs of natural population (red dots represent the content of DAMs that are higher in Group 2 compared to Group 1, green dots represent the content of DAMs that are higher in Group 1 compared to Group 2); (b) DAMs between Camellia sinensis and its relatives (red dots represent the content of DAMs that are higher in Camellia sinensis compared to relatives of Camellia sinensis, blue dots represent the content of DAMs that are higher in relatives of Camellia sinensis compared to Camellia sinensis).
The content of four flavan-3-ols (ECG4"Me, EGCG4"Me, GC-diGA, GC-GCG), four organic acids (2,3-dihydro-1-benzofuran-2-carboxylic acid, ursolic acid, 3-acetyl-11-keto-β-boswellic acid), three amino acids and their derivatives (L-glutathione, L-histidine L-arginine), 1 coumarin (7-hydroxycoumarine), two alkaloids (propentofylline, theacrine) is significantly higher in C. sinensis than its relatives (Fig. 3b). While the content of two quinate and its derivatives (neochlorogenic acid, chlorogenic acid), two flavonol glycosides (nictoflorin, iso-quercitrin 6"-acetate), three organic acids (1,2-di-O-galloyl-HHDP-glucose, caffeic acid, phenylacetic acid) is significantly lower in Camellia sinensis than its relatives. Furthermore, 7-hydroxycoumarine, propentofylline, 1,2-di-O-galloyl-HHDP-glucose and theacrine are the DAMs whose fold change ≥ 3 (Fig. 3b).
Metabolomic characteristic of different species and varieties of Sect. Thea
-
CRL, CCC, CMC, COC were deleted before DAM analysis among Sect. Thea plants as their sample number was less than 4. The remainder of the tea plants were CSS, CSA, CSP, CTF, CTM. The top 30 DAMs are displayed in Fig. 4. A total of 16 metabolites were in the top 30 in two consecutive years, involving amino acids and their derivatives, benzoic acid derivatives, carbohydrates, coumarins, quinate and their derivatives (Table 1). These metabolites could be used to discriminate different Sect. Thea plants. Among them, the content of L-pyroglutamic acid, L-serine, sinapaldehyde glucoside, 7-ehoxycoumarin and D - quinic acid was highest in CSS. The content of N-acetyl-DL-tryptophan and azelaic acid was highest in CSA. The content of 7-hydroxycoumarine, diGC-GA, 2-acetamido-2-deoxyglucose, kaempferitrin, nictoflorin, traumatic acid and neochlorogenic acid was highest in CTF. The content of 5'-xanthylic acid and chlorogenic acid was highest in CTM.
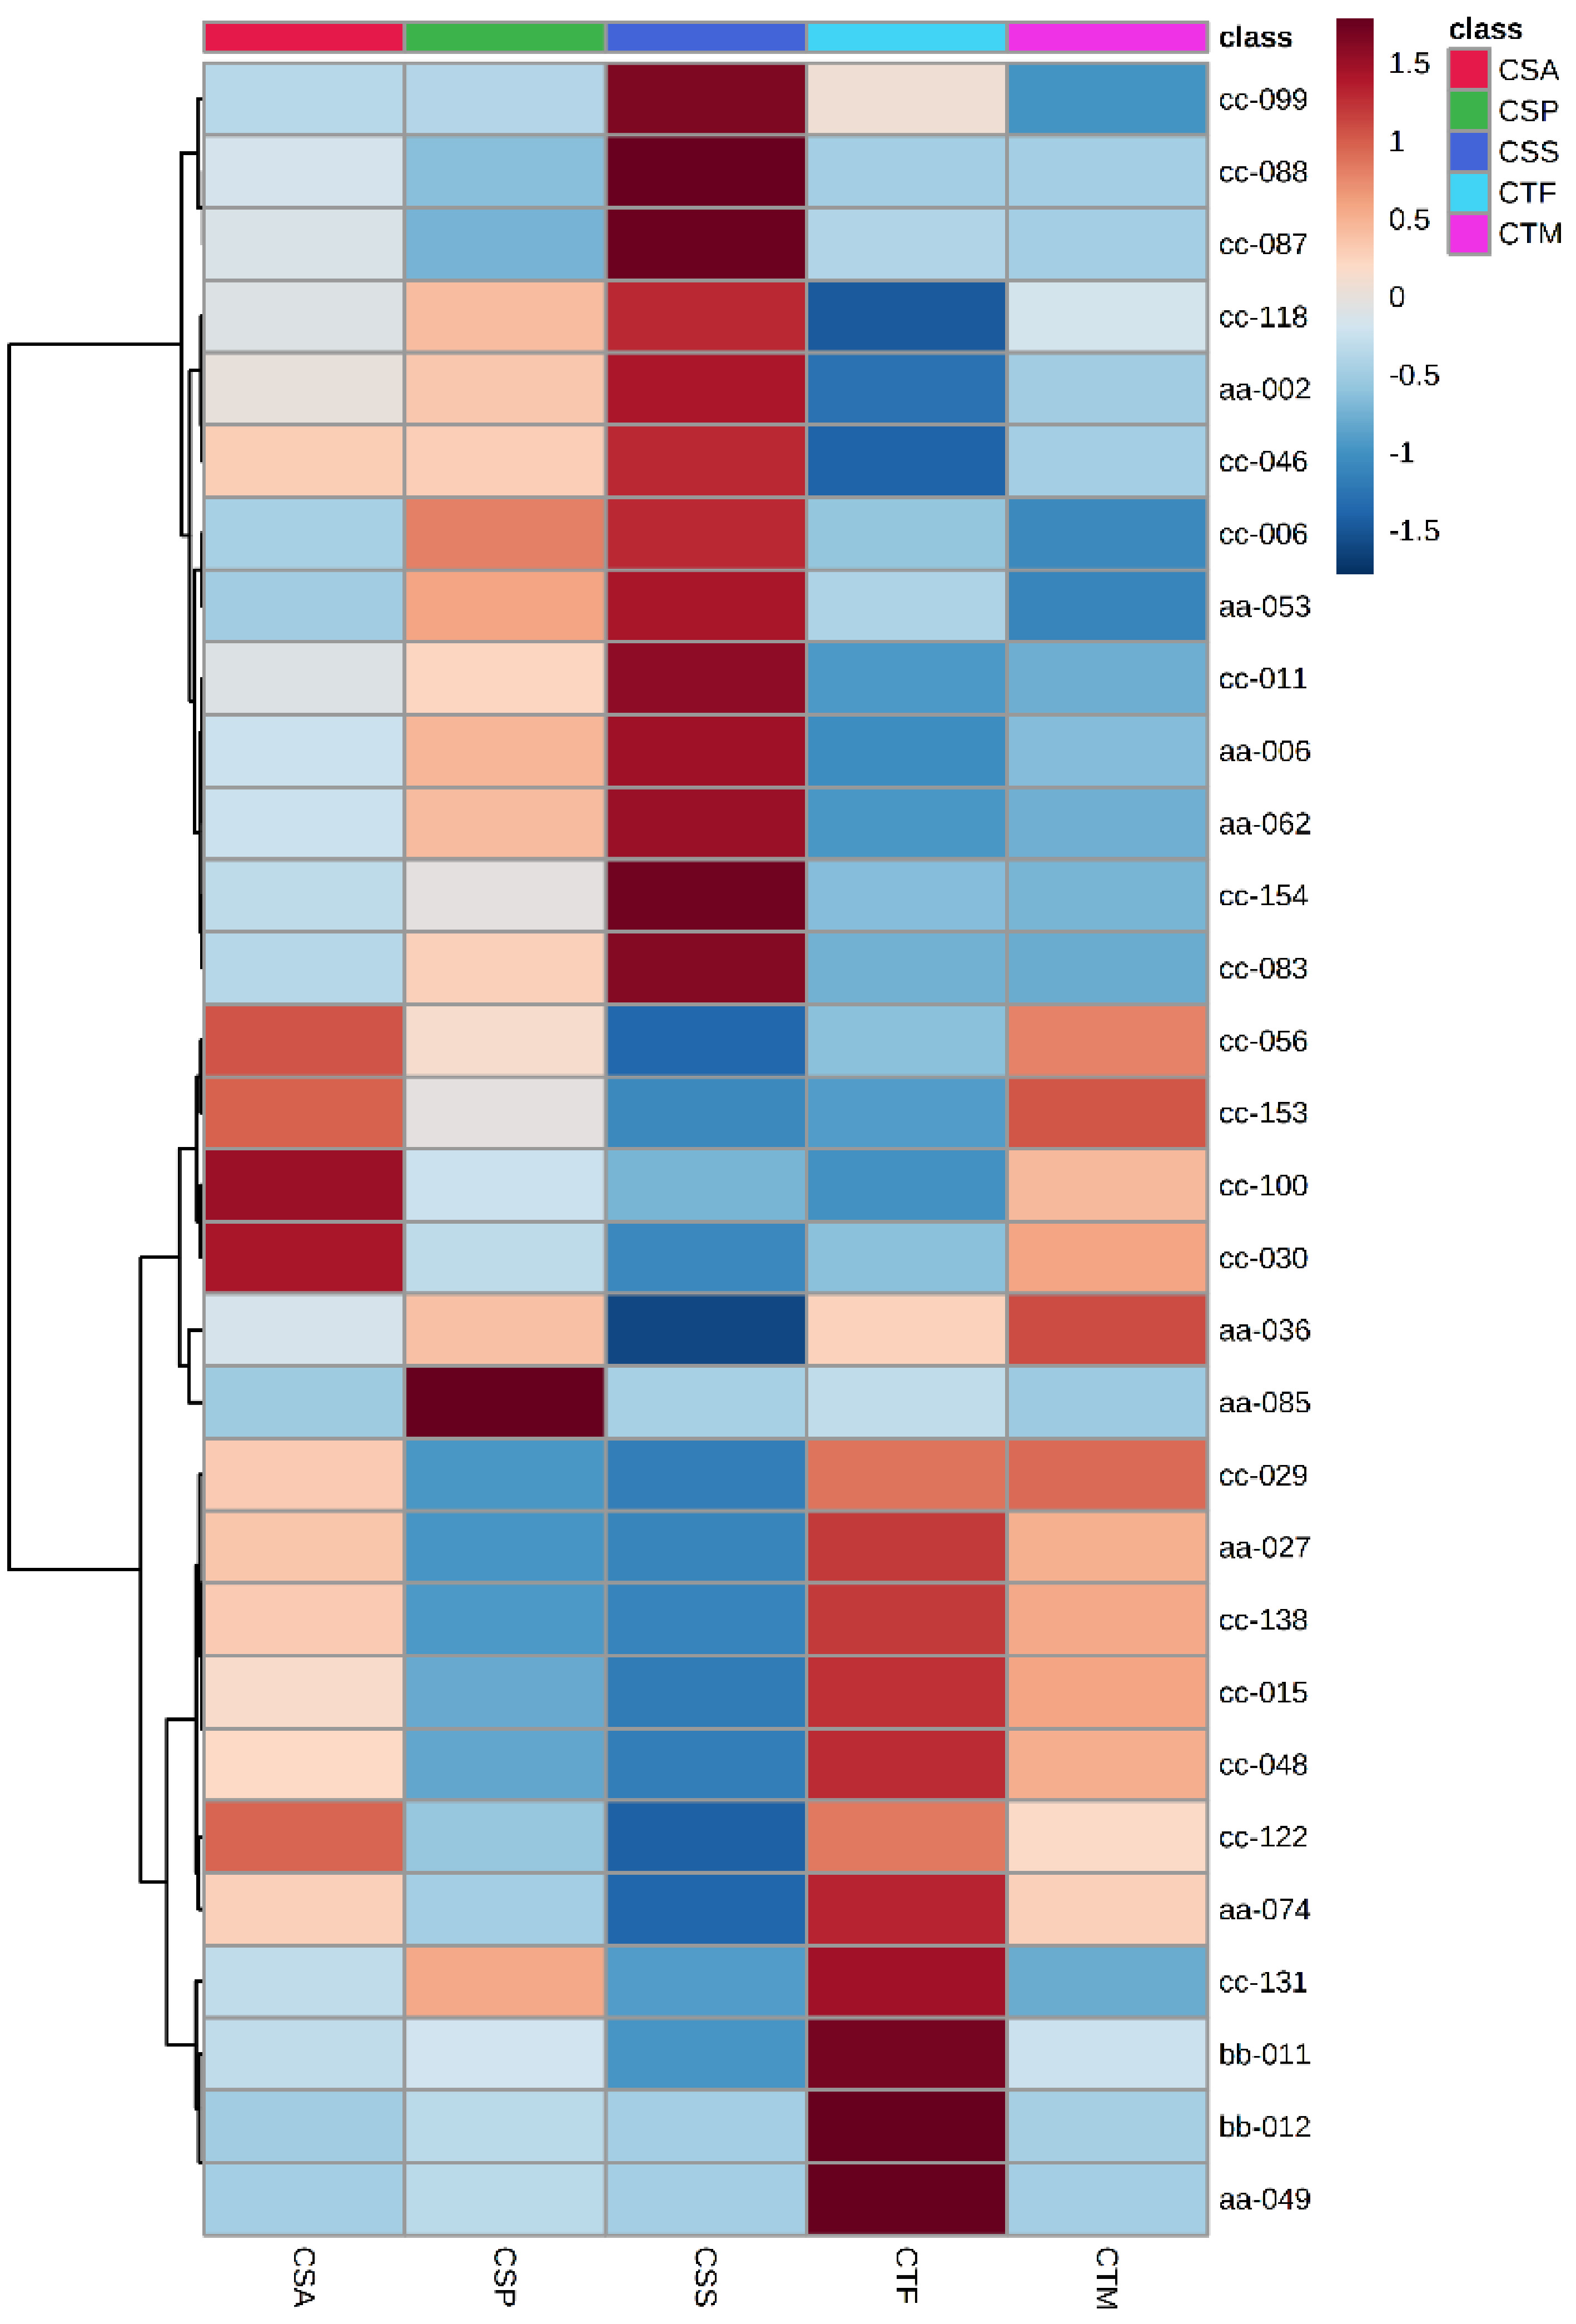
Figure 4.
Top 30 DAMs of five tea plant species and varieties.
Table 1. Signature metabolites of five tea plant species and varieties.
Representative group* Metabolite Class Relative peak area CSA CSP CSS CTF CTM CSS L-Pyroglutamic acid Amino acids and their derivatives 5.E+07 7.E+07 8.E+07 4.E+07 4.E+07 CSS L-Serine Amino acids and their derivatives 1.E+06 1.E+06 2.E+06 1.E+06 1.E+06 CSS Sinapaldehyde glucoside Carbohydrates 3.E+05 2.E+05 4.E+05 2.E+05 2.E+05 CSS 7-Ethoxycoumarin Coumarins 1.E+05 8.E+04 2.E+05 1.E+05 8.E+04 CSS D-Quinic acid Quinates and their derivatives 3.E+06 3.E+06 4.E+06 2.E+06 2.E+06 CSA N-Acetyl-DL-tryptophan Amino acids and their derivatives 1.E+06 4.E+05 3.E+05 3.E+05 1.E+06 CSA Azelaic acid Organic acids 2.E+05 1.E+05 9.E+04 2.E+05 2.E+05 CTF 7-Hydroxycoumarine Coumarins 3.E+06 2.E+06 3.E+06 4.E+06 3.E+06 CTF diGC-GA Benzoic acid derivatives 2.E+07 2.E+07 1.E+07 3.E+07 2.E+07 CTF 2-Acetamido-2-deoxyglucose Carbohydrates 2.E+06 2.E+06 1.E+06 3.E+06 2.E+06 CTF Kaempferitrin Flavonol glycosides 2.E+04 5.E+05 2.E+04 6.E+06 3.E+04 CTF Nictoflorin Flavonol glycosides 2.E+05 7.E+05 2.E+05 7.E+06 2.E+05 CTF Traumatic acid Organic acids 5.E+05 3.E+05 3.E+05 6.E+05 5.E+05 CTF Neochlorogenic acid Quinates and their derivatives 7.E+06 2.E+06 2.E+06 1.E+07 9.E+06 CTM 5'-Xanthylic acid Quinates and their derivatives 5.E+05 3.E+05 3.E+05 5.E+05 6.E+05 CTM Chlorogenic acid Quinates and their derivatives 1.E+07 1.E+07 4.E+06 9.E+06 2.E+07 * CSS: C. sinensis var. sinensis (L.) O. Kuntze; CSA: C. sinensis var. assamica (Masters) Kitamura; CSP: C. sinensis var. pubilimba Chang; CTF: C. tachangensis F. C. Zhang; CTM: C. taliensis (W. W. Smith) Melchior. Polymers of flavonoids
-
There are abundant polymers of flavonoids in the identified metabolites (Table 2). A total of 32 flavonoid polymers were identified, consisting of flavonoid, sugar and gallic acid. Most of them were catechin polymers and flavonoid glycosides. More interestingly, flavonol was the major monomer of flavonoid glycosides. A total of 23 flavonol glycosides were identified in the current study, whose major glycoside ligands were glycose and rhamnose. In addition, almost all the glycoside ligands were hexose.
Table 2. Polymers of flavonoids.
Name Classification Formula GC-GCG Anthocyanins C37 H30 O18 Procyanidin B1 Anthocyanins C30 H26 O12 Procyanidin B3 Anthocyanins C30 H26 O12 Procyanidin B4 Anthocyanins C30 H26 O12 Procyanidin C1 Anthocyanins C30 H26 O12 Tricatechins1 Anthocyanins C45 H38 O18 Tricatechins2 Anthocyanins C45 H38 O18 Tricatechins3 Anthocyanins C45 H38 O18 GC-diGA Benzoic acid derivatives C29 H22 O15 Eriocitrin Flavanol glycosides C27 H32 O15 Eriodictyol C-hexoside Flavanone glycosides C21 H22 O11 Naringin Flavanone glycosides C27 H32 O14 Naringin dihydrochalcone Flavanone glycosides C27 H34 O14 Prunin Flavanone glycosides C21 H22 O10 Baicalin Flavone glycosides C21 H18 O11 Cynaroside Flavone glycosides C21 H20 O11 Luteolin 7-O-(6-O-malonyl-β-D-glucoside) Flavone glycosides C24 H22 O14 Schaftoside Flavone glycosides C26 H28 O14 Astilbin Flavonol glycosides C21 H22 O11 Baimaside Flavonol glycosides C27 H30 O17 Isoquercetin Flavonol glycosides C21 H20 O12 Kaempferin Flavonol glycosides C21 H20 O10 Kaempferitrin Flavonol glycosides C27 H30 O14 Myricetin 3-O-galactoside Flavonol glycosides C21 H20 O13 Nictoflorin Flavonol glycosides C27 H30 O15 Quercetin 3-O-α-D-xylopyranoside Flavonol glycosides C20 H18 O11 Quercitrin Flavonol glycosides C21 H20 O11 Rutin Flavonol glycosides C27 H30 O16 Tiliroside Flavonol glycosides C30 H26 O13 Vitexin Flavonol glycosides C21 H20 O10 Vitexin-2''-O-rhamnoside Flavonol glycosides C27 H30 O14 Malonylgenistin Isoflavone glycosides C24 H22 O13 -
The non-volatile compounds in tea could be divided into six groups, which were hydrolysable tannins, flavan-3-ols and their derivatives, flavonoids, alkaloids and theanine, simple phenols and their derivatives, terpenes[13]. In the present study, the non-volatile compounds in tea were divided into 27 groups, according to functional group integrated with chemical structure. Organic acids possessed the largest number among all the classifications. Gallic acid, benzoic acid, chlorogenic acid, α-ketoglutaric acid, malic acid, citric acid and oxalic acid were the predominant organic acids. Among them, organic acids play an important role in the metabolism of tea plants and tea quality usually as intermediate products from carbohydrate decomposition. The stability, water-solubility and activity of benzoic acid were changed after methylation or glycosylation[7]. Benzoic acid, chlorogenic acid, gallic acid and their derivatives were the essential phenolic acids in tea plants. Their content decreased with the maturity of tea leaves[8]. The content of benzoic acid near to the flowers declined during the flowering process[9]. The content of gallic acid was dramatically increasing in the process of green and black tea manufacturing[10]. White and green tea contained high-content chlorogenic acid, with white tea containing the most[11]. During deoxidation of Oolong tea, gallic acid was generated from the degradative ester-catechin[12]. These studies imply that organic acids are of great importance for the growth and development of tea plant and the quality of tea.
Tea plants in a narrow sense mean C. sinensis and its varieties. Tea plants in a broad sense, i.e., the Sect. Thea (L.) Dyer, include C. tachangensis F. C. Zhang, C. crassicolumna Chang, C. taliensis (W.W. Smith) Melchior, C. gymnogyna Chang, C. sinensis (L.) O. Kuntze and its three varieties C. sinensis (L.) O. Kuntze var. sinensis, C. sinensis var. assamica (Masters) Kitamura and C. sinensis var. pubilimba Chang. The last two varieties are currently widely cultivated tea plants in China. C. sinensis (L.) O. Kuntze var. sinensis is mainly distributed south of the Yangtze River. It has disseminated eastward to Japan and Korea, westward to Tibet, China and southward to northern Burma[13]. C. sinensis var. assamica (Masters) Kitamura is mainly distributed in Yunnan and its neighboring regions and countries, such as Vietnam, Thailand and Burma[13]. The majority of wild tea plants are CTF, CCC, CTM and CGC. CTF grows in eastern Yunnan, southwestern Guizhou and western Guangxi[14]. Compared to CSS, CTF contains higher amounts of EC, EGC, di-EC, ECG-EC, EGC-EC and tri-EC, with lower content of ester catechins[14]. There are abundant phenols in CCC. A total of 18 phenols were identified in C. crassicolumna var. multiplex, involving four flavanols, six flavonol glycosides, three hydrolysable tannins, two derivatives from chlorogenic acid, and three simple phenols[15]. There was no caffeine or theophylline in one C. crassicolumna var. multiplex[13]. In two CCC, the content of caffeine was 0.83% and 0.059%, the content of theobromine was 0.05% and 0.07%[16]. However, in the present study, 3.26 ± 0.09% of caffeine was detected in one CCC through HPLC. It is likely that there are differences in alkaloid content among various CCC. Further CCC samples need to be gathered to explore their metabolic characteristics in the future. CTM, one of the most predominant tree varieties in southern tropical evergreen broad-leaved forest, is distributed from the middle of Lancang River in Hengduan Mountains of Yunnan to the Irrawaddy River Basin[17]. CTM is the relative of cultivated tea plant[18]. CTM from Lincang had nine phenols containing eight hydrolysable tannins, six catechin derivatives, three quinic acid aromatic esters, and two simple phenolics identified, along with caffeine[19]. Theobromine, caffeine and theacrine were detected in one CGC from Dayao Mountain and theobromine was its major alkaloid[6]. The content of theacrine was 3.2 times that of caffeine in CGC[20]. The results in the current study demonstrate that the composition and percentage of amino acids and their derivatives, benzoic acid derivatives, carbohydrates, coumarins, flavonol glycosides, nucleotide acids and their derivatives, organic acids, quininic acids and their derivatives could be distinct to different Sect. Thea. Flavonoids are the essential secondary metabolites in tea plant, closely related with flavor and the quality of brewed tea[21]. The convergence of soup is mainly caused by these substances[1]. Glycosylation is a ubiquitous modification process in plants[22]. Many substances have changed through glycosylation stability, solubility, biological activity and pharmacokinetics, which also helps tea plants resist biotic and abiotic stresses[22]. Glycosides are important metabolites in plants, which have the function of free radical scavenging, anti-radiation, anti-diabetes, and enhancing immunity[23]. Various flavonoid glycosides are formed in plants under the catalysis of UFGT. Phenolic acids, flavonols, flavonoids and isoflavones are the main substrates of UFGT[24]. Tea shoots are rich in flavonoid polymers, mainly flavonoid glycosides and anthocyanins. Natural flavonoids usually exist in glycoside form. The precursors of flavonols, flavonoids, anthocyanins, saponins and aroma substances mainly exist as glycosides in tea. The solubility of flavonoid glycosides is greater than that of flavonoids. Thus, flavonoid glycosides have greater influence on tea taste than flavonoids. The content of naringenin-7-O-glucoside, quercetin-3-O-glucoside and kaempfer-3-O-(6''-O-p-coumaryl)-glucoside in fresh tea leaves in August are higher than those in other seasons[25]. It could explain the reason why summer and autumn tea are more bitter and astringent. Myrice-3-O-rhamnoside, myrice-3-O-galactoside, myrice-3-O-glucoside, quercetin-3-O-glucosyl-rhamnosyl-galactoside, quercetin-3-O-glucosyl-rhamnosyl-glucoside, vitexin-2''-O-rhamnoside, kaempfer-3-O-rutinoside, kaempfer-3-O-galactoside and kaempfer-3-O-glucoside were detected in tea[26]. A total of 202 glycosides in green tea were identified, and the sugar ligands were mainly glucose, galactose, rhamnose, rutose and primrose[27]. The higher the content of glycosides binding to EC, the lower the dimer content of EC, which indicates that the glycosides of EC are important donors of EC dimer[16]. It is likely that theanine converted into N-ethylpyrrolidone after deamination and decarboxylation. Then it may combine with the catechin A ring at 6-C or 8-C position to form theanine-catechin complex[28]. However, the polymers of theanine and catechin were not detected in this study, which may be due to the low content of theanine and catechin or the low response value of the instrument. It deserves establishing specific methods to detect these polymers in future.
-
A total of 374 non-volatile metabolites were identified in tea plant (Camellia sinensis) and its closely related species and varieties. Organic acids and flavonoid are the most abundant and special non-volatile metabolites in tea plants, respectively. 7-hydroxycoumarine, propentofylline, 1,2-di-O-galloyl-HHDP-glucose and theacrine are the top four DAMs between C. sinensis and its relatives. Seven categories of substances: amino acids and their derivatives, benzoic acid derivatives, carbohydrates, coumarin, flavonol glycosides, organic acids, quinic acid and its derivatives are the top 30 DAMs among CSS, CSA, CSP, CTF, and CTM.
-
The samples were collected from 336 tea accessions from Sect. Thea (L.) Dyer, Camellia L. and non-tea Camellia species, namely, 209 accessions of C. sinensis (L.) O. Kuntze var. sinensis, 66 accessions of C. sinensis var. assamica (Masters) Kitamura, 32 accessions of C. sinensis var. pubilimba Chang, four accessions of C. tachangensis F. C. Zhang, 15 accessions of C. taliensis (W. W. Smith) Melchior, one accession of C. crassicolumna Chang, five accessions of Camellia sp., and one accession of C. muricatula Chang, C. reticulata Lindl., C. crapnelliana Tutch and C. oleifera Abel. (Supplemental Table S2). In the first round, two leaves and a bud from healthy tender shoots were harvested from March 16 to April 30, 2019. All the natural population tea plants were cultivated under the same horticultural conditions and management in the China National Germplasm Hangzhou Tea Repository in Hangzhou, China. Samples were fixed in liquid nitrogen immediately after plucking and were stored at −80 °C.
Sample extraction
-
Ten milliliters of 70% methanol were added to 0.2 (± 0.001) g of tea powder. The mixture was treated with ultrasonic extraction for 0.5 h. The supernatant was passed through a 0.22 μm film after standing at 4 °C for 2 h. The extracts were taken in a brown injection bottle and stored at −80 °C until injection. Then, 100 μL of the extract was taken as a Quality control (QC). And 10 μL internal standard (0.025 mg/mL of sulfacetamide) was added to the sample before testing.
LC-MS conditions
-
Metabolite detection was performed using a UPLC (Thermo Scientific Dionex Ultimate 3000, USA)-Q-Orbitrap (Thermo Scientific Q Exactive, USA) with a column C18 (SB-AQ, 1.8 μm, 2.1 mm × 100 mm, Agilent, USA). Mobile phase A and B were 0.1% (v/v) formic acid in water and 0.1% (v/v) formic acid in acetonitrile. The gradient elution program was as follows: 0-6 min, 5%−20% B; 6−10 min, 20%−95% B; 10−11.5 min, 95% B; 11.5−15 min, 95%−5% B. The sample chamber temperature and the column temperature were 4 °C and 40 °C, respectively. The injection volume was 2 μL with 0.3 mL/min. The relative collision energies were 15, 30, and 60. The m/z scanning range was 70−1,000. The spray voltage was 3.5 KV with the drying gas temperature at 320 °C, the auxiliary gas temperature at 350 °C, and the protective gas flow rate at 40 arb. The primary resolution was 70,000. The automatic gain control was 1e6. The secondary resolution was 17,500, and the automatic gain control was 1e5.
Construction of the standard data base
-
Standards were dissolved with 70% methanol to 1.00 mg/mL as technical concentration. The mother liquid was diluted to 50 ng/mL.
Metabolic data processing
-
Information such as substance name, mass-to-charge ratio, file location retrieved from standards and literature were input to mzValut to build a local library. The local library and sample information was imported into Compound discoverer 2.1 to characterize and quantify metabolites. The substances in the local library were characterized according to RT (retention time), accurate mass of primary mass spectrometry and secondary mass spectrometry, with ΔRT ≤ 0.5 min and Δm/s ≤ 5 ppm. Substances that were not in the local library were annotated by accurate mass alignment with primary and secondary mass spectra of substances in public databases AraCyc, BioCyc, Human Metabolome Database, KEGG, Lipid Maps, and PlantCyc with Δm/s ≤ 5 ppm. Solvent mass spectra were used to remove background noise. QC was used for peak alignment and correction.
Data analysis
-
Metabolite taxonomic statistics were performed using Microsoft Office Excel 2010. The Pearson correlation coefficient between QCs was calculated using the gpubr package in R3.6.2 and visualized with the ggplot2 package. Cluster analysis was performed on multiple samples according to the composition and content of metabolites. The fpc and vegan packages were used to determine the number of clusters according to K-means. The optimal k value was determined based on Calinski criterion. The distance matrix between samples was calculated via the cluster package based on ward.D2 in the pedigree clustering. Ape package was used for visualization. DESeq2 was used to calculate log2 (Fold Change) and p value between groups after variance analysis. The p value was corrected via Benjamini-hochberg to obtain adj-p. DAMs (differentially accumulated metabolites) were screened as Fold change > 2 and adj-p < 0.05. Volcano plots were created using the ggplot2 package.
This work was supported by the National Natural Science Foundation of China (32072631), the Chinese Academy of Agricultural Sciences through the Agricultural Science and Technology Innovation Program (CAASASTIP-2017-TRICAAS), China Agriculture Research System of MOF and MARA (CARS-19) to LC.
-
The authors declare that they have no conflict of interest.
- Supplemental Fig. S1 Identified metabolites in the fresh shoots of tea accessions.
- Supplemental Fig. S2 Cluster analysis of the natural population. (Green represents Group 1, purple represents Group 2).
- Supplemental Table S1 Identified metabolites in the fresh shoots of tea accessions.
- Supplemental Table S2 Information of tea plants.
- Copyright: © 2022 by the author(s). Published by Maximum Academic Press, Fayetteville, GA. This article is an open access article distributed under Creative Commons Attribution License (CC BY 4.0), visit https://creativecommons.org/licenses/by/4.0/.
-
About this article
Cite this article
Jiang C, Moon DG, Ma J, Chen L. 2022. Characteristics of non-volatile metabolites in fresh shoots from tea plant (Camellia sinensis) and its closely related species and varieties. Beverage Plant Research 2:9 doi: 10.48130/BPR-2022-0009 

Characteristics of non-volatile metabolites in fresh shoots from tea plant (Camellia sinensis) and its closely related species and varieties
- Received: 03 April 2022
- Accepted: 06 May 2022
- Published online: 01 June 2022
Abstract: Tea plant (Camellia sinensis) and its closely related species and varieties belong to Sect. Thea (L.) Dyer, Camellia L. There are abundant compounds in the fresh shoots of section Thea (L.) Dyer species and varieties. Their variation in different tea species and varieties is unclear. Fresh shoots from 336 accessions of C. sinensis and its closely related species and varieties were harvested and their non-volatile metabolites were detected through UPLC-MS (ultra-performance liquid chromatography - mass spectrometry). A total of 374 non-volatile metabolites were identified, which can be divided into 27 categories. Among them, 32 compounds were flavonoid polymers. The tea plants were divided into two groups, according to the Calinski criterion according to the composition of metabolites. The top 30 differential metabolites in C. sinensis var. sinensis, C. sinensis var. assamica, C. sinensis var. pubilimba, C. tachangensis, and C. taliensis, belong to amino acids and their derivatives, benzoic acid derivatives, carbohydrates, coumarins, flavonol glycosides, organic acids, quinoline acid and its derivatives. The results provide new insights for further understanding the characteristic metabolites of tea plant and its closely related species and varieties.
-
Key words:
- Classification /
- Fresh shoots /
- Metabolites /
- Section Thea (L.) Dyer /
- Tea plants